Effect-based activities on air pollution:
What is the state of the natural and anthropogenic Italian ecosystems?
www.enea.it
Effect-based activities on air pollution: what is the state of the natural and anthropogenic Italian ecosystems?
Edited by Ilaria D’Elia, Alessandra De Marco, Giovanni Vialetto
Chapter 1 Chapter 2
Authors: Giovanni Vialetto, Alessandra De Marco, Tiziano Pignatelli, Antonio Ballarin-Denti Chapter 3
Authors: Ilaria D’Elia, Luisa Ciancarella, Antonio Piersanti, Giovanni Vialetto Chapter 4
Authors: Marco Ferretti, Giada Bertini, Filippo Bussotti, Laura Canini, Mario Cammarano, Roberto Canullo, Stefano Carnicelli, Guia Cecchini, Gianfranco Fabbio, Angela Farina, Daniele Giorgini, Matteo Feducci, Aldo Marchetto, Maurizio Marchi, Giorgio Matteucci, Khawla Zouglami
Chapter 5
Authors: Elisabetta Salvatori, Alessandra Campanella, Maria Chiesa, Lorenzo Cotrozzi, Angelo Finco, Lina Fusaro, Giacomo Gerosa, Giacomo Lorenzini, Riccardo Marzuoli, Cristina Nali, Romina Papini, Elisa Pellegrini,
Mariagrazia Tonelli, Fausto Manes Chapter 6
Authors: Maria Francesca Fornasier, Patrizia Bonanni, Marcello Vitale, Michele De Sanctis, Giuliano Fanelli, Fabio Attorre, Alessandra De Marco, Silvano Fares, Luca Salvati
Chapter 7
Authors: Michela Rogora, Aldo Marchetto, Rosario Mosello Chapter 8
Authors: Pasquale Spezzano, Giovanni Vialetto Chapter 9
Authors: Elena Paoletti, Elisabetta Salvatori, Fausto Manes, Chapter 10
Authors: Antonio Piersanti, Pierluigi Altavista, Carla Ancona, Giovanna Berti, Ennio Cadum, Luisella Ciancarella, Ilaria D’Elia, Francesco Forastiere, Marina Mastrantonio, Francesca Pacchierotti, Gaia Righini, Raffaella Uccelli Chapter 11
Authors: Ilaria D’Elia, Giovanni Vialetto, Luisella Ciancarella, Alessandra De Marco
2017 ENEA
National Agency for New Technologies, Energy and Sustainable Economic Development
ISBN 978-88-8286-344-9 Copy editing: Giuliano Ghisu Cover design: Flavio Miglietta
PREFACE
The Division Models and Technologies for Risks Reduction of the ENEA Sustainability Department was established in July 2015 with the specific aim of assemble all the resources, both human and instrumental, that could propose reflections, analyzes and assessments about the interactions among energy strategies, emissions of pollutants and greenhouse gases, air quality, climate change and resulting impacts on health and ecosystems.
The use of numerical models, at different spatial scales, to describe the physical and chemical processes affecting the atmosphere and the ocean is at the hearth of the history and activities of the research groups involved. Nevertheless, great effort and commitment was also dedicated to the development of integrated models to explore links and feedback between the different aspects of the same system. These unique platforms called IAM (Integrated Assessment Modelling) help and support policy-makers to develop and promote sustainable policies.
With this vision we have been developing the national model MINNI (Integrated National Model in support to the International Negotiation on Air Pollution) since 2003. It includes the Integrated Assessment Model GAINS-Italia, which helped our Country: to negotiate revisions of European and International Directives and Protocols with technical data and national scenario simulations; to support technically the actions needed to deal with European infringement procedures; to help the Regional Authorities to fully understand and use the measurements until they have become totally autonomous; to support the early season of the Air Quality Regional Plans together with the assessment of the measures identified in them.
A parallel and equally far-sighted vision has been offered by our colleagues of the actual Division who have been dealing for years with the “pollution effects”. They hold significant roles within the International Convention on Long Range Transboundary Air Pollution (CLRTAP) of the United Nations Economic Commission for Europe (UNECE) both as national representatives in the Executive Body and National Focal Point or Experts within technical Task Forces.
To date a lot of work has been done but we need more and more of each other’s expertize to move forward in the complexity. We cannot have disciplinary “exclusivity” because atmospheric pollution and its effects are no longer (and have never been) a single discipline theme. At the same time we must avoid that integration could generate only simplification.
The main intent of this publication and of this day is to take stock of the situation in Italy, sharing what has been done both on the atmospheric pollution and effects side as well as the many and important experiences of comparison and integration. We would like to start from here in order to deal with what Europe strongly advocates: that the definition of policies to face air pollution considers as a priority the reduction of its effects.
Rome, March 2017. Gabriele Zanini
C
ONTENTSPREFACE ... 3
CHAPTER 1 – Introduction ... 7
CHAPTER 2 - Effect Oriented Activities in the LRTAP Convention ... 10
CHAPTER 3 - Sources and Emissions of air pollutants ... 16
CHAPTER 4 - Actual and potential impact of air pollution on Italian forests: results from the long-term national forest monitoring networks under the ICP Forests ... 22
4.1 Introduction ... 22 4.2 Pressures ... 23 4.2.1 Status ... 23 4.2.2 Trend ... 25 4.3 Impacts ... 26 4.3.1 Forest health ... 26 4.3.2. Forest growth ... 27 4.3.3 Forest biodiversity... 29 4.3.4. Forest nutrition ... 32 4.4. Risk assessment... 34
4.4.1 Risk for forest health ... 34
4.4.2. Risk for forest growth ... 35
4.4.3. Risk for forest biodiversity ... 35
4.4.4. Risk for forest nutrition ... 36
4.5 Conclusions ... 37
CHAPTER 5 - Effects of air pollution on crops and semi-natural vegetation ... 40
5.1 Introduction ... 40 5.2 Pressures ... 40 5.2.1 Ozone ... 40 5.2.2 Nitrogen ... 42 5.3 Impacts ... 42 5.3.1 Ozone ... 42 5.3.2 Nitrogen ... 46 5.4 Risk assessment... 48 5.4.1 Ozone ... 48 5.4.2 Nitrogen ... 52
CHAPTER 6 - Biodiversity as an important indicator of soil acidity and eutrophication: the role of the modelling in preserving it ... 54
6.3.1 Biodiversity analysis with dynamic models... 60
6.3.2 Biodiversity analysis with statistical models. ... 62
6.4 Risk assessment... 66
6.5 Conclusions ... 67
CHAPTER 7 - The contribution of Italy to the ICP WATERS Programme ... 70
7.1 Introduction ... 70
7.2 Atmospheric pollution pressures on surface waters ... 72
7.3 Main impacts of atmospheric pollution on rivers and lakes ... 75
7.4 Deposition scenarios and risk assessment ... 78
7.5 Conclusive remarks ... 80
CHAPTER 8 - Are technical materials and cultural heritage exposed to air pollution risk? The contribution of Italy to ICP Materials ... 82
8.1 INTRODUCTION ... 82
8.2 Effects on materials ... 83
8.3 Effects on historic and cultural monuments and buildings. ... 85
8.4 Concluding remarks ... 87
8.5 Acknowledgments ... 87
CHAPTER 9 - Vegetation and urban air quality: recent findings ... 90
CHAPTER 10 – Effects of Air Pollution on Health ... 96
10.1 Introduction ... 96
10.2 Results ... 97
CHAPTER 11 - What remains to be done to reduce air pollution? ... 104
CHAPTER 1 – INTRODUCTION
In the last twenty years, a large effort has been carried out in the Italian community working on the impacts of atmospheric pollution on different ecosystems, both natural or anthropogenic. For long time the work was done without the necessary interconnection between the different sub-networks belonging to the Working Group on Effects. In order to bridge the gaps between scientists and policy makers, the communication between the work done in the different sub-groups has been recently improved and the realization of this monographic text is one of its first tangible result. The intent of the text is to collate information from the important fields of measurements and modeling to obtain dose-response relationships able to estimate the impacts of air pollutant on the different ecosystems.
Italy is the richest country of the world in terms of biodiversity, agricultural products and number of cultural heritage sites exposed to negative impacts of air pollution and climate change. The Italian country is formed by different peculiar ecosystems, from coastal area to forests, to cities included in the UNESCO list for cultural heritage. It is thus very important to protect our environmental and cultural heritage from environmental pressure and from anthropogenic footprint. A wide choice of measures to control atmospheric pollution and decrease the negative impacts on health and ecosystems is available and possible alternative methodologies, like for example the change in the human behaviours, could have a high importance in a future sustainable society.
More in general, the analysis of the Italian monitoring network shows that the health of the main natural ecosystems has improved, even if there is still some to be done at local level and for specific pollutants. For instance, due to the peculiar conditions of sun exposure and climate, the situation for ozone is still very critical in a Mediterranean environment.
In some cases, the efficacy of the strategies of controlling air pollution can be impaired by climate change, while in some others, strategies to reduce air pollution can be considered as win-win policies, because are beneficial from several points of view.
The revision of the National Emission Ceilings Directive (NECD) has established emission reduction targets focusing on the reduction of the impacts of air pollution on ecosystems and human health. This important change captured more attention to the monitoring activities of the impacts of air pollution on natural and anthropogenic ecosystems. This is an emerging issue to promote and to give the due importance to the activities of the Working Group on Effects. In this context, the Italian work has been developed to provide policymakers with a clear picture of what has already been achieved and what can still be done to protect our environment.
The key findings emerged from this work and from the different communities and networks are summarized in the following text.
The implementation of the Convention on Long-range Transboundary Air Pollution and its protocols has allowed reaching a significant success in reducing emissions, especially for sulphur, concentrations and deposition trends. Despite this success, exceedances of critical loads and level, of the air quality limit values and high population exposure still exist.
Forest condition has improved in Italy since the 1990s, with limited evidence of an impact due to tropospheric ozone. On the other side, there was a distinct effect of nitrogen deposition on forest nutrition, growth and carbon sequestration.
Biodiversity indices and habitat suitability index in forest sites are recovering consequently to decreasing in pollutant deposition.
Increasing background O3 levels in Italy still affect health, productivity and quality of
crops and (semi-) natural vegetation. The risk assessment should be based on the effective O3 dose absorbed through stomata, taking into account the different
species/cultivar sensitivity, and the concurrent effect of other stress factors, such as the reactive nitrogen deposition and climatic conditions typical of the Mediterranean area. The interactions between air quality and urban vegetation are potentially of great
interest, although understanding is still imperfect. In Italy, a few studies have been carried out to estimate potential uptake of pollutant by trees, in particular in two cities: Rome and Florence, in order to estimate and map this Regulating Ecosystem Service.
Surface water showed a widespread response to decreasing deposition of acidity, sulphate and nitrogen compounds, but the recovery was somewhat delayed, due to the interacting effect of several factors, such as nitrogen saturation of soils in the catchments and climate change.
Nitrogen deposition will continue to have a prominent role in the acidification processes and in the nitrogen status of surface water. The recovery patterns in the next future will be more and more influenced by climatic factors.
Atmospheric pollution is a key factor in the deterioration of sensitive materials and materials used in historical and modern cultural heritage are the most vulnerable to air pollution. Even if the decrease of concentrations of air pollutants has led to the decrease of deterioration rates (mainly due to the decrease of SO2), current corrosion
rates and soiling are still unacceptably high. The cost associated with the damages is enormous but difficult to estimate.
Health impact assessment of air pollution at national scale in Italy has been carried out in several projects, based on measured data and modelling tecniques. Results agreed on showing that PM10 and NO2 induce several thousands of premature deaths and
hospital admissions per year, due to cardiovascular and respiratory diseases. Confirming conclusions of previous European-scale assessments, air pollution is proved to be a major risk for human health in Italy.
Many solutions are available and only an integrated approach takes into account the co-benefits of linking air pollution and climate change. The integration of all the different tools, from measures to models, and the coordination among science sectors and different research teams could help in identifying effective environmental policy.
Effect Oriented
Activities in the
LRTAP Convention
Chapter coordinator: Giovanni Vialetto
Contributors: Giovanni Vialetto1, Alessandra De Marco1, Tiziano Pignatelli2, Antonio Ballarin-Denti3
1ENEA, Laboratory of Atmospheric Pollution, 2ENEA, Strategic Technical Support, 3University of Brescia “La Cattolica”
CHAPTER 2 - EFFECT ORIENTED ACTIVITIES IN THE LRTAP CONVENTION
The Convention on Long-range Transboundary Air Pollution (CLRTAP – see web site
http://www.unece.org/env/lrtap/welcome.html) has achieved successful results in reducing the emissions of a wide range of atmospheric pollutants and consequently in decreasing acidification and eutrophication processes, in soothing ozone peak levels of ozone and photochemical smog, and in ensuring improvements in nitrogen atmospheric levels and deposition rates. The Convention has also proved to be flexible and dynamic in responding to new challenges and problems raised by the transboundary air pollution. The Convention has been also a powerful driver to promote a sound science-for-policy approach to relevant environmental problems not just transferring valuable knowledge and datasets from the scientific community to the decision-makers and involved stakeholders, but also supporting and fostering the whole policy-making process.
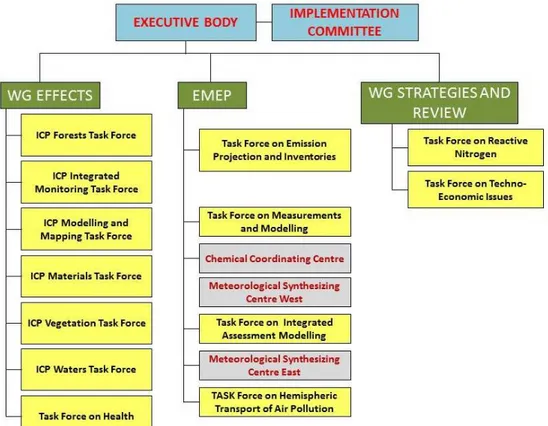
However, despite the progress achieved under the Convention, the air quality in the UNECE region is still matter of concern, given its persistent impacts on human health and ecosystems while new environmental problems are emerging (ECE, 2010). A solid and widely recognized scientific basis has been a key success factor for the Convention’s outcomes in air pollution abatement. This was enabled by the development of a common and shared knowledge-providers network based on a large system of scientific facilities s managed by authoritative research organizations and aimed at monitoring and modelling a wide set of environmental parameters and ensuring an intense and interdisciplinary exchange of scientists across all the UNECE countries. In addition, the Convention has provided an open-innovation platform for scientists and policymakers to exchange information which has led to a growing and fruitful international cooperation, creating mutual trust, higher policy-harmonization, and the dissemination of good practices in environmental monitoring and assessment. In order to organize its work, the Convention has created an appropriate functional structure, based on expert groups, task forces and research centres. The updated structure of the Convention is showed in Fig. 1.1.
Acidification of soil and water was the main environmental problem in the seventies, caused by the high levels of sulphur and nitrogen atmospheric emissions. Therefore, the reduction of these pollutants was considered as the most urgent need. In the following years, new harmful atmospheric pollutants drew the attention of both the scientific and political community and were thus included into the Convention’s protocols. At the same time, new pollutants were being considered in the upcoming policies, such as Non-Methane Volatile Organic Compounds (NMVOC), Heavy Metals (HMs), Persistent Organic Pollutants (POPs), Ozone (O3), Particulate Matter (PM) and, more recently Black Carbon (BC).
While the first protocols developed under the Convention focused on technologies capable to reduce emissions, protocols negotiated since the 1990s adopted an effect-oriented approach, aiming at the best cost-effective way to reach the set reduction targets. At the same, it was also recognized that various air pollutants may interact in the atmosphere, thus leading to combined or even synergistic impacts and often depending on the same emission sources. This made a substance-by-substance approach less efficient and was the reason why the so-called multi-pollutant-multi-effect approach was developed. The first protocol based on this new approach was the 1999 Gothenburg Protocol to Abate Acidification, Eutrophication and Ground-level Ozone (EB, 1999).
Figure 1.1 – Updated structure of the Convention on Long Range Transboundary Air Pollution.
With the revision of the Gothenburg Protocol, approved in 2012 (ECE, 2012a,b), a further step forward was made, and the particulate matter (PM2,5 fraction) was also introduced into the Protocol. The focus of the Protocols is targeted to the health protection, which becomes the basis for the optimized emission reduction allocation and commitments for each Party and in doing so, the Convention has achieved considerable success in solving environmental and health problems. These successes are largely due to the scientific grounds of the Convention and the unique way in which science affects any further policy development (look for example Maas et al., 2016). Another key success factor is represented by the Convention’s wide geographical coverage. In fact, the Convention embraces most of the northern hemisphere from the West Coast of North America to the Pacific Coast of the Russian Federation (see fig. 1.2).
Figure 1.2 – Map showing the Convention on Long-Range Transboundary Air Pollution signatories.
Italy has a long tradition of activities in the UN-ECE Convention on Long Range Transboundary Air Pollution (UN-ECE LRTAP), since its signature on 14 November 1979, in Geneva and the ratification by the Parliament, occurred on 15 July 1982. The Convention was adopted on 13
Table 1.1 – Status of signature and ratification by Italy of the Protocols of the LRTAP Convention.
Treaty Signature
Ratification, Acceptance, Approval, Accession,
Succession
LRTAP Convention 14-Nov-79 15 Jul 1982
The 1984 Geneva Protocol on Long-term Financing of the
Cooperative Programme for Monitoring and Evaluation of the Long-range Transmission of Air Pollutants in Europe (EMEP)
28-Sep-84 12 Jan 1989
The 1985 Helsinki Protocol on the Reduction of Sulphur Emissions
or their Transboundary Fluxes by at least 30 per cent 09-Jul-85 5 Feb 1990
The 1988 Sofia Protocol concerning the Control of Emissions of
Nitrogen Oxides or their Transboundary Fluxes 01-Nov-88 19 May 1992
The 1991 Geneva Protocol concerning the Control of Emissions of
Volatile Organic Compounds or their Transboundary Fluxes 19-Nov-91 30 Jun 1995
The 1994 Oslo Protocol on Further Reduction of Sulphur Emissions 14-Jun-94 14 Sep 1998
The 1998 Aarhus Protocol on Heavy Metals 24-Jun-98 Not yet ratified
The 1998 Aarhus Protocol on Persistent Organic Pollutants (POPs) 24-Jun-98 20 Jun 2006
1999 Protocol to Abate Acidification, Eutrophication and Ground-level Ozone to the Convention on Long-range Transboundary Air Pollution (Gothenburg Protocol)
01-Dec-99 Not yet ratified
In the following decades 8 Protocols were developed, adopted, signed and ratified by a number of Parties. The table 1.1 summarizes the status of signature and ratification by Italy.
The Protocols on Heavy Metals, on POPs and the Protocol to Abate Acidification, Eutrophication and Ground-level Ozone, have been amended and adopted, respectively on 13 December 2012 (Heavy Metals), on 18 December 2009 (POPs), on 4 May 2012 (Gothenburg Protocol). The ratification process of these last three Protocols is still in progress for Italy, although the European Union has accepted both the amended Protocol on Heavy Metals and the amended Protocol on POPs. The last three Protocols, in the amended version mentioned above, are not yet entered into force because the minimum number of ratification by the Parties has not yet been achieved.
The Italian experts participate actively in the works of many technical bodies of the LRTAP Convention. Notably, within the Working Group on Effects, the International Cooperative Programme on Effects of Air Pollution on Materials, including Historic and Cultural Monuments sees the Co-Chair of Italy, since 2005, currently in the person of Pasquale Spezzano. As well, the Task Force on Techno-Economic Issues has the Italian Co-Chair Tiziano Pignatelli, involved since 2006. Moreover, several scientific studies are being conducted under the leadership and /or responsibility of the Italian experts.
Moreover, during the very first discussions on the Convention, it was immediately recognized that a good understanding of the harmful effects of air pollution was a prerequisite for reaching agreement on effective pollution control. To develop the necessary international cooperation in the research on and the monitoring of pollutant effects, the Working Group on Effects (WGE) was established under the Convention in 1980.
The Working Group on Effects provides the Convention’s Executive Body with sound and shared scientific information on the degree and geographic extension of the impact of major air pollutants on the human health and some relevant natural and human-heritage targets like water, forests, vegetation and materials.
Such information is the result of monitoring activities on the effects caused by atmospheric pollution across Europe and North America, and are based upon scientific research on dose-response relationships, critical loads and damage evaluation.
WGE is composed by six International Cooperative Programmes (ICPs) and the Task-force on Health. Each ICP includes a Task-Force and a Coordination Centre with the aim of collecting data from monitoring networks. For each ICP, a National Focal Centre (NFC) is established, with the aim to coordinate the national activities, participate in the works of the task-forces, and submit data to the Coordination Centres.
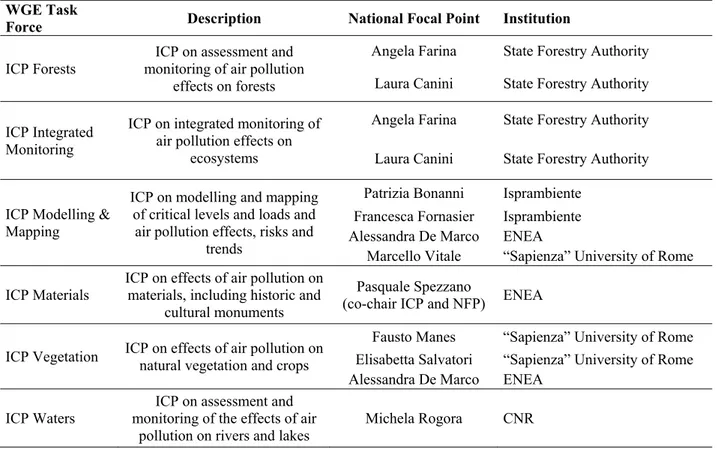
Italy, as Party of the Convention, is therefore committed to appoint the NFCs, to establish and control the monitoring networks, to submit the required data and to participate in the activities of the task-forces. The head of the Italian Delegation to WGE is Alessandra De Marco (ENEA), and the other delegation members are Antonio Ballarin-Denti (Catholic University of Brescia) and Sergio Cinnirella (CNR). All the national Focal Points are reported in table 1.2.
Table 1.2 – All the National Focal Points to the different International Cooperative Programme under the LRTAP Convention.
WGE Task
Force Description National Focal Point Institution
ICP Forests monitoring of air pollution ICP on assessment and effects on forests
Angela Farina State Forestry Authority Laura Canini State Forestry Authority ICP Integrated
Monitoring
ICP on integrated monitoring of air pollution effects on
ecosystems
Angela Farina State Forestry Authority Laura Canini State Forestry Authority ICP Modelling &
Mapping
ICP on modelling and mapping of critical levels and loads and air pollution effects, risks and
trends
Patrizia Bonanni Isprambiente Francesca Fornasier Isprambiente Alessandra De Marco ENEA
Marcello Vitale “Sapienza” University of Rome ICP Materials ICP on effects of air pollution on materials, including historic and
cultural monuments
Pasquale Spezzano
(co-chair ICP and NFP) ENEA ICP Vegetation ICP on effects of air pollution onnatural vegetation and crops
Fausto Manes “Sapienza” University of Rome Elisabetta Salvatori “Sapienza” University of Rome Alessandra De Marco ENEA
ICP Waters monitoring of the effects of air ICP on assessment and pollution on rivers and lakes
Sources and Emissions of air
pollutants
Chapter coordinator: Ilaria D’Elia
Contributors: Ilaria D’Elia1, Luisa Ciancarella1, Antonio Piersanti1, Giovanni Vialetto1
CHAPTER 3 - SOURCES AND EMISSIONS OF AIR POLLUTANTS
Air pollution is a very important environmental and social issue that poses multiple challenges in terms of management and mitigation (EEA, 2015). Air pollution represents the single largest environmental health risk in Europe and particulate matter has become a major concern for public health whose carcinogenicity has been recognized by the International Agency for Research on Cancer (IARC, 2015). Many measures and policies have been adopted in the past decades at European, national, regional and even local level but a large portion of European population and ecosystems is still exposed to concentrations that exceed the European Union (EC, 2008) and the World Health Organization (WHO, 2005) air quality standards. In this view, the Gothenburg protocol was amended in 2012 and, in 2013, the European Commission adopted the Clean Air Policy Package (COM, 2013) with the aim to further reduce the impacts of harmful emissions on human health and the environment.
Air pollutants are emitted from anthropogenic and natural sources; they may be either emitted directly or formed in the atmosphere and they have a number of impacts on health, ecosystems, the built environment and the climate.
Figure 3.1 shows the trend of the Italian emissions of sulphur oxides (SOX), nitrogen oxides (NOX), ammonia (NH3), primary PM with a diameter of 10 μm or less (PM10) and PM with a diameter of 2.5 μm or less (PM2.5), non-methane volatile organic compound (NMVOC), carbon monoxide (CO) and methane (CH4) between 1990 and 2014. Similarly, figure 3.1 shows the trend in emissions of the toxic metals arsenic (As), cadmium (Cd), nickel (Ni), lead (Pb), mercury (Hg), Polycyclic Aromatic Hydrocarbon (PAH) and dioxins (Diox). In the period 1990-2014, in Italy almost all the primary and precursor emissions have decreased (IIR, 2016). Reductions are especially relevant for the main pollutants, SOX (-93%); NOX (-61%); CO (- 69%); NMVOC (-57%) and Pb (-94%), while NH3 shows the smallest reduction (-17%).
Effective action to reduce the impacts of air pollution requires a good understanding of its causes, how pollutants are transported and transformed in the atmosphere, and how they impact on humans, ecosystems and the climate.
Source: Based on IIR, 2016.
Figure 3.1 – Trend in Italian emissions of SO2, NOX, NH3, PM10, PM2.5, NMVOC, CO and CH4 (top) and of As, Cd,
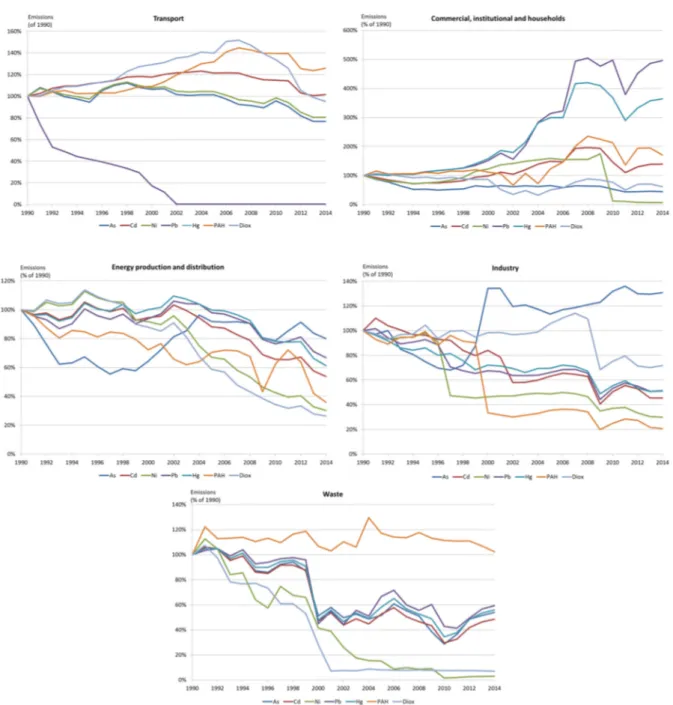
The major drivers for the trend are reductions in the industrial and road transport sectors, due to the implementation of various European Directives which introduced new technologies, plant emission limits, the limitation of sulphur content in liquid fuels and the shift to cleaner fuels (fig. 3.2). Emissions have also decreased for the improvement of energy efficiency as well as the promotion of renewable energy.
In the following plots, an analysis of the Italian emission trend by sector in the period 1990-2014 is shown. The main source sectors contributing to emissions of air pollutants in Italy are transport, energy, industry, the commercial, institutional and households sector, agriculture and waste.
The transport sector has considerably reduced its emissions of air pollutants in Italy since 1990, as figures 3.2 and 3.3 show, except for PAH emissions, which have increased by 26% from 1990 to 2014. The highest emission reductions from transport between 1990 and 2014 were registered for SOX (90%) and for Pb (100%).
With the exception of SOX emissions, the commercial, institutional and household sector has significantly increased its emissions, whose trend follows the fuelwood consumption variation. This emission increase is due to the use of household wood and other biomass combustion for heating, owing to government incentives/subsidies, rising costs of other energy sources, or an increased public perception that it is a ‘green’ option (EEA, 2015). Biomass is being promoted as a renewable fuel that can assist with climate change mitigation and contribute to energy security.
Energy production and industry considerably reduced their air pollutant emissions between 1990 and 2014, with the exception of As emissions from the industrial sector.
Agriculture is the main sector in which emissions of air pollutants have least decreased while waste sector shows a great emission reduction in Diox emissions.
Source: Based on IIR, 2016.
Figure 3.3 – Trend in Italian emissions from main sources of As, Cd, Ni, Pb, Hg, PAH and Diox, 1990-2014 (% of 1990 levels).
Source: Based on IIR, 2016.
Figure 3.4 – Main emitting sectors for the main pollutants in the year 2014.
The main emitting sectors in the year 2014 according to the last national emission inventory (IIR, 2016), are shown in fig. 3.4.
Industry is the largest source of SOX, As, Cd, Ni, Pb, Hg and Diox, whose emissions respectively represent the 49%, 90%, 53%, 41%, 65%, 60% and 49% of total national emissions.
The transport sector is the biggest contributor to NOx emissions, accounting for 69% of total Italian emissions in 2014. However, NOX emissions from road transport have not been reduced as much as expected with the introduction of the Euro standards, since emissions in real-life driving conditions for diesel vehicles are often higher than those measured during the approval test.
The commercial, institutional and household sector is by far the most important sector of primary PM10, PM2.5 and PAH emissions contributing respectively to 57%, 65% and 71% of total PM10, PM2.5 and PAH total emissions. Moreover, it is the second most significant emitter of Diox, CO, Cd, Pb and Hg. This sector surely represents a key sector in reducing air pollutant emissions. The agricultural sector is the greatest emitter of NH3 and was responsible for 96% of total NH3 emissions in Italy in 2014. NH3 emissions have decreased by only 17% from 1990 to 2014 because European policies have cut PM precursor gas emissions, with the exception of NH3 from agriculture (EEA, 2015).
Emissions have decreased in many sectors except for the commercial, institutional and households sector, whose emissions showed an increase for almost all pollutants and agriculture which showed the lowest reduction. As a consequence, the commercial, institutional and households and agricultural sectors still have a high potentiality to reduce emissions and improve air quality.
In order to reduce the harmful effects of atmospheric pollutants, the National Emission Ceilings Directive (NECD) (EC, 2001) sets EU Member States individual air pollutant emission limits, or ‘ceilings’, restricting emissions for four important air pollutants: nitrogen oxides (NOX), non-methane volatile organic compounds (NMVOC), sulphur dioxide (SO2) and ammonia (NH3).
Table 3.1 – Italian progress in meeting ceilings set out in NECD Annexes (EC, 2001). Emission inventory (kt) Pollutant NEC Ceilings 2010
(kt) 2010 2011 2012 2013 2014
SO2 475 217 195 176 145 131
NOX 990 978 950 867 816 790
NMVOC 1159 1046 954 942 909 849
NH3 419 389 402 415 402 393
As of 2010, all Member States are required to meet their emission ceilings. Italy respects its emissions ceilings for all the four pollutants during the period 2010 to 2014 as shown in table 3.1. Many measures and policies have been adopted in the past decades at European, national, regional and even local level but a large portion of European population and ecosystems is still exposed to concentrations that exceed the World Health Organization (WHO, 2005) and the European Union air quality standards (EC, 2008). In this view, in 2013, the European Commission adopted the Clean Air Policy Package (COM, 2013), with the aim to further reduce the impacts of harmful emissions on human health and the environment, where the proposal for a revised National Emission Ceilings Directive (NECD) plays a major role.
Actual and potential impact of
air pollution on Italian forests:
results from the long-term
national forest monitoring
networks under the
ICP Forests
National Focal Point: Angela Farina and Laura Canini (State Forestry Authority) Chapter coordinator: Marco Ferretti
Contributors: Marco Ferretti1,2, Giada Bertini3, Filippo Bussotti4, Laura Canini5, Mario Cammarano6,
Roberto Canullo7, Stefano Carnicelli8, Guia Cecchini8, Gianfranco Fabbio3, Angela Farina5, Daniele Giorgini7,
Matteo Feducci4, Aldo Marchetto9, Maurizio Marchi3, Giorgio Matteucci10, Khawla Zouglami7
1Swiss Federal Research Institute WSL; 2formerly at TerraData environmetrics; 3CREA-Centro di ricerca per la
selvicoltura; 4 Università di Firenze - Dipartimento di Biotecnologie Agrarie, Sezione di Botanica Ambientale ed
Applicata; 5State Forestry Autority; 6CNR-Istituto di Biologia Agroambientale e Forestale; 7 Università di Camerino -
CHAPTER 4 - ACTUAL AND POTENTIAL IMPACT OF AIR POLLUTION ON ITALIAN FORESTS: RESULTS FROM THE LONG-TERM NATIONAL FOREST MONITORING NETWORKS UNDER THE ICP FORESTS
This Chapter was prepared for the most part on the basis of evaluations carried out within the LIFE project “Sustainable Monitoring And Reporting To Inform Forest and Environmental Awareness and Protection – SMART4Action” [LIFE13 ENV/IT/000813].
4.1 Introduction
Forests in Italy cover ca. 8.76 x 10⁶, stock 1,242 Mt carbon and offer a series of invaluable products and services to the entire society (Gasparini and Tabacchi, 2011; Gasparini et al., 2013). Preserving forest integrity is therefore essential. Although effects are in general less obvious and frequent in comparison with other biotic and abiotic stressors, air pollution may have an impact on several compartments of forest ecosystem, and may endanger forest health, productivity and diversity (Bobbink et al., 2010; Karnosky et al., 2003). In this chapter, we will present status, trends of pressure, impacts and risks placed to forests by the most important air pollution issues in Italy as emerged from data collected by national forest monitoring networks since the mid of the 1990s. To do this, we will concentrate on data originated from harmonized measurements carried out at the national Level I and Level II networks that are parts of the UNECE ICP Forests (Figure 4.1).
Figure 4.1 – Level I (small black dots) and Level II (large colored symbols) networks in Italy. Colors refer to main tree species in Level II plot (source: LIFE SMART4Action).
4.2 Pressures
Deposition of oxydized (NOx) and reduced nitrogen (NHy) and tropospheric ozone (O3) are the most important air pollution forest-related issues in Italy and elsewhere. Both N deposition and ozone levels have been measured at the sites of the Italian ICP Forests Level II network since the 1990s. Atmospheric deposition is collected in the open field and under forest canopy (throughfall) by different set of funnels (Figure 4.2A). Stemflow collectors (Figure 4.2B) are used in beech plots to collect precipitation running along stems. Ozone concentration is measured using passive samplers (Figure 4.2C) since 1996. A further set of ozone measurements have been carried out over the period 2007 - 2011 on 15 Level I plots in Trentino (Northern Italy) (Gottardini et al., 2010).
A B C
Figure 4.2 – Collectors used for open field and throughfall (A), stemflow (B), and ozone passive samplers (C).
4.2.1 Status
Sampling and analysis of atmospheric deposition and of ozone was carried out on a variable number of plots, depending on funding. In particular, in 2009-2011 this activity was carried out and validated on 21 plots. Throughfall deposition represents a good estimate of the deposition reaching the forest soil. The geographic distribution of average throughfall deposition for 2009-2011 of some selected ions and of the pH values obtained from the volume weighted average of hydrogen ion deposition is shown in Figure 4.3.
All the plots show pH values higher than> 5, mostly around the equilibrium value of 5.6. In the case of sulphate deposition (corrected for the amount deriving by marine aerosol - (CLRTAP, 2004), a geographic pattern is evident, with lower values on the Alps, and higher values in the Southernmost plots. Due to the episodic deposition of Saharan dust, this is leading to episodes with high sulphate and calcium concentration. In the case of nitrate, ammonium and total N (which includes N in organic compounds), high values were measured in the Po plain (where most of industries and farming are located) and in the surrounding hills, while lower values were detected in high elevation Alpine sites.
Figure 4.3 – Annual deposition of selected ions and average ozone concentration during the growing season at Level II sites, 2009-2011. Site codes in Figure 4.1. (Source: LIFE SMART4Action).
As for ozone, average concentration during the growing season was in general > 40 ppb in all sites, with slightly higher values in the Southern regions and in the Adriatic part of the peninsula (Figure
Figure 4.4 – Mean 2000-2003 AOT40 at 26 Italian Level II sites (dots) and 41 background conventional monitoring stations over the period 2000-2003. After Ferretti et al., 2007.
Table 4.1. Ozone flux estimates available for Level II sites in Italy.
Site Year Reporting unit Flux
estimate Reference
CAL1 2000-2002 seasonal AFst, (mmol O3 m-2) 8-10 Schaub et al., 2007
TOS1 2005 seasonal AFst1.6, (mmol O3 m-2) 53 Bussotti and Ferretti, 2007
TOS2 2005 seasonal AFst1.6, (mmol O3 m-2) 49 Bussotti and Ferretti, 2007
LAZ2 2005 seasonal AFst1.6, (mmol O3 m-2) 47 Bussotti and Ferretti, 2007
TRE1 1999-2011 seasonal AFst1.6, (mmol O3 m-2) 22-35 Gottardini et al., 2012
Accumulated ozone above threshold 40 ppb (AOT40) was estimated to exceed up to 10 times the Critical Level set to protect vegetation (Gerosa et al., 2003, 2007; Ferretti et al., 2007) (Figure 4.4). In terms of ozone flux, estimates were obtained for some Level II sites at individual years (Table 4.1) (Bussotti and Ferretti, 2007).
4.2.2 Trend
Figure 4.5 shows the temporal trend of sulphate, nitrate, and ammonium deposition and ozone concentration in nine forest sites with complete 1997-2013 dataseries. A marked decrease in sulphate deposition is evident in all sites at the end of the 1990s, while the reduction is less evident in the more recent period. Sulphate reduction resulted statistically significant (Seasonal Kendall test on monthly data, p<0.01) in eight out of nine sites. In the case of nitrate and ammonium, a slight decrease was evident only in the last years and it was significant (p<0.05) only in four and one site, respectively.
Figure 4.5 – Temporal trend in deposition of selected ions in nine Level II forest plots in Italy. (Source: LIFE SMART4Action).
Ozone concentration increased between 1997 and 2005, and decreased between 2005 and 2011 (Figure 4.5). The decreasing pattern is confirmed over the most recent years. As for ozone flux trend, information is available only for one Level II plot, namely TRE1 (Gottardini et al., 2012). At this site, ozone flux in terms of accumulated flux above 1.6 (AFst1.6) follows the same time pattern as AOT40, augmenting from 25 to 35 mmol m2 PLA between 1999 and 2005, and decreasing to ca. 27 mmol m2 PLA between 2006 and 2009 (Gottardini et al., 2012).
4.3 Impacts
N deposition may affect soil chemistry, nutrient balance, alter species-host interactions, biomass allocation, sensitivity to climate and to ozone. Ozone may reduce photosynthesis, cause premature senescence and direct injury to foliage. All together, this may have direct and indirect impact on forest health, growth, plant species diversity, and nutrition.
4.3.1 Forest health
In Italy, forests health has been measured under quality assured conditions since 1997. The most reliable variable adopted was (and is) defoliation, assessed both on Level I (ca. 250 plots) and Level II (31 plots) networks (see Figure 4.1). Direct injury to foliage due to ozone has been also assessed on some sites.
On Level I, mean defoliation for the 1997-2014 period was higher in broadleaves (39.7% of trees with defoliation higher than 25%) than in conifers (24.1%). Defoliation shows lower level in the South (30.7%) with respect to the North (35.5%) and Central (36.0%) Italy. Broadleaves were more defoliated (43.6%) in Northern Italy and less defoliated (35.8%) in Southern Italy. In conifers,
Figure 4.6 – A) Percentage of trees with defoliation higher than 25% in the Level I plots, year -2014. B) 1997-2014 trend of the percentage of trees with defoliation >25%. Plots with at least 10 years of observations were analyzed with
Mann-Kendall test. Significant increases (positive, red) and decreases (negative, green) of defoliation are indicated. (Source: LIFE SMART4Action).
The distribution of the defoliated trees (>25%) at each Level I plot (Figure 4.6A) reveals higher frequency in the North-Western regions of Italy (Piedmont, Lombardy, Liguria and partly the Northern areas of Tuscany). The analysis of the 1997-2014 trends (Figure 4.6B) evidenced that plots with significant increase of defoliated trees were concentrated especially in the Northern regions and in the Alpine area. All in all, however, there is a significant (P<0.01) decreasing trend for defoliation, mostly driven by broadleaves.
Level II results confirm substantially the pattern described for the level I. Defoliation is increasing in Northern Italy (with the exception of VAL1) and decreasing in Central and Southern Italy (with the exception of LAZ1).
Foliar symptoms attributable to ozone injury were assessed at 12 Level II sites over the period 2003-2009 (Bussotti and Ferretti, 2007, 2009; Gottardini et al., 2012) and on a subset of Level I plots in Trentino in 2008-2009 (Gottardini et al., 2012). While no symptom was reported for Level I plots in Trentino, 46 taxa were found symptomatic at the investigated Level II sites. Off-plot investigation carried out nearby Level I plots in Trentino revealed symptoms on additional species, noticeably on Viburnum lantana (Gottardini et al., 2012).
4.3.2. Forest growth
Forest growth has been monitored since 1997 on Level II plots, and 17 plots have full coverage of the monitoring period 1997-2015 (i.e. five subsequent inventories). Current volume increment (IcV,
by the Italian National Forest Inventory (Tabacchi et al., 2011). Concerning absolute values and expected trends, data are summarized in Table 4.2.
Table 4.2 – Estimated volume and increments for the 17 CONECOFOR plots (hf=high forests; sc=stored coppices; tc=transitory crops). Standard deviation is reported in italic. (Source: LIFE SMART4Action).
Volume (m3ha-1) Current volume increment
(m3ha-1yr-1)
Mean volume increment (m3ha-1yr-1)
Plot Age Type 1997 2000 2005 2010 2015 2000 2005 2010 2015 1997 2000 2005 2010 2015 ABR1 130 hf 430.3 476.9 524.9 596.0 629.6 15.5 9.6 14.2 6.7 3.8 4.1 4.4 4.8 4.8 CAL1 130 hf 539.2 596.5 682.7 743.9 795.4 19.1 17.2 12.2 10.3 4.8 5.2 5.7 6.0 6.1 CAM1 120 hf 711.3 777.5 835.2 882.4 948.1 22.1 11.5 9.5 13.1 7.0 7.4 7.6 7.7 7.9 FRI2 120 hf 740.3 808.0 892.3 962.6 935.9 22.6 16.9 14.1 -5.3 7.3 7.7 8.1 8.4 7.8 LOM1 100 hf 369.3 416.4 478.9 561.3 676.8 15.7 12.5 16.5 23.1 4.5 4.9 5.3 5.9 6.8 PUG1 95 hf 563.0 605.7 658.5 689.9 754.8 14.2 10.6 6.3 13.0 7.3 7.6 7.7 7.7 7.9 TRE1 210 hf 667.8 742.9 762.6 813.4 866.2 25.0 3.9 10.2 10.6 3.5 3.8 3.8 4.0 4.1 VAL1 160 hf 481.8 503.9 549.5 598.7 648.6 7.4 9.1 9.8 10.0 3.4 3.5 3.7 3.9 4.1 VEN1 140 hf 455.2 502.3 552.2 608.1 658.5 15.7 10.0 11.2 10.1 3.7 4.0 4.2 4.5 4.7 EMI1 65 sc 199.6 209.1 225.2 239.1 238.2 3.2 3.2 2.8 -0.2 4.2 4.2 4.1 4.0 3.7 EMI2 65 sc 215.4 241.4 289.2 320.8 355.6 8.7 9.6 6.3 7.0 4.6 4.8 5.3 5.3 5.5 LAZ1 55 sc 152.6 177.4 190.3 211.7 233.1 8.3 2.6 4.3 4.3 4.1 4.4 4.2 4.2 4.2 MAR1 55 sc 235.0 248.8 266.1 294.2 332.3 4.6 3.5 5.6 7.6 6.4 6.2 5.9 5.9 6.0 SAR1 70 sc 246.9 261.9 261.7 281.9 311.6 5.0 0.0 4.0 5.9 4.7 4.8 4.4 4.3 4.5 TOS1 70 sc 198.6 215.5 238.5 257.7 291.5 5.6 4.6 3.8 6.8 3.8 3.9 4.0 4.0 4.2 PIE1 80 tc 253.0 279.9 307.3 341.1 372.9 9.0 5.5 6.8 6.4 4.1 4.3 4.4 4.5 4.7 SIC1 70 tc 196.3 216.6 211.8 226.9 241.9 6.8 -1.0 3.0 3.0 3.8 3.9 3.5 3.5 3.5 High forests 550.9 603.3 659.6 717.4 768.2 17.5 11.3 11.5 10.2 5.0 5.4 5.6 5.9 6.0 ±130. 9 ±142. 6 ±146 ±142. 8 ±125 ±5.4 ±4.1 ±3.1 ±7.4 ±1.7 ±1.7 ±1.8 ±1.7 ±1.6 Stored coppices 208.0 225.7 245.2 267.6 293.7 5.9 3.9 4.5 5.2 4.6 4.7 4.6 4.6 4.7 ±33.2 ±31 ±34.9 ±39.4 ±49.8 ±2.2 ±3.2 ±1.3 ±2.9 ±0.9 ±0.8 ±0.8 ±0.8 ±0.9 Transitory crops 224.7 248.2 259.5 284.0 307.4 7.9 2.3 4.9 4.7 3.9 4.1 4.0 4.0 4.1 ±40.1 ±44.8 ±67.5 ±80.8 ±92.6 ±1.6 ±4.6 ±2.6 ±2.4 ±0.2 ±0.3 ±0.6 ±0.7 ±0.9
High forests include stands from 95 to 210 years old and are characterized by an average volume of 550.9 m3 ha-1 in 1997 and 768.2 m3 ha-1 in 2015. Stored coppices include stands from 55 to 70 years with an average volume of 208.0 m3 ha-1 in 1997 and 293.7 m3 ha-1 in 2015. Transitory crops included just two plots ranging from 70 to 80 years and with an average volume of 224.7 m3 ha-1 in 1997 and 307.4 m3 ha-1 in 2015.
A positive trend in standing volume has been observed over the concerned period for all the forest types considered (Figure 4.7A). Between 1997 and 2015 high forests had an average increase of 11.84 m3 ha-1 per year, more than double if compared to stored coppices and transitory crops (4.62 m3 ha-1 per year and 4.34 m3 ha-1 per year respectively), which are characterized also by similar trends.
Figure 4.7 – Trends in volume (A), current increment (B) and mean increment (C) at Level II plots in Italy. (Source: LIFE SMART4Action).
The analysis of increments (Figures 4.7 B, C) revealed that high forests are characterized by a decreasing IcV (10.2 m3 ha-1 per year in 2010-2014), but still higher and distant from ImV (6.0 m3 ha-1 per year in 2010-2014). For stored coppices and transitory crops, IcV is decreasing (5.2 m3 ha-1 per year and 4.7 m3 ha-1 per year in 2010-2014, respectively) and very close to ImV (4.7 m3 ha-1 per year and 4.1 m3 ha-1 per year in 2010-2014), meaning that the latter is very close to the culmination. The strongest variation of IcV among subsequent inventory periods (Figure 4.7B) has been recorded for the 2000-2005 as a possible effect of the well-known 2003 heat wave, as reported by various Authors across Europe (Ciais et al., 2005; Leuzinger et al., 2005; Bertini et al., 2011). This variation was much more evident in high forests and less obvious in coppices and transitory crops.
4.3.3 Forest biodiversity
Forest biodiversity has been assessed mostly as diversity of vascular plant species in the Italian forest monitoring networks, Level I and Level II.
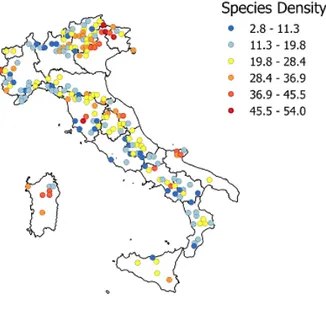
Level I was surveyed in 2007 by means of four 10x10 m Sampling Units (SU) on 201 selected plots, according to a harmonised manual (Canullo et al., 2007). It is considered as the representative baseline for the assessment of vascular plant diversity in Italian forests. As grouping factors, the Biogeographical regions and the EFCTs Forest types (EEA 2007, 2012) have been assumed. The spatial distribution of α-diversity across Level I plots in Italy is given in Figure 4.8, with vascular
A B
Figure 4.8 – Species density (no. of species x 100 m-2) as result of mean species richness between 4 SU on each site.
(Source: LIFE SMART4Action).
Non Metric Multidimentional Scaling (NMDS) analysis ordinates the sites in terms of similarity of species composition: the most clustered groups by EFTC Forest types are well separated and distributed according both to Latitude and Biogeographical regions (Alpine coniferous forests, Mountainous beech forest, Thermophilous deciduous forests, Broadleaved evergreen forests; Figure 4.9).
Figure 4.9 – Non Metric Multidimentional Scaling plot shows the relation between species composition (Jaccard dissimilarity index) and the EFTC. R = 76.8%; stress ≈ 22%. 3 - Alpine coniferous forests; 5 - Oak-hornbeam forests;
6 - Beech forests; 7 - Mountainous beech forest; 8 - Thermophilous deciduous forests; 9 - Broadleaved evergreen forests; 10 - Coniferous forests of the Mediterranean region; 13 - Native plantations;
14 - Exotic plantations and woodlands. (Source: LIFE SMART4Action).
The sampling design in the Level II sites includes 12 10x10 m SUs (Canullo et al., 2013) and proved to capture at least 80% of the expected number of terricolous plant species (including Vascular, Lichens and Bryophytes). For vascular plants, species density was proved to be a good proxy for plot richness (Ferretti et al., 2006). Validated, continuous and comparable datasets cover
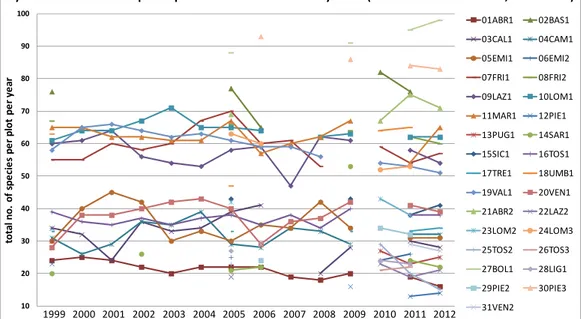
Figure 4.10 –Time pattern of total number of species at individual Level II plots. (Source: LIFE SMART4Action).
Linear model for plant species density (no. of species * 100 m-2) was tested for the selected plots. (within-subject contrasts RMANOVA. Table 4.3). Significant trends (P<0.05) were detected at CAM1 (Campania, South Italy, beech) where the beech forest shows there is an increasing species density, and at LOM1 (Lombardy, North Italy, Norway spruce), with a noticeable reduction in α-diversity of the transitional Spruce community (R2=0.79).
Table 4.3 – Linear model for species density (no. of species * 100 m-2) at the selected Level II plots
over the period 1999-2012. Italics: p<0.10; bold: p<0.05. (Source: LIFE SMART4Action).
Level II site R2 p SE regr b ABR1 0,323 0,061 4,815 -0,095 CAL1 0,028 0,099 4,671 -0,111 CAM1 0,118 0,023 9,608 0,171 EMI1 0,046 0,053 3,616 0,067 FRI1 0,055 0,141 4,526 0,111 LAZ1 0,008 0,626 1,562 0,042 LOM1 0,789 0,029 12,153 -0,259 MAR1 0,081 0,149 5,221 -0,110 TOS1 0,104 0,469 2,482 -0,055 VAL1 0,024 0,380 2,204 -0,053 VEN1 0,006 0,371 1,947 0,035
Trends in the species density appear a combination of previous management impact, present changes due to stand dynamics, and external factors. Even if not significant in term of linear trends, is worth to note the visible effect of a strong moth attack (Lymantria dispar) in 2002-2003 combined with the 2003 and 2007 heat waves at LAZ1 site (Turkey oak). Beech forest in VEN1 recovered quickly from a severe hailstorm of 1988, leading to still visible effects in 1999. The spruce community in VAL1 has no directional trends, but the annual variability is progressively reducing. The absolute minimum at CAL1 is not apparently linked to known factors.
10 20 30 40 50 60 70 80 90 100 to ta l n o . o f spe ci e s p e r p lot pe r ye ar 01ABR1 02BAS1 03CAL1 04CAM1 05EMI1 06EMI2 07FRI1 08FRI2 09LAZ1 10LOM1 11MAR1 12PIE1 13PUG1 14SAR1 15SIC1 16TOS1 17TRE1 18UMB1 19VAL1 20VEN1 21ABR2 22LAZ2 23LOM2 24LOM3 25TOS2 26TOS3 27BOL1 28LIG1 29PIE2 30PIE3 31VEN2 Dynamics of terricolous plant species in the Italian forest systems (LII CONECOFOR network, 1999‐2012) 1999 2000 2001 2002 2003 2004 2005 2006 2007 2008 2009 2010 2011 2012
4.3.4. Forest nutrition
Forest nutrition has been examined in terms of soil and foliar nutritional status.
(i) Soil solid phase. Soil chemistry is measured at Level I and Level II plots. Main results are reported in Figure 4.11 for Level I. In particular:
carbon content is most frequent between 15-30 g kg-1 and C:N ratio between 10-15; base saturation (BS) is most frequently >75%;
cation exchange capacity (CEC) is most frequently between 10 and 20 mmolc+∙kg-1, and ca. 50% of the observed plots have a CEC > 20 mmolc+∙kg-1;
although ca. 50% of plots have a pH >5.5, there is a considerable amount of plots with pH <4.5.
Figure 4.11 – Soil condition on Level I plots in Italy (n: 239). From top left, clock-wise: frequency of plots in different class of carbon (C), C:N, Cation Exchange Capacity (CEC), Base Saturation (BS) and pH.
(Source: LIFE SMART4Action).
(ii) Soil solution. Soil solution is measured only at Level II sites. It provides important information about changes in the chemistry of soil water that may reflect changes in the atmospheric input and/or changes in ecosystem structure and processes. As such, careful interpretation is always necessary. Main results obtained after evaluating data collected over different time windows (3-15 yrs) and processed by means of Seasonal Mann-Kendall test (SMK) are summarized in Table 4.4.
Table 4.4 – Variable considered, layer examined, no. of plots, range of values among plots and occurrence of significant/non significant trends in soil solution data. (Source: LIFE SMART4Action).
Variable Layer No of plot Range
Significant increasing trend Significant decreasing trend Non significant trend pH forest floor 6 5.09-6.09 0 3 3 topsoil 8 4.24-6.59 2 0 6 subsoil 8 5.04-7.42 4 0 4 NO3-N forest floor 6 0.65-4.03 2 2 2 topsoil 8 0.09-8.85 1 1 6 subsoil 8 0.15-2.89 0 2 6 NH4-N forest floor 6 0.08-1.34 0 2 4 topsoil 3 0.03 1 - - subsoil 8 - - - - SO4-S forest floor 6 0.5-1.63 0 2 4 topsoil 8 0.31-2.3 0 5 3 subsoil 8 0.44-4.71 2 4 2
Base cations forest floor 6 6.01-15.09 1 3 2
topsoil 8 0.72-13.88 3 3 2
subsoil 8 0.85-16.44 2 3 3
(iii) Foliar nutrients. Bi-annual collection and chemical analysis of leaves and needles have been carried out at the Level II plots over the period 1995-2013. Major nutrients have been analyzed: N, S, P, Ca, Mg, K. Main results for the most important tree species are as follows (Figure 4.12A, B):
in terms of nutritional status, nutrient concentrations are for the most part of species and plots within the acceptable range. Possible exceptions are: high N values reported for some beech sites (Figure 4.12A), and low values reported for holm oak plots; possible low S values at Norway spruce sites; possible low K values at holm oak plots; generalized high values for Ca;
in terms of time trends, a generalized significant decreasing trend for N (beech, Norway spruce, Turkey oak), S (Norway spruce, Turkey oak). For other nutrients, the time trend is less generalized and more based on species-plot combination (Figure 4.12B).
Figure 4.12 – Foliar nutrients. A) mean N values at six beech plots; B) summary of time trends, all sites. Vertical axis shows the % of significant positive trends (above zero) and the % of negative trends (below zero). The % of non significant trend is not explicitly showed. Numbers above bars indicate the number of analyzed sites for
the given nutrient. (Source: LIFE SMART4Action).
4.4. Risk assessment
Risk is evaluated here in terms of possible effects of ozone and N deposition on the various impact indicators reported above.
4.4.1 Risk for forest health
No specific study has been undertaken to investigate the effect of N deposition on forest health in Italy. A European-scale study conducted on Level II sites (including Italy), however, revealed that N deposition and related N variables in soil and foliage improve tree defoliation models. The estimated effect is different according to the species being considered (Ferretti et al., 2015). As for ozone, a slight effect has been found for defoliation on beech (Ferretti et al., 2003; Ferretti et al., 2007; Bussotti and Ferretti, 2009). Results from a subset of Level I plots investigated in Trentino (N. Italy) over the period 2007-2011 show that ozone concentration has no significant effect on tree health of assorted species, with Norway spruce and larch being the most frequent ones (Gottardini et al., 2012).
As for direct effect on foliage, symptoms attributed to ozone were assessed at Level II sites and a subset of Level I plots in Trentino. Although several species were found symptomatic (Bussotti and Ferretti, 2007, 2009; Ferretti et al., 2003; Gottardini et al., 2012), statistical relationship with ozone exposure was always weak (Bussotti and Ferretti, 2009). Recent results obtained with single-species approach and Viburnum lantana as in situ biomonitor were promising, at least at local level (Gottardini et al., 2014; Gottardini et al., submitted).
4.4.2. Risk for forest growth
Distinct effect of N deposition has been detected on growth and C sequestration (Figure 4.13) (Ferretti et al., 2014). In relative terms, the maximal annual response of basal area increment (BAI) was estimated at 0.074–0.085% for every additional kgN. This corresponds to an annual maximal relative increase of 0.13–0.14% of carbon sequestered in the above-ground woody biomass for every additional kgN, i.e. a median value of 159 kgC per kgN ha-1 per year (range: 50–504 kgC per kgN, depending on the site). The importance of N related variables was further confirmed by a study on 15 Level I plots in Trentino, where N:Mg was the most important predictor of BAI.
No significant effect of ozone has been detected, neither on Level II plots (Ferretti et al., 2003; Ferretti et al., 2014), nor on a subset of Level I plots in Trentino (Gottardini et al., 2012).
All in all, variables related to stand, N deposition, nutrition, soil and climate are by far the most important and significant predictors of growth (Ferretti et al., 2003; 2014).
A B
Figure 4.13 – Annual BAIrel (A) and annual estimated C sequestered (B) in 2000–2009 plotted against annual N deposition over the same time window at Level II plots in Italy. Solid line: all species; dashed line: broadleaves only.
FS: Fagus sylvatica; PA: Picea abies; QD: deciduous oak (only Quercus cerris in this diagram); QI: Quercus ilex. (after Ferretti et al., 2014).
4.4.3. Risk for forest biodiversity
Possible air pollution effect on species diversity at Level II plots has been examined in two respects: the expected sensitivity of species composition in relation to ozone and according to the list of sensitive species by the ICP Forests (Ferretti et al., 2003) and the expected effects of stand, soil, meteorology and deposition data on species density (Ferretti et al., 2006).
As for the frequency of ozone sensitive species, an ozone vulnerability index (OVI) that takes into account trees, shrubs, and herbs was calculated. According to this index, beech forests in north and central Italy were potentially the most sensitive to ozone.
As for the set of factors affecting vascular species diversity, multivariate (Generalized Linear Models; Ordinary Least Square Regression) and univariate (Spearman rank order correlation) statistical methods were tested on the set of data collected over the period 1999-2003. All in all, results of the multivariate approach revealed that soil (C, N, C/N, C/P, K, P) and stand (tree species,
___ All species y = 0.0744x - 0.0554 R² = 0.59; P<0.001 --- Broadleaves y = 0.085x - 0.3085 R² = 0.76; P<0.001 -0.5 0.0 0.5 1.0 1.5 2.0 2.5 3.0 0 10 20 30 40 Me an a nu al BAI re l (%)
Mean annual N deposition (kg ha-1 yr-1)
FS PA QD QI ____ All species y = 0.1286x + 0.2298 R² = 0.64 P<0.001 --- Broadleaves y = 0.1388x + 0.0112 R² = 0.68 P<0.001 0 1 2 3 4 5 0 10 20 30 40 M e an a nn ua l Cs e qrel (%)
Mean annual N deposition (kg ha-1 yr-1)
FS PA QD QI
Figure 4.14 – Species density at beech Level II sites vs. exceedance of critical loads (CL) for N for the same sites. CL and exceedances were derived from measurements at the very site. Drawn after Ferretti et al., 2006.
Univariate analysis carried out for beech plots revealed that species diversity decreases as N deposition and exceedance of Critical Load for N increases (0.001<P<0.05) (Figure 4.14).
4.4.4. Risk for forest nutrition
Distinct effect of N deposition on soil pH and Basic Cation Exchangeable (BCE) was documented, especially for broadleaved forests (Ferretti et al., 2014) (Figure 4.15). Significant effect on foliar nutrient ratios was also reported (Ferretti et al., 2014) (Figure 4.16). With respect to ozone, no study has been undertaken so far to evaluate possible effects on soil biota and foliar nutrients.
Figure 4.15 – pH (a), C:N (b) and BCE (c) of the mineral topsoil plotted against actual N deposition. Soil data are those obtained after the 1995-1996 survey. Deposition data are mean annual values 2000-2009. Regressions represent
always the best fit for the given dataset. Continuous line: all species; dashed line: broadleaves only. FS: Fagus sylvatica; PA: Picea abies; QD: deciduous oaks; QI: Quercus ilex. After Ferretti et al., 2014.
a) b)
(a) (b)
(c) (d)
Figure 4.16 – Foliar N:P (a), N:Ca (b), N:Mg (c) and N:K (d) plotted against measured throughfall deposition. Foliar data are mean values after sampling carried out at years 2001, 2003, 2005, 2007, 2009. Deposition data
are mean annual values 2000-2009. Continuous line: all species; dashed line: broadleaves only. FS: Fagus sylvatica; PA: Picea abies; QD: deciduous oak; QI: Quercus ilex. After Ferretti et al., 2014.
4.5 Conclusions
When using measured data for both pressure and impact, evidence from the Italian forest monitoring networks (UNECE ICP Forests Level I and II) can be summarized as follows:
(i) trends in air pollution issues. There is a significant reduction of sulphate; for nitrate and ammonium the decrease is much slighter, although significant at some sites. After an increase between 1996-2005, mean summer ozone concentration is now decreasing. A decreasing 2000-2013 trend was also reported at the European scale (Sanders et al., 2016).
(ii) Measurable impact. Forest health improved over the 1997-2014 period, with a significant (P<0.01) decreasing trend for defoliation, mostly driven by broadleaves. Forests at Level II sites show positive trends in terms of average increment, and the standing volume is increasing. This latter point is not surprising, as sites are not actively managed and accumulate biomass. Forest biodiversity shows huge variability (Level I) but no clear trend (Level II) over the period
1999--- Broadleaves y = 0.8803x + 7.985 R² = 0.76; P<0.001 ___ All species y = 0.5187x + 11.179; R² = 0.28; P<0.01 0 10 20 30 40 50 0 10 20 30 40 F oliar N:P N deposition (kg ha-1 yr-1) FS PA QD QI --- Broadleaves y = 0.1132x + 1.6034 R² = 0.39; P<0.01 ____ All species y = 0.0609x + 2.2242 R² = 0.15; P<0.10 0 2 4 6 8 10 0 10 20 30 40 Fol ia r N: Ca N deposition (kg ha-1 yr-1) --- Broadleaves y = 0.3065x + 9.2155 R² = 0.13; P>0.1 ____ All species y = 0.1698x + 10.547 R² = 0.06; P>0.1 0 5 10 15 20 25 30 0 10 20 30 40 Foliar N:Mg N deposition (kg ha-1 yr-1) --- Broadleaves y = 0.1038x + 1.3926 R² = 0.65; P<0.001 ____ All species y = 0.0657x + 1.7729 R² = 0.36; P<0.01 0 1 2 3 4 5 0 10 20 30 40 F oliar N:K N deposition (kg ha-1 yr-1)
evidence of reduced basic cation leaching, which are important in relation to the impacts of acidifying deposition on soil chemistry. Foliar nutrients revealed a composite picture, with mostly decreasing trend for N and S, increasing for K, and much less obvious pattern for P, Ca, and Mg.
(iii) Evidence for risk. Although in terms of reported levels, ozone is potentially a serious risk for Italian forests, measurable effects are quite limited on both Level I and II. Therefore, evidence for actual risk is weak, and limited effect on health and growth were reported by the various study undertaken since early 2000s. On the other end, evidence for N deposition effect on forest nutrition and growth is outstanding. Current level of N deposition was proven to impact soil and foliar chemistry, tree growth and carbon sequestration. Effects on plant diversity were also reported, mainly for beech forests.
Effects of air pollution
on crops and semi-natural
vegetation
National Focal Point: Fausto Manes and Elisabetta Salvatori (UNIROMA1)
Chapter coordinator: Fausto Manes
Contributors: Elisabetta Salvatori1, Alessandra Campanella2, Maria Chiesa3, Lorenzo Cotrozzi2, Angelo Finco3,
Lina Fusaro1, Giacomo Gerosa3, Giacomo Lorenzini2, Riccardo Marzuoli3, Cristina Nali2, Romina Papini2,
Elisa Pellegrini2, Mariagrazia Tonelli2, Fausto Manes1