Nuclear Physics B277 (1986) 168-196 North-Holland, Amsterdam
A M E A S U R E M E N T O F T H E S P A C E - L I K E P I O N E L E C T R O M A G N E T I C F O R M F A C T O R
NA 7 Collaboration
S.R. AMENDOLIA 3, M. ARIK 7, B. BADELEK 3 , G. BATIGNANI 3 , G.A. BECK 5, F. BEDESCHI 3, E.H. BELLAMY 7, E. BERTOLUCCI 3 , D. BETTONI 3, H. BILOKON 5,
G. BOLOGNA 5, L. BOSISIO 3, C. BRADASCHIA 3, M. BUDINICH 6, A. CODINO 1, M. DELL'ORSO 3, B. D'ETTORRE PIAZZOLI 5, M. ENORINI 1, F.L. FABBRI 1,
F.FIDECARO 3, L. FOA 3, E. FOCARDI 3, S.G.F. FRANK 4, A. GIAZOTTO 3, M.A. GIORGI, 3, M.G. GREEN 8, J. HARVEY 4, G.P. HEATH 7, M.P.J. LANDON 8, P. LAURELLI 1, F. LIELLO 6, G. MANNOCCHI 5, P.V. MARCH 8, P.S. MARROCCHESI 3, A. MENZIONE 3, E. MERONI 2, L. MORONI 2 , E. MILOTTI 6, P. PICCHI 5, F. RAGUSA 6, L. RISTORI 3, L. ROLANDI 6, S. SALA 2, C.G. SALTMARSH 7, A. SAOUCHA 7, L. SATTA 1, A. SCRIBANO 3, P. SPILLANTINI 1, A. STEFANINI 6, D. STOREY 4, J.A. STRONG 8,
R. TENCHINI 8, G. TONELLI 3, G. TRIGGIANI 3, W. VON SCHLIPPE 7, E. VAN HERWIJNEN 7, and A. ZALLO 1.
Received 20 March 1986
The pion form factor has been measured in the space-like q2 region 0.014 to 0.26 (GeV/c) 2 by scattering 300 GeV pions from the electrons of a liquid hydrogen target. A detailed description is given of the apparatus, data analysis and corrections to the data. The mean square charge radius extracted from the data is model-dependent. We find that a form which includes a realistic description of the form factor phase gives a similar result to the naive pole form, and conclude (r 2 ) = 0.439 __ 0.008 fm 2. I. Introduction I n t h e i n t e r a c t i o n o f a c h a r g e d p i o n w i t h t h e e l e c t r o m a g n e t i c field, t h e f o r m f a c t o r F~ d e s c r i b e s t h e d e v i a t i o n f r o m a p i o n w i t h p o i n t - l i k e e l e c t r i c c h a r g e , a n d is a f u n c t i o n o f t h e s q u a r e o f t h e p h o t o n 4 - m o m e n t u m q. ( C o n v e n t i o n a l l y w e r e f e r to q2 f o r s p a c e - l i k e , a n d t = - q 2 f o r t i m e - l i k e p h o t o n m o m e n t a . ) T h e p i o n e l e c t r i c c h a r g e
1 INFN-Laboratori di Frascati, Frascati, Italy.
2 Dipartimento di Fisica and Sezione INFN, Milano, Italy.
3 Dipartimento di Fisica, Sezione INFN and Scuola Normale Superiore, Pisa, Italy. 4 Department of Physics, University of Southampton, England.
5 Istituto di Fisica Generale and Ist. di Cosmogeofisica del CNR, Torino, Italy.
6 Istituto di Fisica, Sezione INFN and Scuola Internazionale Superiore di Studi Avanzati, Trieste, Italy. 7 Department of Physics, Westfield College, London, England.
s Department of Physics, Westfield College, now at Royal Holloway and Bedford New College, Lon- don, England.
0550-3213/86/$03.50©Elsevier Science Publishers B.V. (North-Holland Physics Publishing Division)
S.R. A mendolia et al. / Pion electromagnetic form factor ~ ~00
i
,
l ii ' !,, I! !l I , I Ikl I ! b] [ d} I a) c] {SeV/c) z 169 e e rt e n q a) bl c] d)Fig. 1. Data on the squared modulus of F~ for Itl < l ( G e V / c ) 2 from the reactions: (a) electroproduc- tion [1]; (b) direct 7re scattering [2-4]; (c) inverse electroproduction [5]; and (d) e + e - annihilation [6-9].
The horizontal bar (b) indicates the range of our experiment.
determines the normalisation F.(0) = 1, and the mean square charge radius is given by:
( r 2 ) = 6 . d F J d t l t = o .
In the space-like and near time-like regions (t < 4m~) F~ is real for real t. For t > 4m~ it is complex with phase equal to that of the ~r~r P-wave scattering amplitude up to about t = 1 ( G e V / c ) 2.
The modulus of F,r is measured in a number of reactions and in fig. 1 we show some of the available data to illustrate the broad features and the experimental techniques used. A large range of time-like t has been investigated directly by e+e - colliding beam experiments. In the space-like region data up to 10 ( G e V / c ) 2 have been obtained indirectly, from a model-dependent analysis of pion electroproduc- tion measurements.
The dominant feature of the data is the O (770) resonance, with a small structure close to its peak due to w --+ ~r~r interference. A model for F~ derived from a two
170 S.R. Amendolia et al. / Pion electromagnetic form factor
parameter form for the P-wave phase shift was proposed by Gounaris and Sakurai in 1968 [10] but has long been regarded as inadequate. In particular the Gounaris- Sakurai form lies above the data in the space-like region, and below the data at time-like t > 1 ( G e V / c ) 2, where contributions from higher resonances and inelastic thresholds are expected. Values for ( r 2 ) and the 0 mass and width depend on how these contributions are modelled.
Two analyses reported in 1981 investigated the data allowing for correct analytic structure and with a minimum of model assumptions. Dubnicka et al. [11] found a description of both the modulus and phase in the elastic region (It] < 1 (GeV/c)2). Heyn and Lang [12] investigated modulus data in the range It] < 10 ( G e V / c ) 2. A feature of both analyses was that a simultaneous description of the phase, the time-like data and the space-like data required F. to extrapolate to zero at finite space-like q2. Heyn and Lang concluded that the electroproduction data may be systematically low.
A small region of space-like q2 is accessible to direct measurement by pion electron scattering. This was pioneered by a Soviet/American collaboration, scatter- ing pion beams of 50, 100 and 250 G e V / c from a liquid hydrogen target [2-4], and covering the range 0.01 < q2 < 0.1 ( G e V / c ) 2. The authors of [4] found their three measurements were not completely compatible, and the conclusion of Dubnicka et al. [13] was that only the 250 G e V / c measurement was reliable.
We have already reported results from a similar measurement, with better statistical precision, at 300 G e V / c and for the range 0.014 < q2 < 0.122 (GeV/c) 2 [14]. In the present paper we describe our experiment in detail and extend the analysis of our data up to q2 = 0.26 ( G e V / c ) 2.
2. Experimental apparatus
2.1. DESIGN CONSIDERATIONSThe differential cross section for pion-electron scattering, to first order in a, varies as:
do
1
= l F , 1 2 q . - _-7-- , (1)
dq 2 qmax
where qm~x2 (corresponding to backward scattering in the centre of mass) is roughly proportional to the pion beam momentum. At 300 GeV it reaches 0.288 ( G e V / c ) 2. However the rapid fall in cross section towards qm~x limits the range of our 2 measurement to q2 < 0.26 (GeV/c) 2.
In fig. 2 we show the kinematic relation between the electron and pion scatter angles for 300 GeV pions. Since q2 is related to the recoil electron kinetic energy T by q 2 = 2 m e T ' the electron momentum is given approximately (in GeV units) by
(3 n (mr)
2 -
S.R. A mendolia et al. / Pion electromagnetic form factor
l
eT[\
r\ \0.25~\\,
\\\\
~\ ",.,/ 0.15 ~,,. 0.10"-"/--
o.os2,
I I I I I I I I 2 4 6 8 171 0.01 I 10Oe (mr)
Fig. 2. The relation between the pion and electron scatter angles at 300 G e V / c incident plon momen- tum plotted in q2 steps of 0.01(GeV/c) 2. The curve "e~r" corresponds to exchange of the ~r and e labels.
/De = 1000q 2, i.e. 14 G e V / c at q2 = 0.014 and 260 G e V / c at 0.26. Close to q2 = 0.15 there is a kinematic ambiguity where both angles and momenta of the recoil and scattered particles are similar, and it is necessary to identify the scattered particles in order to determine q2.
The elastic scattering process cannot be separated from the radiative process 7re ~ ~re7 for arbitrarily soft photons. A calculable region of phase-space of the photon must be accepted and a correction (the radiative correction) applied to the measured cross section to estimate the contribution from (1). In previous experi- ments ~re events were selected by fitting the measured 3-momenta to the hypothesis ~re ~ ~rey (missing) and rejecting 7 energies above a convenient cut. With this technique an additional correction must be made to account for radiation of the recoil electron in the material of the apparatus. We have adopted a different approach, fitting only the measured scatter angles, which are insensitive to external bremsstrahlung.
The above kinematical considerations required that our apparatus should have good angular precision, good electron/hadron discrimination and a high acceptance over a wide range of momenta. The need for high statistics, and the large rate of pion hadronic interactions (a factor 103 higher than the useful ~re rate) dictated the choice of a negatively charged pion beam and a liquid hydrogen target in order to maximise the electron/nucleon ratio.
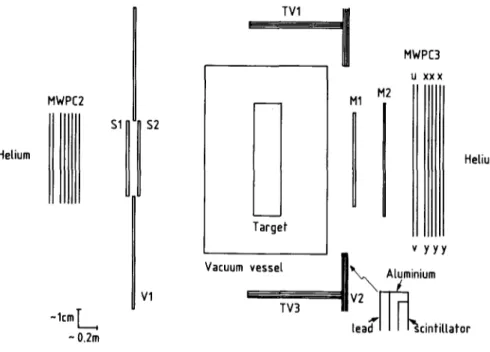
2.2. A P P A R A T U S (FIG. 3)
The forward spectrometer (FRAMM) of the SPS NA1 experiment satisfied the requirements of momentum acceptance and particle identification, being equipped
172 S.R. Arnendolia et aL / Pion electromagnetic form factor }% ShS BEAM VERTEX 41 Vl V2 V3 MWPE S1S2 TARGET MIM2 Vt,
II
LhLv V5 FS SPEETROMETERB
MAGNETSHelium
MWPC2
IIII I
-lcm[~
~ 0.2m
S.R. Amendolia et al. / Pion electromagnetic form factor 173
$2 V1 TV1
Targef
Vacuum
v e s s e l I TV3I
MWPC3
xxx Mv yyy
~
Atumioium'~:a~"~ci°,iua,or
Helium
Fig. 4. Apparatus surrounding the target.
Charged multiplicity was measured in two places: slightly downstream of the target (where the separation of scattered and recoil particles was small) a pair of scintillators M1 and M2 measured energy loss. The signals from both counters were discriminated at the two and three particle level. A crossed pair of scintillator hodoscopes (Lh, Lv) 12 m downstream of the target counted particles with signifi- cant spatial separation: individual counters (20 in each hodoscope) were 25 cm long and varied in width from 4 cm at wide angles to 5 mm in the beam region. An efficient rejection of hadronic events was provided by veto counters (TV1-4 surrounding the target and V2-5 downstream) which were shielded from soft photons and low-energy 8-rays by layers of lead and aluminium. The downstream veto counters were positioned to detect interactions in nearby apparatus and had circular apertures subtending at least 10 mr at the target.
Four detectors defined the incident beam. A crossed pair of hodoscopes (Sh, Sv) with 5 mm wide counters defined particle positions within the beam profile. A scintillator $1 was used to provide a precise (13 ns long) time reference. $2 was discriminated at the 2-particle threshold to signal two or more simultaneous beam particles. V1 covered the beam halo.
Particle tracks in the vertex region were detected by blocks of multiwire chambers (MWPC 1 to 5) with 1 mm wire spacing. Apart from MWPC4 (which was equipped with 4 chambers) each block consisted of 8 MWPC, measuring the horizontal (3 MWPC), vertical (3 MWPC) and diagonal (2 MWPC) coordinates. Within each
174 S.R. A mendolia et aL / Pion electromagnetic form factor
block the chambers were staggered relative to the beam axis to achieve an overall precision of about 0.17 mm, which was the dominant contribution to the angular precision. For efficient response to particles within the beam profile the central wires were read out through cable delays and latched by a fast pretrigger.
Helium pipes filled the spaces between MWPC blocks, reducing the material available for pion absorption and conversion of bremsstrahlung photons. Material between the target centre and the hodoscope L v amounted to 4% of a radiation length.
(iv) Spectrometer. The FRAMM forward spectrometer consisted of four bending magnets, with total bending power 7.2 Tin, interspersed with stacks of drift chambers and electromagnetic shower detectors. The four-stage design allowed momentum measurement with a precision better than 1% from 1 GeV/c to almost 300 GeV/c. The majority of particles above 1 GeV/c finally entered a shower detector although a fraction necessarily did so close to the edge of an aperture and were poorly identified.
Drift chamber stacks consisted of 3 pairs of planes, each pair measuring horizon- tal and vertical track coordinates with a precision of 0.2 mm. In each drift cell a delay line measured the orthogonal coordinate with a precision of 2 mm. An important feature was a "dead" region created in the beam profile by connecting opposite sides of the field cage with thin aluminium sheets. These provided a path to earth for ionisation from undeflected beam particles, so that the majority of the cell was not space-charge limited. The chambers were filled with an argon/ethane mixture.
The shower detectors were used loosely for trigger purposes, but played a crucial role in particle identification off-line. The Front Shower (FS), SD1 and SD5 were sandwiches of lead and 3.5 cm wide scintillators; SD2, SD3 and SD4 were lead glass arrays (fig. 5). We refer to the downstream part of these counters as "SD" (Shower
Shower
detector
Front(i D}
counters (FLfi)
Scinti[lator
~,
-,!
Radiation [engths
S.R. A mendolia et al. / Pion electromagnetic form factor 175
Detector) and the upstream part as " F L G " (Front Lead Glass). Individual SD counters were 3.5 cm square in cross-section, comparable to the dimensions of an electron shower and allowing interpolation of the lateral shower coordinates with a precision of 2 mm over the majority of the detector. The energy resolution of these counters was measured (in test conditions) to be
A E / E =
1 + 14/~/E-(GeV)%, although this was not achieved for the entire detector over our full data sample.(u) BSTOP Vetos.
A telescope of three scintillation counters downstream of the spectrometer (BS1, BS2, BS3) detected undeflected beam particles. This provided discrimination against triggers from soft processes, in particular 8-rays generated in the vertex region. Since the beam was focussed in a plane close to these counters, BS1 and BS2 were small and inaccessible in coincidence to particles satisfying ~re elastic kinematics. The counter BS3 covered an area around the beam profile, in order to detect ~re events in which local/J-rays or interaction products were seen by BS1 and BS2.2.3. EVENT TRIGGER AND DATA ACQUISITION
Signals from the counters described above were combined as follows (denoting logical A N D by " . " and OR by " + "): A particle counted in the incident flux was defined by
BEAM = $1 (single)- S h (only 1)- S v (only 1). ~ . V]-,
where the S1 requirement accepted particles which were unaccompanied within a _ 60 ns time window.
A pretrigger (PT) was generated for the fast MWPC readout from the counters S1 and $3 (left and right):
PT = S1 (single). ($3 L + S3R).
Whenever PT was satisfied the $1 signal (and hence BEAM) was inhibited. $1 was re-enabled on rejection of the event by a later trigger level or upon completion of data acquisition.
The second trigger level (VERTEX) was defined from counters in the vertex region and the BSTOP veto:
V E R T E X = B E A M - P T . M U L T 2 • A N Y (TV1-4, V 2 - 5 ) • BSTOP- L O W Q .
M U L T 2 requested a charged multiplicity of 2 from the counters M1, M2 and the two hodoscopes Lh, L v. The response of each M counter was labelled by multiplicity
176 S.R. A mendolia et al. / Pion electromagnetic form factor
1, 2 or 3. This was combined with the number of counters registered in the two hodoscope planes as follows:
M U L T 2 = M ( 2 . 2 + 2 . 3 ) . L h , v ( 1 . 2 + 1 . 3 + 2 , 2 + 2 , 3 ) + M ( 3 . 3 ) - C h , v ( 2 " 2).
Multiplicity 1 in one of the hodoscope planes was necessary in order to accept events close to the horizontal or vertical plane. Multiplicity 3 allowed for the L a n d a u tail in the M counters and for 3-rays in the hodoscopes. BSTOP was formed from the beam telescope BS1. BS2 with BS3 in anticoincidence. The LOWQ veto was formed from the outer counters of the hodoscope and rejected ~re events at low q2 which fell outside the geometric acceptance of the spectrometer.
The final event trigger was formed by adding a loose electron signature from the shower detectors. The analogue sum of individual F L G signals was formed for each detector and at least one of these was required to be significantly above the minimum ionising level (for SD2 the sum included counters lining the aperture, which had a significant acceptance for electrons). The FS (Front Shower) detector was used in anticoincidence part of the time. The spectrometer conditions defined:
SPECTR = ANY F L G ( 1 - 4 ) . and the final event trigger was then given by:
EVENT = V E R T E X . S P E C T R .
Within each accelerator burst of about 2 seconds, approximately 106 pions were incident on the target. 20% of these were either rejected by the BEAM definition, or occured within the dead-time of the pretrigger (1.5 /~s/PT) or data acquisition (8 m s / e v e n t ) . Typical rates for 106 BEAM counts were: 6 x 10⁴ PT, 200 V E R T E X and 70 E V E N T triggers.
2.4. DATA RUNS
Data was collected in September/October 1981 and amounted to about 2.5 x 10⁶ events. A fraction of these were taken with the SPECTR condition removed in order to calibrate its efficiency precisely. The M U L T 2 condition contained a large amount of redundancy, but was relaxed for about 5% of the data sample. Special data runs were taken with trigger elements removed (but registered) to calibrate $3, the BSTOP veto and the veto counters (TV, V2-V5). An important feature of the treatment of counter signals was the use of programmable logic units, which enabled us to vary the trigger conditions easily in order to collect calibration data and improve background rejection.
S.R. Amendolia et al. / Pion electromagnetic form factor 177
Some calibration data were required for off-line reconstruction. Data with the BEAM trigger condition alone was needed to align the MWPC, which moved by typically 200/tm during the data period. This data also provided useful information about the response of the VERTEX trigger counters to particles scattered at small angles. Data taken with a loose interaction trigger were used to calibrate the drift and delay-line constants. Shower detectors were calibrated by moving each SD counter onto an electron beam of appropriate momentum (25 GeV for SD2 rising to 150 GeV for SD4), while the lead/scintillator elements of SD1 were calibrated in a muon beam.
Data acquisition and on-line monitoring were performed by two linked DEC PDP 11/34 computers. Aside from the transfer of data to magnetic tape these also performed essential control functions, notably to programme and check the trigger logic and high voltage supplies for the drift chambers and shower detectors. Distributions of pulse heights in the trigger counters and shower elements, and efficiencies of the MWPC and drift chambers were regularly monitored on-line. Samples of events with two charged particles were selected on-line (using MWPC data) to monitor the response of trigger counters involved in the multiplicity definition.
3. Off-line analysis
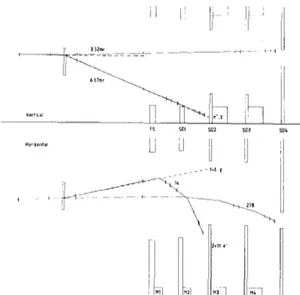
Of the 2.5 x 10 6 events recorded, about 15% were ere scatters and the remainder hadronic events with a small number of forward charged tracks. A preliminary selection was made after reconstruction of tracks in the MWPC, which also determined the vertex coordinates and scatter angles. The signature of a positively charged track in the spectrometer was used to reject a further fraction of events, reducing the hadronic background to an acceptable level. The q2 variable for the final sample was determined from the angles alone, up to the kinematic ambiguity which was resolved using the shower detectors. In this procedure the only rejection criterion involving the momenta was a cut against electrons of less than 1 GeV/c. At each stage of reconstruction there was sufficient redundancy to calibrate its efficiency. Below we describe details of the reconstruction and the procedure used to obtain the final q2 distribution. Fig. 6 summarises the reconstruction of a typical ~re event.
3.1. VERTEX ~ P C
The small angles involved ( < 10 mr) allowed a simple analysis of the wires hit in the MWPC. A precisely measured incident pion trajectory was required, and found for 98% of events. Vertices were found from combinations of the beam track and two downstream tracks intersecting between MWPC2 and MWPC3. The distance of an extrapolated track from the mean vertex position was typically 0.2 mm. We
178 S.R. Amendolia et al. / Pion electromagnetic form factor
il i
i
!i
[
667mr Wrti,~[
FS s~l so2 soJ so4 . . .
u u
U U
i] ~ . ~ . ~ "~'~
r
\
...
1
Fig. 6. A reconstructed ~re event. The measured polar angles correspond to an elastic scatter of q2 = 0.021 ( G e V / c ) 2. The momentum of the small angle track is close to that expected of an elastically scattered pion (279 GeV/c). The wide angle particle with 14 G e V / c reconstructed momentum released 2 GeV in the front part of SD2 and 11 GeV in the back, and was identified as an electron. A colinear
bremsstrahlung photon of 7 GeV was reconstructed below the SD2 aperture.
rejected events in which three or more downstream tracks were clearly resolved by the chambers and were consistent with a common vertex. The precision of the longitudinal vertex coordinate was better than _+ 10 cm at all q2 and allowed us to reject events beyond _+ 50 cm from the target centre with negligible loss (fig. 7). Our final description of the geometry of the event was made by joining the reconstructed vertex to the track coordinates measured at MWPC blocks 1 and 5. The projection of the scattered tracks was then required to pass through a fiducial area defined at the entrance to the spectrometer.
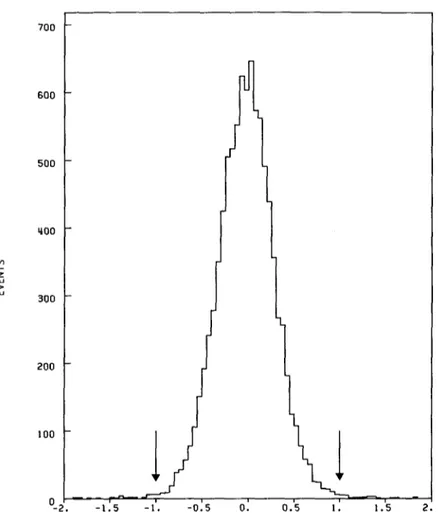
A fraction of the hadronic background was rejected by requiring coplanarity of the incident and scattered tracks (fig. 8). ~re events which failed this cut (0.2% of the peak contents) were normally associated with reconstructed photons, and were correctly accounted for by the radiative correction procedure.
Fig. 9a shows the scatter distribution of the measured polar angles of the right- and left-going particles (O R, 8L). Our estimate of q2 was made from the point on the theoretical kinematic curve nearest to these angle coordinates. Our measure of elasticity was the corresponding distance (DS), with positive sign above the curve and negative sign below (fig. 9b). The width of the elastic peak was determined mainly by the MWPC precision. A clear feature is the accumulation of events at negative D o (close to the axes in the 8 R versus 8 L plot) which was populated by inelastic (~re'f) events and is discussed in subsect. 4.10.
S.R. A mendolia et a L / Pion electromagnetic form factor 179 600 500 q o 0 i 300 200 I00 MI
oL
bl 25 - I 0 0 - 7 5 - 5 0 - 2 5 0 25 s ~ ' 0 Z IcmlFig. 7. The distribution of vertices along the beam coordinate with the target full (a) and empty (b). The positions of the target and its vacuum vessel and the counter M1 are indicated. The ends of the target
vessel contributed 1.1% to the electron density.
T h e efficiency of the M W P C reconstruction was investigated using data from the trigger counters. The coordinates of the registered fingers of the upstream hodo- scope a n d the b e a m focus parameters were used to estimate incident track coordi- nates at the target centre. The registered fingers of the downstream hodoscope were then c o m b i n e d to find independent measures of coplanarity, q2 and DO for each event. With suitable cuts this procedure selected about 70% of 7re events, with a 20% b a c k g r o u n d . Events for which the counters found a candidate ~re event but the M W P C did not were scanned in detail. M a n y of these were unambiguously reconstructed b y the M W P C as events generated outside the target. Two sources of inefficiency were identified: in 0.45% of events there was clear evidence of confusion caused by a second b e a m pion which either crossed the apparatus close to the ~re tracks or interacted hadronically producing a large n u m b e r of wire hits. A further 0.25% events were lost during the dead-time of the M W P C signal, when a scattered particle remained within the b e a m profile in projection. The fraction of events for which one of the particles was lost in this way was a very slow function of q 2. We estimate the total reconstruction loss from these processes to be 0.7 ( + 0.1)%, with negligible q2 dependence.
700 600 500 ~00 300 200 I00 - l i s -t. -0is
180 S.R. Amendolia et al. / Pion electromagnetic form factor
0-2. ol 0.'5 I' ~ .'s 2.
Fig. 8. The distribution of the triple scalar product of unit vectors along the incident and scattered tracks, in units of the applied cut. This varied smoothly with decreasing opening angle from 1.1 × 10 6
to 0.6 × 10 -6.
3.2. SPECTROMETER
For each drift chamber cell the recorded drift and delay-fine times were combined to find all possible space coordinates. Within each stack of six chambers straight track segments were found, then linked through successive magnetic fields as long as the trajectory remained consistent with a well-defined momentum. This was violated most often by the emission of a bremsstrahlung photon by the electron. The best estimate of momentum was found by an iterative fit to all measured coordinates including the vertex MWPC.
For events with q2> 0.03 (GeV/c) 2 the efficiency for reconstructing both par- ticle momenta was greater than 97%, the loss arising mainly from pion interactions in the spectrometer material. At lower q2 pions often crossed the beam profile, and
S.R. Amendofia et al. / Pion electromagnetic form factor 181 c~ o M A I I I I I S I N 3 A 3 k L~ 0
!
~.i ¸ : i~: I I I I' I .... I :: ' " i '"' I l o ( j ~ ) ~ ' I e "C I:= "c E . . = ~ ,.,.~ ,,I ~ Q ~ v ~ o b ~182 S.R. A mendolia et al. / Pion electromagnetic form factor
low-momentum electrons could be bent outside the first drift chamber stack. However the momentum measurement was not crucial in this region.
Two rejection criteria involved the measured momenta. A track reconstructed in the vertex region but bent in the direction of positive charge was taken as evidence of a hadronic interaction, reducing the estimated background by a factor between 5 and 10. The distribution in DO for rejected events was examined and the loss of ire events through poor reconstruction estimated to be 0.2 (_+0.05)%. A second cut rejected events in which both the momentum and reconstructed shower energy were consistent with an electron of less than 1 G e V / c . Above this momentum the acceptance of the shower detectors was nearly 100% for all particles entering the spectrometer. The cut had negligible effect on the height of the elastic peak in the measurable q2 range, but reduced the inelastic peak at negative DO by 30%.
3.3. SHOWER DETECTORS
A crucial function of the shower detectors was to identify the scattered particles, in order to resolve the kinematic ambiguity. This was important above q 2 = 0.06 ( G e V / c ) 2, and involved mainly the lead glass detectors SD2, 3, and 4. An electron entering a lead glass array deposited typically 14% of its energy in the front layer ( F L G ) and the remaining energy in the back (SD). Hadrons either penetrated the detector (with 30% probability) or interacted in the SD depositing typically 40% of their energy.
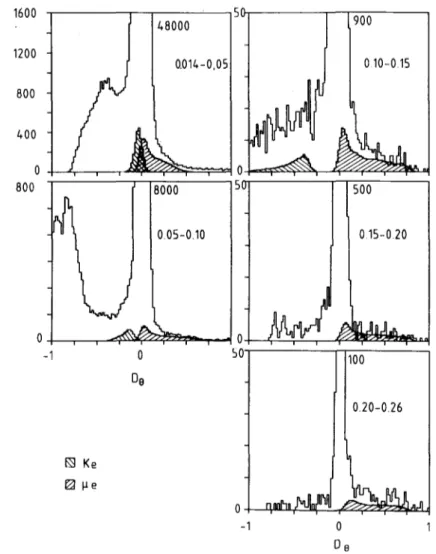
Each SD array was scanned to find peaks in the recorded energy. Interpolation of the signals within the nine counters centred on a peak provided a coordinate measurement, which was matched to track coordinates determined by the drift chambers. In fig. 10 we show scatter plots relating the energy deposited in the front counter (FLG), the total energy and the measured momentum. The electron distribution in these variables was localised and only a slow function of momentum. Hence identification of a track in the pion region was very reliable. However the pion distribution contaminated the electron signal at all momenta, and was signifi- cantly broader at low momentum (corresponding to high q 2). The cuts shown in fig. 10 were chosen so that at low q2 a maximum of 1 pion per thousand could be misidentified as an electron. For pions at high q2 this increased to 3%.
About 15% of particles hit the lead glass arrays close to the SD apertures, so that the longitudinal shower development was not reliably measured. In this case an electron identification was allowed if a photon shower was reconstructed down- stream of the SD and colinear with the track. Reliable pion identification required a well measured track which projected cleanly into both the F L G counter and the SD array, and either penetrated the detector or was unambiguously matched to a pion-like shower. For a fraction of events both particles could enter a single F L G counter in SD4, considerably reducing the possibility of identification. This effect was a maximum at q2 = 0.08 and 0.23 ( G e V / c ) 2.
S.R. A mendolia et al. / Pion electromagnetic form factor 183 o g 0.~ 0.3 0.2 0.1 a) b) i i i i o 2
i
184
E v e n t s / O 0 2 mr
~02 0 ~
1600 1200 800 400 0 80O
S.R. Amendolia et aL / Pion electromagnetic form factor
48000 / 0.014-0,05 i i i 8000 0.05-0.10 i i i , i i i i - ' 0 De F~ Ke ~ e 50
o!
SOl 0 l i l l l l l 900 0 10-0.15 J i i 500 0 15-0.20 100 0.20-0.26~nnhn, ~t~n~ ....
,"q
0 Oe 185Fig. 12. DO histograms for five bands of q2 of the sample in which the ambiguity was resolved. The ~re peak heights are given, and estimated contaminations are plotted for/~e events and Ke events.
k a o n b a c k g r o u n d a n d a flat h a d r o n i c b a c k g r o u n d . T h e b i n c e n t r e d o n the a m b i g u i t y at q 2 = 0.153 was d e a l t w i t h trivially.
4. Corrections and form factor results
I n this s e c t i o n we d e s c r i b e o u r r e m a i n i n g c o r r e c t i o n s a n d the final results for F~(q2). A l l c o r r e c t i o n s a r e s u m m a r i s e d in t a b l e 1 a n d figs. 14 a n d 15.
186 S.R. Amendolia et al. / Pion electromagnetic form factor M1 + M2 or (M2 + M1) Lh + Lv Of (Lv + Lh) 1.1 1-2 1.3 2+2 2+3 3+3 1.1 1+2 1+3 2.2 2.3 3*3 d ~ii!i!i!iiiili!i~ ~
Iiiiiiii!iiiiii
£t
b ~ normal frigger D calibration trigger D correctedFig. 13. Multiplicity combinations of M counters and hodoscope planes used in the trigger and calibration of trigger efficiency.
The incident beam contained small but significant fractions of kaons and muons which were accepted by the trigger logic. The kaon flux, measured using the C E D A R Cerenkov counter and corrected for decay before the target, was 0.84 ( + 0.03)%. The dominant source of muons was the decay of pions in the beamline. The kinematics of high energy pion decay were important: at 300 G e V / c the angle between the pion and emitted muon is small ( < 0.13 mr) and the muon momentum distribution is uniform, extending from 300 G e V / c down to 172 GeV/c. The final elements of the beamline were a dipole magnet 150 m upstream of the target, followed by a series of quadrupoles. The majority of muons generated in this region were expected to remain inside the accepted beam and those generated upstream to be bent outside it. Measurement of incident particle trajectories at the upstream magnet showed negligible off-momentum component, whereas momenta measured by the spectrometer showed a clear flat tail corresponding to 1.0% of the total beam. A more accurate estimate was made by simulating the production of pions in the primary target and tracing particle trajectories to the beam defining counters,
S.R. Amendolia et al. / Pion electromagnetic form factor
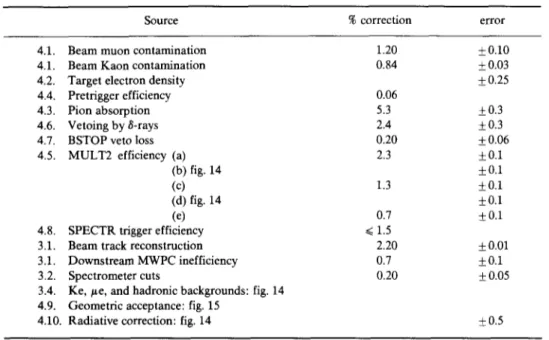
TABLE 1
Summary of corrections (in percent) applied to the data
187
Source % correction error
4.1. Beam muon contamination 1.20 ± 0.10
4.1. Beam Kaon contamination 0.84 ± 0.03
4.2. Target electron density ± 0.25
4.4. Pretrigger efficiency 0.06
4.3. Pion absorption 5.3 + 0.3
4.6. Vetoing by g-rays 2.4 + 0.3
4.7. BSTOP veto loss 0.20 ±0.06
4.5. M U L T 2 efficiency (a) 2.3 +0.1
(b) fig. 14 +0.1
(c) 1.3 ± 0.1
(d) fig. 14 _+0.1
(e) 0.7 ± 0.1
4.8. SPECTR trigger efficiency ~ 1.5
3.1. Beam track reconstruction 2.20 ±0.01
3.1. Downstream MWPC inefficiency 0.7 ± 0.1
3.2. Spectrometer cuts 0.20 ±0.05
3.4. Ke,/xe, and hadronic backgrounds: fig. 14 4.9. Geometric acceptance: fig. 15
4.10. Radiative correction: fig. 14 ± 0.5
The error column gives the estimated contribution to the systematic error in normalisation of the data. The first column refers to the text.
if
t
O~ ~ b] kaon-eLectron 2 m ~ ~ 10
2 C] muon-elettron 2
3 I d) MULT2 trigger M counter I 3
0 hodo$cop--e~
J
/~ ~ a) radiative 0 t . . . . , . . . . i , , . 01 O2 qZ [OeVlclZFig. 14. q2 dependent corrections. (a) - (c) Subtracted backgrounds of hadronic, Ke and /re events in the final q2 bins. In (b) the Ke contamination at high q2 is due to unidentified low q2 Ke events. The step in the estimated /ze background at q2 = 0.18 is due to a reduction of the cuts in DO. (d) Estimated trigger losses due to high pulses in the M counters and inefficiency in the downstream hodoscope.
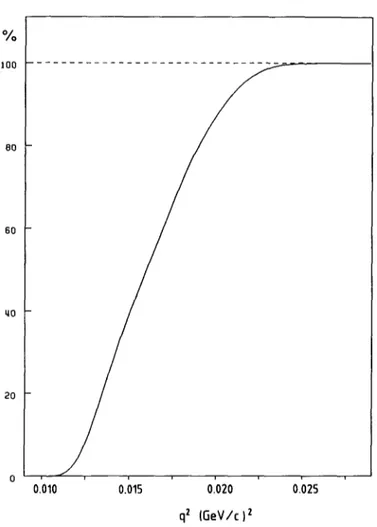
% I00 80 60 ttO 20
0.'010
0.015
0.020
0.()25
188 S.R. A mendolia et al. / Pion electromagnetic form factor
qZ (GeV/c)Z
Fig. 15. Geometric acceptance of the fiducial area defined at the entrance to the spectrometer. This was 100% for q2 > 0.03 (GeV/c) 2.
allowing for decay. This reproduced the flat distribution of 1.0% plus a component of 300 G e V / c muons (from upstream decays) of 0.2%.
4.2. TARGET ELECTRON DENSITY
T h e m e a n target length at room temperature was known to 0.18%, and its contraction on cooling to liquid hydrogen temperature to 0.1%. The mean hydrogen density, estimated from the temperature recorded during the running period, was k n o w n to 0.14%.
4.3. PION ABSORPTION
Pions which interacted strongly in the region between the b e a m counter $2 and the final M W P C (Block 5) had a negligible probability of surviving the multiplicity
S.R. A mendolia et al. / Pion electromagnetic form factor 189
and coplanarity selection. The fraction which interacted was estimated from the known material and the pion total cross section, which has negligible q2 depen- dence. It was independently estimated from a reconstruction of pion tracks collected with the BEAM trigger condition. The two estimates were consistent, giving a correction of 5.3 (+ 0.3)%.
4.4. PRETRIGGER EFFICIENCY
In data runs with the PT (pretrigger) requirement removed we found no evidence for failure of the counter $3. In normal running conditions each phototube sep- arately failed to register for 2.5% of reconstructed ~re events, independently of q2. The estimated pretrigger inefficiency is therefore very small (0.06%).
4.5. MULTIPLICITY CONDITION
The multiplicity trigger (MULT2) condition was formed from the discriminated pulses from counters M1, M2 and the number of fingers registered in each hodo- scope plane (Lh, Lv). The combinations accepted during normal data runs, and those added during calibration runs, are indicated in fig. 13. The pulse height distributions in M1 and M2 were independent of q2. In the hodoscopes the majority of events registered two counters, unless the plane of the event was nearly horizontal or vertical, leading normally to the combination (2.1), which was accepted by the trigger logic. This effect varied with the opening angle between the pion and electron and introduced a small q2 dependence into the trigger efficiency. Individ- ual corrections (indicated in fig. 13) are described below.
(a) Low pulse height in both M1 and M2.
This was calibrated from data with this condition relaxed and the loss estimated as 2.3 (_+ 0.1)%.(b) High pulse height in both M1, M2.
This was always accepted by the trigger in combination with the hodoscope 2 . 2 response. The loss was estimated assuming no correlation between the two devices, and is shown in fig. 14.(c) High hodoscope multiplicity (3.3 or 3.4).
This was attributed to /J-rays produced upstream of the hodoscope. The loss, estimated by relaxing the (3.3) condition, was 1.3 (+ 0.1)%.(d) Low hodoscope multiplicity.
The effect of gaps between hodoscope counters and inefficiency of individual fingers were studied for single reconstructed tracks, and the loss computed from a Monte Carlo simulation (fig. 14).(e) High multiplicity from secondary interactions.
The loss of ~re events for apparent multiplicity >/4, which could not be calibrated from the data, was esti- mated from a simulation which allowed for /J-rays and conversion of bremsstrah- lung. The correction was 0.7 (_+0.1)% with no significant q2 variation.4.6. VETO COUNTER 8-RAY LOSS (TV1-V5, LOWQ VETO)
Since the active area of the veto counters (TVn, Vn) was well clear of scattered pion and electron trajectories and shielded by layers of lead and aluminium, the
190 S.R. A mendolia et al. / Pion electromagnetic form factor
effect of 8-rays could be measured in a sample of undeflected beam particles. This was found to be 1.0 (:2 0.1)% and the corresponding rate from scattered electrons estimated to be 0.8 (+0.2)%. These rates were reproduced accurately by Monte Carlo simulation. The LOWQ veto rate (0.6 + 0.1%) was calibrated by removing it from the trigger.
4.7. BSTOP VETO
From ~e events reconstructed in calibration runs, it was found that secondary particles produced by pion interaction in the spectrometer satisfied the veto condi- tion in 0.2 ( + 0.06)% of events.
4.8. SPECTR T R I G G E R EFFICIENCY
The SPECTR condition was removed from the trigger for 20% of the data sample and its response registered. An inefficiency of 0.6% was found in the formation of the FLG electron signature. Electrons which escaped through the side of the spectrometer contributed a q2 dependent loss which varied between 0.5 and 1.0%. The overall correction was calibrated in each q2 bin and applied directly (with its associated error) to the ere signal.
4.9. GEOMETRIC ACCEPTANCE
A fiducial area was defined in the plane of the spectrometer aperture, clear of the edges of the FS detector. ~e events reconstructed in a q2 region with 100% acceptance (> 0.03 (GeV/c) 2) provided a representative sample of incident beam trajectories throughout the running period. Events were simulated using this sample, with uniform distribution along the target, to find the mean azimuthal acceptance. The smearing effects of multiple scattering and chamber precision were found to be negligible. The mean acceptance as a function of q2 is shown in fig. 15. The minimum q2 for which we report a form factor value is 0.014 (GeV/c) 2, where the acceptance fell to 40%. The form factor evaluated in the bin at 0.013 (with 15% acceptance) showed no evidence for failure of the acceptance procedure.
4.10. RADIATIVE CORRECTION
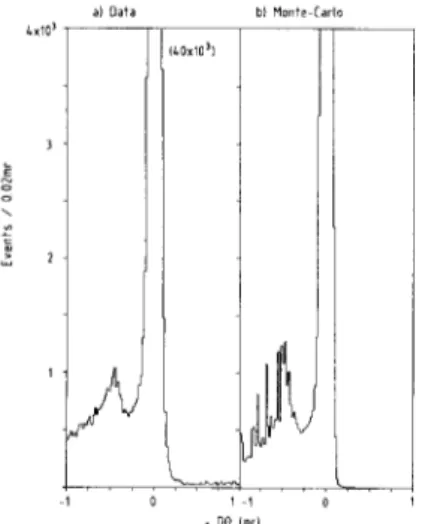
We accounted for the effect of higher order ~re scattering diagrams following the calculations of [17] and [18], considering terms up to a 3. The correction was computed from a Monte Carlo generation of events with recoil electron momenta above 1 G e V / c and included the effects of finite angular precision and the measured beam momentum distribution. Generated events were subjected to the cuts in coplanarity and angle variables used in the off-line selection. In fig. 16 we show distributions of D8 observed in the data and generated by the simulation. The accumulation at negative D8 was produced by soft ~ze scatters containing a photon
S.R. Amendolia et aL / Pion electromagnetic form factor a) D a t a b} M o n t e Carlo ~XI03
I
l~OxIO3l 3 \ 2 w o 1 1 • 3 o (rnr) 191Fig. 16. DO distributions in the data and from the Monte Carlo simulation used to evaluate the radiative correction. Fluctuations in the simulated inelastic peak are due to poor sampling frequency in this region.
The range of q2 for this plot is 0.02-0.10 ( G e V / c ) 2.
below the detection threshold of the apparatus. The sum of electron and pion m o m e n t a was therefore close to the b e a m m o m e n t u m , but the scatter angles were reduced significantly. The rate of these events is reproduced by the simulation: they fall outside the elastic cuts and are an indication that the inelastic part of the radiative correction is reliable.
F o r events within the elastic cuts a radiated photon of sufficiently high angle and energy could materialise in the lead of the veto counters (TV1-V5). We obtained a direct measure of the loss due to single counter vetos (1.5%) from calibration runs in which a m i n i m u m of two counters were required in coincidence. This was re- p r o d u c e d in an E G S [16] simulation which estimated a further loss of 0.5% from two vetos in coincidence• Our uncertainty in the response of the veto counters to low-energy photons affects the final radiative correction at the level of 0.5%, with negligible q2 dependence.
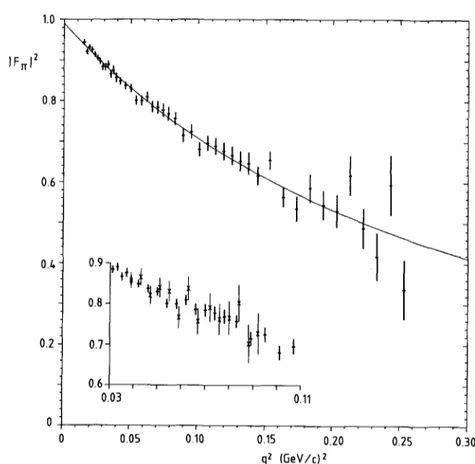
4.11. F O R M F A C T O R RESULTS
O u r results for IF.I 2 are given in table 2 and plotted in fig. 17. We stress the i m p o r t a n c e of the systematic uncertainty, which implies that the tabulated values of IF 12 m a y be adjusted simultaneously b y + 0.9%. If the data are fitted to a pole form IF[ 2 =
n/(1 + q2.
~ ( r 2 ) ) 2 with n constrained to 1.000 _+ 0.009, we find( r 2) = 0.431 + 0.010 fm 2 , with a X 2 probability o f 51%.
1 9 2 S.R. A mendolia et al. / Pion electromagnetic" form factor T A R L t 2 T h e m e a s u r e d f o r m f a c t o r s q u a r e d w i t h s t a t i s t i c a l e r r o r s o n l y ( a n o v e r a l l n o r m a l i s a t i o n e r r o r o f _+0.9% is d e f i n e d i n t h e t e x t ) t ( G e V / c ) 2 I F I 2 E r r o r t(GeV/c) 2 I Fq 2 E r r o r - 0 . 0 1 5 0 0 . 9 4 4 0 . 0 0 7 - 0 . 0 8 3 0 0 . 7 5 7 0 . 0 1 5 - 0 . 0 1 7 0 0.921 0 . 0 0 6 - 0 . 0 8 9 0 0 . 7 1 5 0 . 0 1 6 - 0 . 0 1 9 0 0.933 0 . 0 0 6 - 0 . 0 9 5 0 0 . 7 2 4 0 . 0 1 8 - 0 . 0 2 1 0 0.926 0 . 0 0 6 - 0 . 1 0 1 0 0 . 6 8 0 0 . 0 1 7 - 0 . 0 2 3 0 0 . 9 1 4 0 . 0 0 7 - 0 . 1 0 7 0 0 . 6 9 6 0 . 0 1 9 - 0 . 0 2 5 0 0 . 9 0 5 0 . 0 0 7 - 0 . 1 1 3 0 0 . 6 8 8 0 . 0 2 0 - 0 . 0 2 7 0 0 . 8 9 8 0 . 0 0 8 - 0 . 1 1 9 0 0 . 6 7 6 0.021 - 0 . 0 2 9 0 0 . 8 8 4 0 . 0 0 8 - 0 . 1 2 5 0 0.665 0 . 0 2 3 - 0 . 0 3 1 0 0 . 8 8 4 0 . 0 0 9 - 0 . 1 3 1 0 0.651 0 . 0 2 4 - 0 . 0 3 3 0 0 . 8 9 0 0 . 0 0 9 - 0 . 1 3 7 0 0 . 6 4 6 0 . 0 2 7 - 0 . 0 3 5 0 0 . 8 6 6 0 . 0 1 0 - 0 . 1 4 4 0 0 . 6 1 6 0 . 0 2 3 0 . 6 8 8
S.R. A mendolia et al. / Pion electromagnetic form factor 193 1 . 0 . . . . I . . . . , . . . . I . . . . I . . . . I . . . . IFrrl z 0.8
t
t
0.6 0.~ 0.9t',~.~
o.,
l,I,I,I
I
o., o.,
If',,
0.6 . . . .
0.03 0.11
0
. . . . f . . . . i . . . . [ . . . . i . . . . i . . . .0 0.05 010 0.15 0.20 0,25 0.30
qZ (GeV/t) z
Fig. 17. The square of the pion form factor, IF~I 2 versus q2, with statistical error bars only. The line shows the constrained pole fit with normalisation n = 0.991 and (r 2 ) = 0.431 fm 2. Inset: comparison (on an expanded q2 scale) with the 250 GeV/c data X of Dally et al. [4] (both data sets are subject to
systematic errors of about 1%).
marised in table 3. We have compared our data directly with the form factor solutions of H e y n and Lang, which were obtained from an analysis with very little model input. Solutions A and B, which have high values for the radius and the 7rTr P-wave scattering length, are in p o o r agreement and have X 2 probabilities of 2.5% a n d 12% respectively. For solution C (in which the scattering length was constrained to the generally accepted value) we find a probability of 48%.
W e recall that our data, which lie at small space-like t, are perfectly fitted by a real pole f o r m with ( r 2) -- 0.431 _+ 0.010 fm 2. However, this implies the exchange of a single stable particle of mass M =
(6/(r2~) 1/2
= 736 + 9 MeV, which is 4% below the accepted p mass of about 770 MeV. Clearly the pole model is an inadequate description of the form factor at the level of precision of the data. For completeness we m e n t i o n the dipole form, which has been successful in describing nucleon form factors, a n d gives ( r 2) = 0.406 + 0.010 fm 2 with a X 2 probability of 39%. However, neither of the above forms allows for the phase of F., which is given through elastic unitarity in the p region b y the ~r~r P-wave phase shift.194 S.R. A mendolia et al. / Pion electromagnetic form factor TABLE 3
Results of several authors from fits to previous form factor data Authors
Quenzer et al. [8] Heyn and Lang [12]
Model t range (r~)(fm 2 )
p, ~ro: 0.23 < t < 1.2 0.46 +_ .011 p + smooth - 10 < t < + 10 0.49
polynomial 0.48
0.45 Dubnicka et al. [11] [13] Pad~ fit
t o l F I , 8 Dally et al. [4] Pole form Geshkenbein and O, P' +
Terentyev [19] QCD asymptotic Erkal and Olsson [ 2 0 ] Triple subtraction Barkov et al. [9] Gounaris-Sakurai
p, ¢(1250,1600) - 0 . 8 4 < t < 1.0 0.434 ± .033 - 0.1 < t < - 0.04 0.439 _+ 0.03 0.41 < t < 1.95 0.475 _+ 0.025 m o (MeV) 773.1 ± 3.3 770 ± 2 769 - 4 < t < + 2 0.430 ± 0.005 780 ± 6 0.1 < t < 10 0.422 775.9 ± 0.003(stat) + 0.8(stat) _+0.013(model) ±0.8(model)
Column 2 gives some indication of the model used, and column 3 gives the range of t of the fitted data in ( G e V / c ) 2. As well as ( r 2) the quoted # mass is given, where appropriate.
neither of the above forms allows for the phase of F~, which is given through elastic unitarity in the p region by the ~rqr P-wave phase shift.
Dubnicka and Martinovic [21] parametrised the results of three ~r~r partial wave analyses and obtained an explicit form for the form factor phase representation:
(,):: ,/./
F. = e(t)exp ~
t'(t'
- t ) d t ' ,w h e r e P ( t ) is a n u n k n o w n p o l y n o m i a l n o r m a l i s e d to 1 a t t = 0. A P a d 6 - t y p e p a r a m e t r i s a t i o n o f t h e p h a s e f a c t o r w a s o b t a i n e d , i n t e r m s o f t h e p i o n c e n t r e o f m a s s m o m e n t u m k:
( k - aa)(i- a2)(i- a3)(i- c%)(i- as)
F = = P ( t ) . (i- a,)(k -
a2)(k - a3)(k - o/4)(k
- - 0 ~ 5 ) 'T w o o f t h e p a r a m e t e r s a d e s c r i b e c o n j u g a t e p p o l e p o s i t i o n s a n d t h e r e m a i n i n g t h r e e ( a z e r o a n d t w o p o l e s ) a p p r o x i m a t e t h e b e h a v i o u r o f t h e ~r~r l e f t - h a n d c u t . T h e p h a s e h a s c o r r e c t P - w a v e t h r e s h o l d b e h a v i o u r , t a n tJ = a - k 3, w i t h s c a t t e r i n g l e n g t h a a n d p p a r a m e t e r s c l o s e t o t h e i r g e n e r a l l y a c c e p t e d v a l u e s [22, 23]. W e f i n d t h a t
S.R. A mendolia et al. / Pion electromagnetic form factor 195 with P ( t ) = 1 + A • t our data are well fitted, with a X 2 probability of 55%, giving
( r 2) = 0.439 _+ 0.008 fm 2 or ( r 2 ) 1/2 = 0.663 +_ 0.006 fm. This result is rather close to the value obtained
196 S.R. A mendolia et al. / Pion electromagnetic form factor M . G i v o l e t t i , D. P a s s u e l l o a n d P. S a l v a d o r i d e s i g n e d a n d t u n e d m o s t o f t h e e l e c t r o n i c s , c o n t r i b u t i n g to t h e d e v e l o p m e n t o f fast E C L devices w i t h n e w i d e a s a n d g r e a t c o m p e t e n c e . G . C o r r a d i , L. P a s s a m o n t i a n d V. R u s s o c o n s t r u c t e d a n d m a i n t a i n e d t h e e f f i c i e n t r u n n i n g of t h e M W P C r e a d o u t . M r s . G i u l i a n a S c h w a a r ' s h e l p w a s i n v a l u a b l e i n a s m o o t h d a y to d a y o r g a n i z a t i o n o f t h e c o l l a b o r a t i o n work. T h i s w o r k w a s s u p p o r t e d f i n a n c i a l l y , a n d t h r o u g h t e c h n i c a l a n d c o m p u t i n g facilities, b y C E R N , t h e S E R C ( U K ) a n d t h e I N F N (Italy). References
[1] C.J. Bebek et al., Phys. Rev. D17 (1978) 1693
[2] G.T. Adylov et al., Phys. Lett. 51B (1974) 402; Nucl. Phys. B128 (1977) 461 [3] E.B. Dally et al., Phys. Rev. Lett. 39 (1977) 1176; Phys. Rev. D24 (1981) 1718 [4] E.B. Dally et al., Phys. Rev. Lett. 48 (1982) 375
[5] S.F. Bereshnev et al., Sov. J. Nucl. Phys. 18 (1974) 53, 24 (1976) 591 [6] S.R. Amendolia et al., Phys. Lett. 138B (1984) 454
[7] I.B. Vasserman et al., Yad. Fiz. 33 (1981) 709 (Sov. J. Nucl. Phys. 33 (1981) 368) [8] A. Quenzer et al., Phys. Lett. 76B (1978) 512
[9] L.M. Barkov et al., Nucl. Phys. 256B (1985) 365
[10] G.J. Gounaris and J.J. Sakurai, Phys. Rev. Lett. 21 (1968) 244 [11] S. Dubnicka, V.A. Meshcheryakov and J. Milko, J. Phys. 7 (1981) 605 [12] M.F. Heyn and C.B. Lang, Z. Phys. C7 (1981) 169
[13] S. Dubnicka, A.Z. Dubnickova and S. Dubnicka, Z. Phys. C15 (1982) 149 [14] S.R. Amendolia et al., Phys. Lett. 146B (1984) 116
[15] S.R. Amendolia et al., Nucl. Instrum. Methods 176 (1980) 461
[16] R.L. Ford and W.R. Nelson, SLAC-PUB-210 (1978); Electron gamma shower simulation package [17] J. Kahane, Phys. Rev. 135B (1964) 975
[18] D. Yu Bardin, G.V. Micelmacher and N.M. Shumeiko, Dubna JINR, E2-6235 (1972) [19] B.V. Geshkenbein and M.V. Terentyev, Moscow preprint ITEP-3 (1984)
[20] C. Erkal and M.G. Olsson, University of Wisconsin-Madison preprint MAD/PH/188 [21] S. Dubnicka and L. Martinovic, Czech. J. Phys. B29 (1979) 1384
[22] Particle Data Group, in Rev. Mod. Phys. 56 (1984) [23] O. Dumbrajs et al., Nucl. Phys. B216 (1983) 277
[24] C.B. Lang and A. Mass-Pareda, Phys. Rev. D19 (1979) 956 [25] F. Felicetti and Y. Srivastava, Phys. Lett. 83B (1979) 109 [26] C.A. Dominguez, Phys. Rev. D25 (1982) 3084
[27] J. Govaerts, J.E. Mandula and J. Weyers, Phys. Lett. 130B (1983) 427 [28] B.L. Ioffe and A.V. Smilga, Nucl. Phys. B216 (1983) 373
[29] L. Cosmai, M. Pellicoro and G. Preparata, Phys. Lett. 121B (1983) 272 [30] K.G. Chetyrkin et al., Moscow preprint IYAF P-0337 (1984)
[31] S. Dubnicka, G. Georgios and V.A. Mescheryakov, JINR preprint E2-85-406 [32] J. Gasser and H. Leutwyler, Nucl. Phys. B250 (1985) 517
![Fig. 1. Data on the squared modulus of F~ for Itl < l ( G e V / c ) 2 from the reactions: (a) electroproduc- tion [1]; (b) direct 7re scattering [2-4]; (c) inverse electroproduction [5]; and (d) e + e - annihilation [6](https://thumb-eu.123doks.com/thumbv2/123dokorg/4934289.51825/2.670.181.511.76.508/squared-modulus-reactions-electroproduc-scattering-inverse-electroproduction-annihilation.webp)