Politecnico di Milano
Facolt`a di Ingegneria
Scuola di Ingegneria Industriale e dell’ Informazione
Dipartimento di Elettronica, Informazione e Bioingegneria
Master of Science in Telecommunications Engineering
A Cybersecurity-by-Design Methodology
and Tool for Vehicular Networks
Supervisor:
PROF. STEFANO ZANERO Assistant Supervisor:
STEFANO LONGARI
Master Graduation Thesis by: ANDREA CANNIZZO Student Id n. 872281
Contents
Abstract 9
Sommario 10
1 Introduction 14
2 Motivation and Background 18
2.1 Problem Statement . . . 18
2.2 State of the art . . . 19
2.2.1 Risk Analysis . . . 19
2.2.2 Architectures Evaluation . . . 20
2.3 Goals and Challenges . . . 22
3 Approach 23 3.1 Overview . . . 23
3.2 Details . . . 24
3.2.1 Attack Trees . . . 24
3.2.2 Risk Function . . . 32
3.2.3 A Priori Risk Analysis . . . 40
3.2.4 Topology Based Risk Analysis . . . 42
3.2.5 Countermeasures Generation . . . 49
4 Implementation Details 54 4.1 Tool overview . . . 54
4.2.1 Input Files and Scripts . . . 55 4.2.2 Algorithms . . . 60 4.2.3 Outputs . . . 63 5 Experimental Validation 69 5.1 Goals . . . 69 5.2 Dataset . . . 70
5.3 Test Execution and Results . . . 70
5.3.1 A Priori Risk Analysis . . . 70
5.3.2 Topology Based Risk Analysis . . . 80
5.3.3 Countermeasures Proposal . . . 81
List of Figures
1.1 Active Lane Assist and Adaptive Cruise Control . . . 15
2.1 Security requirements determination process . . . 20
2.2 Digital I/O channels appearing on a modern car . . . 21
3.1 Approach Work Path . . . 25
3.2 General Attack Tree Hierarchy . . . 26
3.3 Steering Attack Tree Example . . . 27
3.4 Feasibility computation example. In red, the action feasibility defined as described above, and in yellow the derived values for steps, methods and objectives. . . 38
3.5 Algorithm sequence process (“a priori”) . . . 41
3.6 Topology example: three buses coloured in blue and multiple components connected to them (red for attack surfaces and green for other ECUs) . . . 43
3.7 A visual representation of the whole risk analysis process. . . . 47
3.8 Algorithm sequence process (“topology based”) . . . 48
3.9 Gateway Insertion Example: a gateway has been added (coloured pink) between the “Apps and Internet” component and the rest of the network. . . 50
3.10 Countermeasure Generation Process . . . 51
4.1 Logical representation of “trees.xml” . . . 62
4.3 Logical representation of the merging result between “trees.xml”
and “steps.xml” . . . 62
4.4 Flow chart about countermeasures generation algorithm . . . . 64
4.5 Console Screenshot Example . . . 65
4.6 Topology Solution Output Example . . . 66
5.1 Range Rover Topology representation . . . 74
5.2 Jeep Topology representation . . . 74
5.3 Audi Topology representation . . . 75
5.4 RangeRover Optimal Solution with Max-Distance Constraints 87 5.5 Audi Optimal Solution with Max-Distance Constraints . . . . 88
5.6 Jeep Optimal Solution with Max-Distance Constraints . . . . 88
5.7 Audi Solution with Max-Distance and Most-Ring Constraints 89 5.8 RangeRover Optimal Solution without Constraints . . . 89
5.9 Audi Optimal Solution without Constraints . . . 90
5.10 Jeep Optimal Solution without Constraints . . . 90
5.11 Audi intermediate solution after first step . . . 91
5.12 Audi intermediate solution after second step . . . 93
List of Tables
3.1 Attack severity classification scheme (from [1]) . . . 33
3.2 Rating of attack requirements aspects (derived from [1]) . . . 35
3.3 Attack Requirements to Action Feasibility Table (derived from [1]) . . . 36
3.4 Feasibilities derivation rules . . . 37
3.5 No safety related severity risk table . . . 38
3.6 Safety related severity risk table . . . 39 5.1 Miller and Valasek results regarding the security of three
ve-hicles: “–” means least hackable, “++” means most hackable) 81 5.2 Risk Evaluation Results regarding the security of three vehicles 81
Listings
4.1 Excerpt from components.xml relative to the actions
parame-ters of three specific components: PSS, BUS and ALA. . . 56
4.2 Excerpt from steps.xml relative to all possible actions to ob-tain the step with ID equal to 16 . . . 57
4.3 Excerpt from trees.xml relative to possible methods to obtain the “Steer” attack . . . 58
4.4 Excerpt from a topology.xml example file made of three buses: CAN A, CAN B, and CAN c. . . 59
4.5 Output Tree excerpt relative to the attak “ACC DoS” . . . . 67
4.6 Output Components excerpt relative to five specific units . . . 68
5.1 Range Rover topology file (XML) . . . 71
5.2 Jeep topology file (XML) . . . 72
5.3 Audi topology file (XML) . . . 73
5.4 A priori Safety Risks Ranking excerpt (first 8 attacks) . . . . 76
5.5 A priori Privacy Risks Ranking excerpt (first 10 attacks) . . . 77
5.6 A priori Operational Risks Ranking excerpt (first 11 attacks) . 78 5.7 A priori Financial Risks Ranking excerpt (first 11 attacks) . . 79
5.8 Attacks Ranking regarding three vehicles (first 5 attacks) . . . 82
5.9 Buses Actions Importance in RangeRover . . . 82
5.10 Paths Values in Audi . . . 83
5.11 Countermeasures algorithm proceeding . . . 85
5.12 Attacks Risks Variation after first step . . . 92
Abstract
The rapid innovation in vehicle related technologies recently led the automo-tive industry to start focusing on the security of cars and internal networks, admitting the dangerousness of cyberattack even in a field not usually con-sidered related to computer science up until some years ago. Since it is a new field in continuous evolution, much research still needs to be done in order to produce tools for the development of secure infrastructures and networks towards the security by design paradigm. In this thesis work we propose a methodology and its implementation through a tool to help analysts while designing and assessing the security of vehicle on-board networks. The tool first performs a risk based analysis on a specific network topology and pro-pose a set of values to the analyst that help understanding the strong and weak points of the given architecture, then it evaluates the global security level of the topology assigning a grade related to the risk and finally, through those values, proposes multiple countermeasures to improve the architecture in the prevention against the most dangerous attacks.
Sommario
L’autoveicolo negli ultimi anni ha certamente subito una forte spinta inno-vativa. Questo `e il frutto di grandi investimenti che l’intera industria auto-motive pi`u di altre ha voluto fare, per migliorare la sicurezza, la comodit`a e l’usabilit`a dei veicoli a quattro ruote. I primi sistemi di cruise control si sono evoluti in tecnologie intelligenti in grado di moderare automaticamente la velocit`a a seconda della prossimit`a dell’automobile davanti e di frenare autonomamente in caso di emergenza (Adaptive Cruise Control); i sensori che avvisavano il guidatore dell’attraversamento delle righe di corsia si sono integrati in moderni sistemi che automaticamente apportano correzioni allo sterzo per mantenere l’autoveicolo in corsia (Active Lane Assist). Paralle-lamente a queste evoluzioni sono entrate nel abitacolo tecnologie di teleco-municazioni wireless dapprima destinate solo all’ elettronica di consumo. Se prima infatti si poteva al massimo trovare esclusivamente una connessione Bluetooth con il sistema di infotainment della macchina e il ricevitore del segnale GPS, oggi in diverse automobile troviamo la rete WiFi o persino la connessione GSM. `E chiaro come l’orizzonte di tutto ci`o sia da una parte la guida autonoma (ormai pronta a sbarcare sulle strade) e dall’altra l’IoT (Internet of Things): i veicoli si scambieranno autonomamente tra di loro informazioni sul traffico e sulla potenzialit`a di scontro con altri veicoli , co-municheranno con altri apparati lungo le strade come i sistemi di pedaggio, e↵ettueranno automaticamente chiamate di emergenza in caso di incidente inviando tutte le informazioni necessarie quali coordinate GPS e altre imple-mentazioni che solo in parte oggi possiamo immaginare. Per questo motivo,
in molti casi dobbiamo considerare le nuove automobili non semplicemente come “macchine intelligenti” ma pi`u come “computer su ruote”.
Tuttavia, l’introduzione di nuove tecnologie come sempre comporta nuovi rischi alle macchine e agli uomini e nel nostro specifico caso si tratta di quelli che oggigiorno vengono chiamati “rischi cyber”. Inoltre nello scenario che noi trattiamo, relativo alle automobili quindi, questi rischi vanno considerati ancora pi`u pericolosi a causa della natura dei sistemi che possono colpire: es-sendo infatti le macchine sia dei computer (schermi, dati, telecomunicazioni) che dei sistemi fisici (motore, sterzo, freni) ed essendo questi due aspetti non isolati ma interfacciati tra di loro, possono essere classificate come sistemi cyberfisici e per questa ragione richiedono una attenzione maggiore per le implicazioni di sicurezza che potrebbero generarsi in caso di manomissione intenzionale che andrebbero a mettere in pericolo le persone all’interno e nei pressi del veicolo.
Nel passato la sicurezza informatica, nella maggior parte dei casi, non era una preoccupazione nella fase di progettazione delle architetture di rete per le automobili. Difatti i primi studi di cyber security atti a fornire una valutazione globale di queste reti hanno meno di 10 anni, finch´e i primi standard definiti da organismi internazionali quali SAE hanno alimentato l’interesse dei produttori a prendere in considerazione la sicurezza informatica fin dalle primissime fasi di progettazione degli autoveicoli.
Nel corso degli anni diversi ricercatori hanno dimostrato la possibilit`a di portare a termine attacchi informatici alle automobili con eventuali impli-cazioni in termini di sicurezza. Quasi la totalit`a degli attacchi si struttura in due fasi: inizialmente ottenere l’accesso all’architettura di rete interna per poter inviare messaggi sul bus di sistema e poi forgiare messaggi su misura che inneschino risposte specifiche da parte dei componenti in ascolto. Dapprima gli studi hanno mostrato quali e quante cose si potessero fare ottenendo l’accesso al bus tramite l’interfaccia di comunicazione per la di-agnostica (OBD - II): frenare improvvisamente, disabilitare i freni, sterzare, accelerare, mostrare messaggi sul display e molto altro. Poi i ricercatori
hanno voluto investigare la possibilit`a di perpetrare questi attacchi anche at-traverso diverse superfici di attacco alcune delle quali accessibili persino da remoto (lettore CD, Bluetooth, rete WiFi, connessione GSM) ottenendo esiti positivi. Si pu`o immaginare quindi la pericolosit`a di questi attacchi relativa-mente ai danni che potrebbero comportare oltre al basso livello di sicurezza riscontrato che spinge ancora oggi a nuovi studi della materia.
Risulta chiaro a questo punto quanto ci sia necessit`a di apportare contro-misure in fase di progettazione che in qualche modo prevengano tali attacchi. Ogni esperto di sicurezza tuttavia ha bene in mente il fatto che la sicurezza totale di un sistema non `e mai ottenibile e che quindi le contromisure da adottare vanno valutate secondo il solito trade o↵ tra costi e benefici dove la variabile benefici `e rappresentata dalla diminuzione globale del rischio. Ci`o che `e necessario `e quindi attribuire una priorit`a alle contromisure da adottare che tengano conto degli assets pi`u sensibili da proteggere. Per rispondere a questa esigenza viene di solito svolta quella che nel settore `e chiamata analisi del rischio (un processo di identificazione dei possibili attacchi con annessa una valutazione della pericolosit`a) e vi sono alcuni studi e documenti gi`a pub-blicati che espongono come applicarla nel contesto del autoveicolo. Tuttavia ci`o che manca allo stato dell’arte `e una metodologia di analisi del rischio che tenga conto anche delle diverse architetture di rete delle automobili, una analisi del rischio applicata alla specifica topologia della macchina presa in considerazione. Per esempio una analisi del rischio che tenga conto del fatto che la macchina presenti o meno determinate interfacce di comunicazione o determinati sistemi di “guida autonoma” quali la frenata d’emergenza o il cruise control. Questo `e il primo contributo che proponiamo di apportare con questo lavoro di tesi: una metodologia e una implementazione (tramite la programmazione di uno tool) di analisi del rischio basata sulla topologia di rete. L’importanza di questo strumento la si pu`o comprendere a pieno solo scoprendo il secondo contributo che questa tesi vuole dare; l’automazione di un processo di valutazione globale del rischio su diverse vetture perme-tte di testare e valutare velocemente diverse configurazioni della topologia di
rete e di conseguenza permette di trovare velocemente le contromisure che decrementino il valore di rischio maggiormente. E questo `e quindi il sec-ondo contributo che proponiamo: un algoritmo di generazione automatica di contromisure basato sulla diminuzione del rischio globale di una specifica architettura.
Per raggiungere questi obbiettivi siamo partiti inizialmente dagli studi esistenti e dalle metodologie gi`a realizzate che abbiamo modificato per adat-tarle al nostro bisogno. Siamo partiti quindi dalla definizione delle possi-bili minacce attraverso la costruzione di alberi d’attacco che rappresentano i possibili scenari dell’attaccante mostrando come pi`u azioni di basso livello vengono integrate per ottenere obbiettivi di alto livello. In questo modo abbi-amo creato una connessione fra l’architettura (le azioni di basso livello sono state infatti mappate sui diversi componenti) e il rischio (gli obbiettivi di alto livello sono stati valutati secondo la loro pericolosit`a) che ci permettesse di attribuire un valore globale di rischio a una determinata topologia. Poi abbiamo costruito l’algoritmo di generazione delle contromisure il quale ha come perno del suo funzionamento proprio la valutazione globale del rischio; ad ogni step infatti prova tutte le possibili combinazioni di spostamenti di un componente da un bus all’ altro della topologia oltre a provare possibili inserimenti di gateway e alla fine applica la contromisura che maggiormente diminuisce il valore di rischio. L’algoritmo termina quindi con una soluzione di topologia ottimale che tiene anche conto di eventuali vincoli di proget-tazione previsti dal produttore.
Una volta sviluppato il tool che implementasse queste metodologie, lo ab-biamo applicato alle topologie di tre autoveicoli in circolazione e ne abab-biamo constatato la funzionalit`a anche paragonando i risultati ad altre valutazioni precedentemente fornite da esperti del settore.
Questa tesi vuole essere quindi un punto di partenza per la progettazione di nuovi e pi`u precisi strumenti che aiutino i produttori in fase di proget-tazione a trovare le contromisure prioritarie per produrre automobili sempre pi`u sicure.
Chapter 1
Introduction
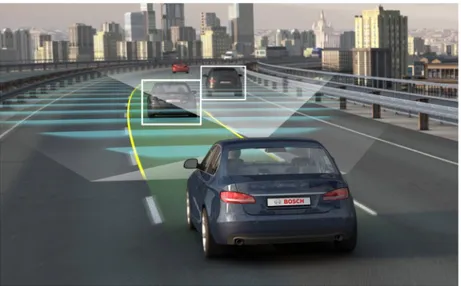
In last years vehicles and all automotive industry has received a strong in-novative boost, more than many other technology industries. At first with the introduction of new safety systems like collision avoidance or lane assist (figure 1.1) and later with the integration of wireless communication system like WiFI, GSM or those proposed to implement the V2X paradigm, the car has exceeded the number of one hundred millions lines of code (more than a space shuttle or a Boing 777) [2]. For this reason, in many cases we have to consider new road vehicles not just like “smart cars” but more like “comput-ers on wheels”. As always, the introduction of new technologies brings new risks to machines and humans, in this case mostly increasing the so called “cyber risks”. Moreover, in the specific scenario of vehicles these risk may be considered even more dangerous due to the nature of systems they can a↵ect: being cars both computers and physical systems they can be classified as cyberphysical systems, and for this reason deserve even more attention due to the safety implication that could be generated by flaws, that may lead to put in danger people inside or around the vehicle.
In the past, cybersecurity was not a design-phase concern for most vehicle networks: as a matter of fact, the very first document about a comprehensive cybersecurity assessment of such networks is less than 10 years old [3,4]. Suc-cessivly, the appearance of the first standards by SAE [5] fueled the interest
Figure 1.1: Active Lane Assist and Adaptive Cruise Control
of manufacturers for embedding security considerations into the design phase of new vehicles and nowadays new analysis tools are rising.
Moreover, we need to consider that the technology used today to protect vehicles are very often in use for ten years or more, so any design observation that is applied today needs to ensure that it can last up until 2030 without having to be physically changed.
If we consider the whole set of attacks that have been proven possible by multiple researchers [3, 4, 6, 7] we easily understand the importance of security in vehicles. In fact, in these studies, researchers can manage to put at risk the privacy and safety of the driver, passengers and people surround-ing the vehicle also demonstratsurround-ing the eventual damage that this type of attacks could cause. For instance they have been able on di↵erent cars to control the braking, the steering, the acceleration and to show messages on the display by only accessing the OBD-II port of the vehicle. Subsequently they also demonstrate the possibility to access the car internal network re-motely through attack surfaces like the Bluetooth, Wi-Fi, Cellular or other communication interfaces.
For these reasons, while designing new vehicles, connected and full of cy-berphisical systems, it is extremely important to focus on security especially
when considering the electronics architecture. The design phase of the ECUs and all electronic parts of a vehicle comprehends multiple steps, from the design of the single unit, both from a hardware and software point of view, to the layout of the on board network topology composed of all the com-municating units and sensors; the focus of this thesis work is on the latter one. The main known analyses about this subject have been done by Miller and Valasek [8], by the european project EVITA [1] and the SAE guidebook SAE-J3061 [5]. The latter one proposes guidelines for a secure design of on board networks and it higlights the importance of risk analysis in the de-sign phase but has not been thought to produce a practical methodology to evaluate an existing architecture. On the other hand, Miller and Valasek have been known for their proof of concept attacks first through the OBD-II port of a vehicle [6] and then through external connections such as Wifi and cellular networks [9]. Apart these two extremely significant papers they also proposed an analysis of the on board network of multiple vehicles, which considered mostly the risks involved with the layouts of the networks and the ease, for an attacker, to reach safety critical ECUs. Although the analyses done are complete and well described, what is not proposed in their work is a way to systematize the process of risk analysis for automotive vehicles. This has been partially solved by Ruddle et al. [1] in their paper for the EVITA project: they came out with a methodology to produce risk analyses for the automotive industry. This type of risk analysis provides risks associated to each attack but the main limit is that it is not topology based: it does not depends on the specific car, it gives the same results for each di↵erent scenario.
Our proposal focuses mainly on three di↵erent contributions:
1. An improved risk analysis methodology based on the one by Ruddle et al., that maintains part of the core concepts of the well known project but enables the possibility to create an ad-hoc topology based analysis for each network.
that focuses on changing the layout of the topology and inserting fire-walls if needed.
3. An implementation of the aforementioned methodologies to systemati-cally and automatisystemati-cally retrieve the scores of each network and discover the optimal solutions, using as inputs only the description of the topol-ogy itself, without having to create each attack path for each topoltopol-ogy. We have finally analyzed tests performed with the developed tool on three di↵erent real architecture topologies (the 2014 Jeep Cherokee, the 2014 Audi A8 and the 2010 RangeRover Sport) to evaluate the program outputs and we have verified results meaningfulness compared to considerations made by Miller and Valasek in [8].
The rest of this work is structured as follows: chapter 2 presents the problem and the goal of the study alongside a background section, chapter 3 presents the whole methodology, focusing first on the attack trees and risk function used to retrieve the scores for each attack, and then on the algo-rithms and methods used to obtain from those scores the whole topology based risk analysis and solution proposals for the specific network. Chap-ter 4 describes the implementation of the proposed methodologies in a semi automatic tool while chapter 5 presents the results of our work, comparing them with other previously evaluations. Finally chapter 6 discusses the re-sults we found and concludes the thesis with an analysis of possible future works.
Chapter 2
Motivation and Background
2.1
Problem Statement
Every security specialist knows that no system is invulnerable and that every securing problem is a risk management problem with the usual trade o↵ be-tween risks and costs. In fact preventing every single attack against a system is more than often infeasible either due to specification requirements or in terms of costs. These notions also apply to automotive systems and led us to look for a risk analysis methodology that allows us to find the most risky attacks. Based on these analysis outputs we could propose specific priori-tized countermeasures. Prioritization is the keyworld of this work: having said that we cannot deal with every possible attack, we need to find which countermeasures have to be done at first in order to minimize the risk.
Vehicle internal networks are quite various, having di↵erent kinds and amounts of ECUs and di↵erent ways of interconnecting them. It is easy to understand how the topology of a vehicle influences the risk related to attacks. A vehicle with no wireless communication interface and no cyber-physical system is clearly less attackable than a system full of external con-nections and automatic driving tools. Therefore, threat analysis and risk assessment process (TARA) needs to be topology based in order to consider the influence of the architecture on it.
2.2
State of the art
In this section we present the main studies and works that have been pro-duced regarding risk analysis in the automotive sector and evaluations on car internal architecture topologies.
2.2.1
Risk Analysis
EVITA Project
Ruddle et al. produced a paper [1] for the EVITA European project in which they also described a methodology to produce risk analyses for the automo-tive on board networks. The way they propose it is by using a technique that relies on attack trees (a conceptual representation of the necessary steps to perform an attack) and that enables the analyst that is assessing the secu-rity of the network to retrieve rankings through a risk function, so that it is possible for her to analyze a set of possible attacks basing on a common measurement system. In this way the analyst can understand which are the more risky attacks and therefore the ones that have higher priority in being prevented. There are three specific elements of Ruddle et al. proposal that we focus on improving: the first is that it is not topology oriented, it can be used to describe the attack path on a general layout but it has not been thought to change the risk of specific attacks in specific network layouts. The second is that it requires the analyst to describe, for each attack, the whole attack path by hand to retrieve the final attack score. Finally, it does not easily provide solutions to the highlighted vulnerabilities.
SAE
The document J3061 produced by SAE International [5] is a strong cyber-security guidebook for vehicle systems throughout the entire development lifecycle process. The authors of the document firmly state the necessity of a Threat Analysis and Risk Assessment (TARA) process in the design phase
Figure 2.1: Security requirements determination process
in order to identify cybersecurity goals and then requirements as described in figure 2.1. The work also cites the EVITA Risk Analysis [1]as one of the valid methods to implement the TARA process.
2.2.2
Architectures Evaluation
Miller and Valasek
As we already said above, these two researchers in one of their works [8] proposed an analysis of the on board network of multiple vehicles, which considered mostly the risks involved with the layouts of the networks and the ease, for an attacker, to reach safety critical ECUs. They used the in-formation retrieved by the analysis of the vehicle to propose a ranking that mainly considered the architecture of the network, the amount of external attack surfaces and the dangerousness and amount of cyberphysical controls that the vehicle had such as cruise control and lane assist. These analyses are well described and very extensive since they considered very di↵erent topologies, however the main limit is that when they evaluated the architec-ture of the network (one of the three main factors) they attributed values
Figure 2.2: Digital I/O channels appearing on a modern car
only based on their personal consideration and knowledge. Having done this way, they did not provide a standard method to establish the riskiness of an architecture topology. By the way we used their topologies and rankings as a valid and trusted benchmark to compare our evaluations.
Checkoway et al.
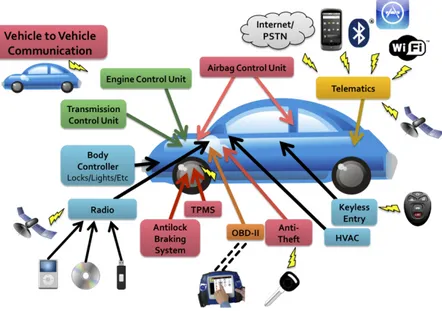
Concerning architectures but not focusing on topologies, Checkoway et al. produced a paper [4] that analyzes a large number of attack surfaces. This work has been an important step towards the study of the subject because besides providing a general framework about what are the possible entry points to direct an attack against a car (figure 2.2), it also developed sur-faces evaluations regarding attack range, attack costs and vulnerability level: a necessary starting point for every consideration about architecture topolo-gies.
2.3
Goals and Challenges
The main two goals of our work are:
• Topology Based Risk Analysis: define and implement through a tool a methodology to asses the threats and analyze the risk of a system considering both the set of possible attacks and the actual internal architecture topology of the vehicle.
• Automatic Countermeasures Proposition: define and implement through a tool a methodology to automatically generate countermea-sures that decrease the global risk of the architecture.
These two goals opens several challenges to overcome. For instance in or-der to calculate the risk we need to define a risk function and so decide the parameters that determine the risk, then how this risk function is influ-enced by the topology. Moreover all these processes need a mapping between components of the architectures and possible attacks in order to establish a connection point (influence point) between the two data structures. Regard-ing the countermeasures proposition we need to define what types of coun-termeasures can be generated, what prioritization mechanism (optimization function) and then also which types of constraints can limit this process.
Chapter 3
Approach
3.1
Overview
Our aim is to devise a topology-based risk analysis methodology for auto-motive on-board networks and an algorithm that can automatically derive security solution proposals to improve the security of a vehicle. The set of proposed solutions might involve both movements in the network layout in order to protect the most important ECUs by increasing their distance from attack surfaces, as well as the possibility to insert gateways or other segre-gation mechanisms that strengthen the security of a specific subnetwork by shielding it from attack surfaces. In order to obtain both the risk analysis and the proposed improvements, we need an automated risk evaluation al-gorithm. In fact solutions proposals will be generated by an algorithm that at each step will look for the countermeasure that would lead to the highest decrease of the score output by the risk evaluation methodology.
This evaluation methodology and implementation must take into account an expansible set of known attacks to automotive on-board networks. In order to do so, we assign to each attack a grade called “risk value” that is used to classify its dangerousness and create a ranking. This score is calculated through a risk function that mainly considers the attack “severity” (the damage that the attack can cause) and its “feasibility” (the easiness of
implementation). The latter is obtained taking into account, through the development of custom attack trees, all possible combinations of single steps that may enable said attack. The whole process is automated and can be updated incrementally, supporting the analysts and designers at each step.
3.2
Details
Figure 3.1 may help in understanding the work path in a top down approach which sums up what has been said above. Starting from our goal that are the final “Risk Values” of the attacks, we understood that we need a “Risk Function” to calculate them. Subsequently we understood that the “Risk Function” needs some input values to elaborate the result and some of these parameters are the “Feasibility Values”. Finally we realized that in order to get these values that are related to attacks we need to model somehow the threats: “Attack Trees”. This final step will be our starting point.
Next subsections are structured as follows: at first in 3.2.1 we will de-scribe the attack tree designing process, then in 3.2.2 we will present the risk function and in 3.2.3 how it is applied to attack trees in the context of an “a priori” (not considering the topology) risk analysis. Subsequently in 3.2.4 we will show how the risk function is combined with an actual system architecture to provide a “topology based” risk analysis and finally in 3.2.5 we will explain how countermeasures are generated taking advantage of the risk analysis.
3.2.1
Attack Trees
We choose to model attack and threat scenarios through attack trees [10] in order to propose a systematic method to support risk analysis. As a matter of fact, this model shows how low-level actions interact to achieve high-level objectives through hierarchical diagrams, providing a methodical way of describing the potential attacks. It is a simple way to describe complex processes, such as cyberattacks, dividing them into small building blocks
Figure 3.1: Approach Work Path
which can be modularly assembled. In particular, each parent node in the tree represents an action that can be completed through children nodes.
We designed very structured trees with a precise level separation orga-nized in this order:
Goal ! Attack ! Method ! Step ! Action
The root of the tree is always an abstract goal (level 0) which the attacker wants to obtain. The goal is the final purpose of the attacker, what drives him to act and it does not consider in any way the means through which it has to be obtained, which is represented by the attack (level 1). Each attack can be achieved through di↵erent methods (level 2) which represent all the ways in which a specific attack can be performed. A method to be implemented requires a set of steps (level 3) which are all the elements that must be present or the intermediate objectives that have to be accomplished to execute that specific method. Finally, even a step can be obtained through multiple malicious actions (level 4) which are the basic element of the whole tree.
As we already said, this hierarchical model needs to be very structured an must maintain precise relationships among di↵erent levels. In fact we chose that the relationship between a node and his child nodes could only be of two types: logical OR or AND. In particular, starting from the higher levels, an attack is a logical OR combination of methods, a method is a logical AND combination of steps and finally a step is a logical OR combination of malicious actions. These rules have to be always respected while build-ing attack trees otherwise it would not be possible to enable a successive automatic risk calculation.
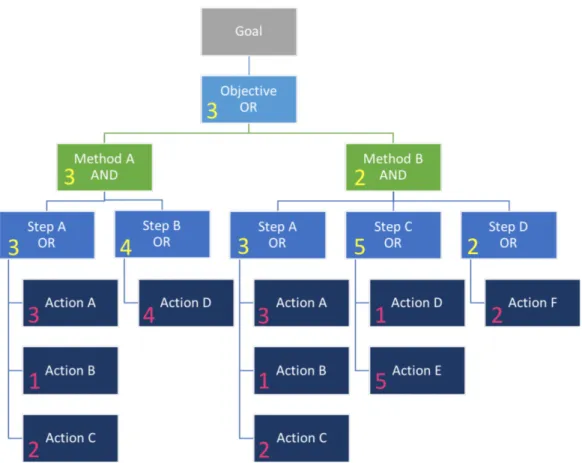
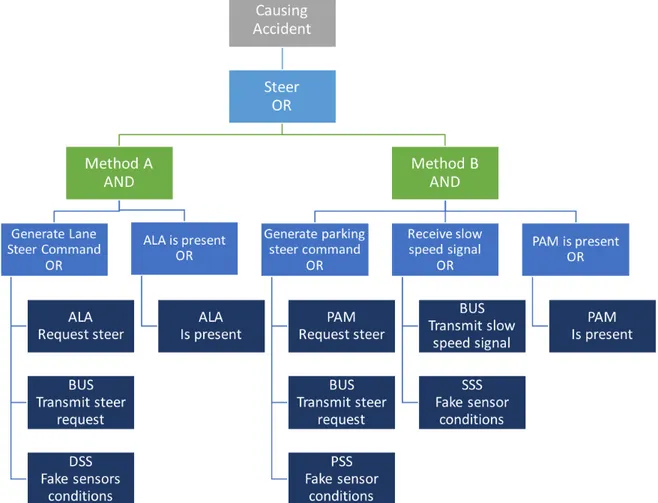
Figure 3.2 shows the hierarchy structure described above whereas figure 3.3 presents, as a simplified example, the modelling of an attacker who has the goal of causing an accident. In this example, the only way to cause an accident is to steer the car while the driver is not supposed to (although this one is not the only possible attack able to cause an accident, we made this supposition for sake of simplicity). To obtain this attack there are two methods, that we called “Method A” and “Method B”, that are alternatives (thus in a logical OR relationship). Method A consists of generating a “Lane Steer Command”, but it requires an ALA (Active Lane Assist) component to be present, so these two steps are in a logical AND relationship as both are necessary. In order to generate a steer command the attacker can either force the ALA to request the vehicle to steer for example through malware injec-tion, impersonate the ALA in the bus and send himself the forged request or simulate the environmental conditions which would require to turn, making so that the ALA acts in an incorrect manner without even reaching it. As these three Actions are equivalent, they are in an OR relationship. On the other hand, Method B consists of generating a “Parking Steer Command” but at the same time the PAM (Parking Assist Module) control unit needs to receive a “Slow Speed Signal”; in fact in most cases PAM module requests are ignored if the speed is over a defined threshold. Moreover this method obviously requires the presence of the PAM module. In order to generate a parking steer command the attacker can either force the PAM to request
the vehicle to steer, impersonate the PAM in the bus and send himself the forged request or simulate the environmental conditions which would require to turn, making so that the PAM acts in an incorrect manner without even reaching it. Whereas, to make the PAM receive the signal that the car is stopped or proceeding slowly the attack can directly transmit the information on the bus impersonating the sensor or manipulate the sensor to simulate a slow speed state.
Another important feature and rule that we can notice from figure 3.3 is that every malicious action (leaf nodes) is mapped on a precise possible component of the vehicle. This means that smallest building blocks used to build an attack tree can only be picked up from a set of possible actions on possible components.
Attack trees allow the model to be strongly modular, making it easy to add new methods by just combining steps, or by adding new ones. If new information arises (or new methods are identified) the model can be updated easily and updates can be propagated throughout the tree chain and through-out the other steps of our methodology. Also, the high level of abstraction of the root “goal” component makes it possible to comprehensively address the set of basic threats to vehicles through only five trees.
We list now the set of attacks that we identified divided in the five goals: • Causing an accident
– Adaptive Cruise Control DoS – Collision Avoidance DoS – Active Lane Assist DoS – Disable Brakes
– Brake
– Activate Air Bag – Turn O↵ Headlights – Lock Steering
– Steer
– Overheat Engine – Speed Up
– Turn O↵ Engine – Engage Seat Belt • Vehicle theft
– Remote Acceleration – Key less Ignition • Ransomware – Lock Engine – Lock Brakes – Lock Doors • Information theft – Eavesdrop On Conversations – Capture Cameras Images – Get Address Book
– Track Position • Insurance fraud
– Tamper Odometer – Hide Crash Info
While we do not claim to provide a complete coverage of all possible (or in-deed, even all known) attacks, it should be noted that our main purpose is to propose a methodology through which we can enable automation. Through this generalization therefore we propose a set of the major known attacks
and the known paths to implement them, so that it is possible just by im-plementing our proposal as it is to know how topologies are a↵ected by the most known and dangerous attacks, but we do not claim to provide the com-plete set of known automotive attacks. To model these threats and imagine many possible attack paths we studied in deep the bibliography produce by expert researchers. We have indeed found many attack methods ideas and proofs of concept in [3], [6] and [9]; most of the methods focused on two main steps: access the internal bus network through a communication interface and then send messages on the bus to trigger specific actions of the listening components.
Di↵erences from EVITA proposition
The idea of using attack trees in a vehicle environment, per se, is not novel: the EVITA project also explored it while making their risk analysis [1]. Our attack tree has a consistent strength in relation to the ones of the EVITA project though: in their trees there is no structured and clear division be-tween AND and OR levels. Although at first sight this could seem and advantage in terms of flexibility, it leads to situations in which high final objectives and initial actions are on the same level. Our methodology is in-stead more structured, without actually creating any limitations: although it may require to create one more step than the EVITA one to complete an attack tree, it makes possible to structure the same attacks on the same level of detail. Also, being more structured, it enables a semi automatic analysis through a tool we propose later in the paper.
More importantly, the novelty of our methodology is mapping the leaf nodes (low-level actions) onto the components of the network architecture. For instance EVITA does not di↵erentiate among proximity sensors, light sensors and speed sensors enclosing them in the category “In car sensors”, but our final objective, a topology based risk analysis, would be impossible without distinguishing those components.
3.2.2
Risk Function
Since our final goal is to highlight the most critical nodes of a vehicular network, and to propose design improvements, we need to devise a method and a function to calculate the risk of each attack patch in the tree. In particular, we need a function that takes as input variables of the the attack and outputs a risk value. Since it is one of the methodologies recommended by [5], we use a slightly modified version of the function and ratings proposed in [1]:
R = riskF (A, S, C) Where the inputs are:
• Severity (S), a parameter that represents the potential damage that an attack can cause. It is further broken down in four aspects or types of e↵ect (Safety, Privacy, Financial and Operational), each one with a parameter value that can range from S0 (no threat) to S4 (very significant threat). The four severity levels are defined as in Table 3.1 as proposed in [1].
• Controllability (C), a parameter that has to be considered only when the severity vector includes a non-zero safety component, and which represents the potential for the driver to confine the severity of the outcome. Four di↵erent levels of controllability are considered, from C1 (avoidance possible through human response) to C4 (situation im-possible to influence).
• Attack Feasibility1(A), a parameter that describes how easy is to
complete the attack on a scale from A0 (impossible) to A5 (very easy). All parameters are related to each specific attack (i.e., level 1 of the attack tree). Parameters S and C can be defined a priori for the attack, whereas 1This parameter was called “attack probability” in [1], but we decided to change the
Table 3.1: Attack severity classification scheme (from [1]) Severity
Value
Safety Privacy Financial Operational
0 No injuries. No unauthorized access to data. No financial loss. No impact on operational per-formance. 1 Light or moder-ate injuries. Anonymous data only (no specific driver of vehicle data).
Low level loss. Impact not
discernible to driver. 2 Severe injuries (survival prob-able). Light or moderate in-juries for multi-ple vehicles.
Identification of vehicle or driver. Anonymous data for multiple vehi-cles.
Moderate loss. Low losses for multiple vehi-cles. Driver aware of performance degradation. Indiscernible impacts for multiple vehi-cles. 3 Life threatening (survival uncer-tain) or fatal
in-juries. Severe
injuries for mul-tiple vehicles. Driver or vehicle tracking. Identi-fication of driver or vehicle, for multiple vehicles. Heavy loss. Moderate losses for mul-tiple vehicles.
Significant im-pact on
perfor-mance.
No-ticeable impact for multiple ve-hicles.
4 Life threatening
or fatal injuries for multiple ve-hicles.
Driver or vehicle tracking for mul-tiple vehicles.
Heavy losses
for multiple
vehicles.
Significant im-pact for multi-ple vehicles.
instead parameter A is derived through a two-step process: “Action Feasibil-ity Definition” and “Attack FeasibilFeasibil-ity Derivation”. Once these two phases are completed the process goes on with the “Risk Function Application”. Action Feasibility Definition
In the first step, we evaluate for each leaf node a set of attack require-ments2, i.e. the e↵ort needed for the malicious action to be successful. We
use a similar methodology to [1], considering five factors for each malicious action:
• Elapsed time: the total amount of time to identify a vulnerability, develop an attack and perform it.
• Specialist Expertise: the general knowledge required by the attacker in relation to these types of attack.
• Knowledge of the system under investigation: the specific knowledge of the system needed by the attacker.
• Window of opportunity: the time available to the attacker to access the exploitable target.
• IT hardware/software or other equipment: all kind of equipment needed to perform the attack.
We evaluate each of these factors according to Table 3.2, adding up the requirement values (the higher the value, the higher the difficulty or challenge for the attacker due to that factor). The result, evaluated according to Table 3.3, can be correlated to attack feasibility (of course, the higher the attack requirements, the lower the feasibility).
As an example, let us calculate the attack feasibility of a malicious action where a connected unit of a vehicle is remotely reflashed with a malicious firmware:
Table 3.2: Rating of attack requirements aspects (derived from [1])
Factor Level Comment Value
Elapsed Time 1 day 0 1 week 1 1 month 4 3 months 10 6 months 17 > 6 months 19
not practical The attack path is not exploitable within a timescale that would be useful to an attacker.
1
Expertise
Layman Unknowledgeable compared to experts or procificient persons, with no particular expertise.
0 Proficient Knowledgeable in being familiar with the security behaviour
of the product or system type.
3 Expert Familiar with the underlying algorithms, protocols, hardware,
structures, security behaviour, principles and concepts of se-curity employed, techniques and tools for the definition of new attacks, cryptography, classical attacks for the product type, attack methods, etc.
6
Multiple ex-perts
Di↵erent fields of expertise are required at an Expert level for distinct steps of an attack.
8 Knowledge Public e.g. as gained from the internet. 0
Restricted e.g. Knowledge that is controlled within the developer or-ganization and shared with other oror-ganizations under a non-disclosure agreement.
3
of system Sensitive e.g. Knowledge that is shared between discreet teams within the developer organization, access to which is constrained only to team members.
7
Critical e.g. Knowledge that is known by only a few individuals, access to which is very tightly controlled on a strict need-to-know basis and individual undertaking.
11
Window of
Unnecessary/ unlimited
The attack does not need any kind of opportunity to be real-ized because there is no risk of being detected during access to the target of the attack and it is no problem to access the required number of targets for the attack.
0
Easy Access is required for 1 day and number of targets required to perform the attack 10.
1 Moderate Access is required for 1 month and number of targets
re-quired to perform the attack 100.
4 Opportunity Difficult Access is required for > 1 month or number of targets required
to perform the attack > 100.
10 None The opportunity window is not sufficient to perform the attack
(the access to the target is too short to perform the attack, or a sufficient number of targets is not accessible to the attacker).
1
Equipment
Standard Readily available to the attacker. 0 Specialized Not readily available to the attacker, but acquirable
with-out undue e↵ort. This could include purchase of moderate amounts of equipment or development of more extensive at-tack scripts or programs.
4
Bespoke Not readily available to the public because equipment may need to be specially produced, is so specialized that its distri-bution is restricted, or is very expensive.
7
Multiple be-spoke
Di↵erent types of bespoke equipment are required for distinct steps of an attack.
Table 3.3: Attack Requirements to Action Feasibility Table (derived from [1]) Values Attack Requirements Action Feasibility
0-9 Basic 5
10-13 Enhaced-Basic 4
14-19 Moderate 3
20-24 High 2
25 Beyond High 1
• Elapsed time: some months are required to evaluate the ECU vulner-abilities and write the malicious firmware, 17
• Specialist Expertise: an expert is required, 6
• Knowledge of the system under investigation: supposing a reverse engi-neering process there is no requirement in relation to system knowledge, 0
• Window of opportunity: there’s no specific requirement as the vehicle just has to be turned on, 0
• IT hardware/software or other equipment: some tools may be required to analyze and reflash the ECU, 4
So the attack requirement value is 27, which corresponds to a rating “High” and to a feasibility of 2 (on our scale of 0 to 5).
By applying this analysis to all malicious actions we obtain the attack feasibility for each leaf node in the tree.
Attack Feasibility Derivation
In order to apply the risk function and calculate the risk value of a specific attack we need the attack feasibility at level 1 of the tree, however we have only defined action feasibilities at level 4 of the trees (leaf nodes). So we need a method to automatically calculate attack feasibilities starting from the action ones and to do this we can combine children level values to derive each parent level value in the tree. We therefore follow two simple rules: for
Table 3.4: Feasibilities derivation rules
Children Feasibility
Attack OR of ’Methods’ MaxA(Children Methods) Method AND of ’Steps’ MinA(Children Steps)
Step OR of ’Actions’ MaxA(Children Action)
Action A(Action) ={1 - 5}
OR nodes, the combined feasibility is the highest of the children feasibility values (as the attacker will choose the easiest path), whereas for an AND node the parent node feasibility is the same as the lowest value among its children as described in table 3.4. These two rules are very simple however we have to mention that we are no more considering “probabilities” but “feasibilities” so we are not forced to use values between 0 and 1, furthermore it is an approach really similiar to the one applied by [1]. In this way, following a bottom-up precess, we derive the combined feasibility of each step until reaching level 1 attack feasibility.
A practical example of this attack feasibility derivation process is visible in Figure 3.4.
Risk Function Application
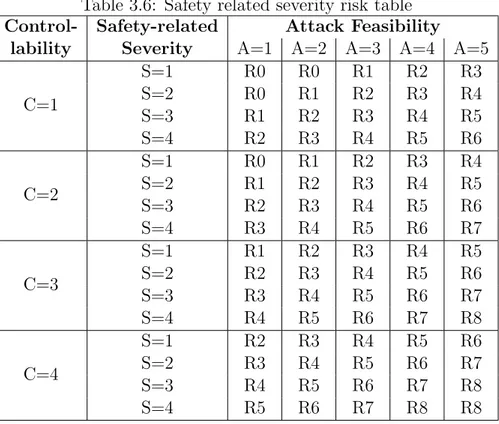
At this point, we can apply the methodology described in [1] to combine S, C and A into a qualitative risk value, ranging from R0 (no risk) to R8 (unacceptable/extreme risk). We obtain one risk value for each attack and each risk category: safety risk, privacy risk, operational risk, financial risk. For the first category, Table 3.6 is used, while for the risks not connected to safety, Table 3.5 is used (since controllability does not influence the outcome). Furthermore, for both tables this rule is valid: if a severity level of an attack is 0, the risk level of the attack related to that severity will be 0 (if an attack doesn’t have privacy related consequences, there is no privacy risk about that attack).
Figure 3.4: Feasibility computation example. In red, the action feasibility de-fined as described above, and in yellow the derived values for steps, methods and objectives.
Table 3.5: No safety related severity risk table Security Risk Level(R) Attack Feasibility
A=1 A=2 A=3 A=4 A=5
Non-Safety Severity
S=1 R0 R0 R1 R2 R3
S=2 R0 R1 R2 R3 R4
S=3 R1 R2 R3 R4 R5
Table 3.6: Safety related severity risk table Control- Safety-related Attack Feasibility
lability Severity A=1 A=2 A=3 A=4 A=5
C=1 S=1 R0 R0 R1 R2 R3 S=2 R0 R1 R2 R3 R4 S=3 R1 R2 R3 R4 R5 S=4 R2 R3 R4 R5 R6 C=2 S=1 R0 R1 R2 R3 R4 S=2 R1 R2 R3 R4 R5 S=3 R2 R3 R4 R5 R6 S=4 R3 R4 R5 R6 R7 C=3 S=1 R1 R2 R3 R4 R5 S=2 R2 R3 R4 R5 R6 S=3 R3 R4 R5 R6 R7 S=4 R4 R5 R6 R7 R8 C=4 S=1 R2 R3 R4 R5 R6 S=2 R3 R4 R5 R6 R7 S=3 R4 R5 R6 R7 R8 S=4 R5 R6 R7 R8 R8
To clarify with an example, let us suppose that for the attack shown in Figure 3.4 severity and controllability are defined as follows:
• Safety Severity: 3 • Operational Severity: 4 • Privacy Severity: 0 • Financial Severity: 2 • Controllability: 3 • Attack Feasibility: 3
If we apply tables 3.5 and 3.6 to the values above we obtain risk values (divided in four respective categories) relative to the specific attack. The result is the following:
• Safety Risk: 4 • Operational Risk: 3 • Privacy Risk: 0 • Financial Risk: 1
3.2.3
A Priori Risk Analysis
With the terms “a priori” and “topology based” we want to di↵erentiate be-tween an analysis that doesn’t take the topology into account and an analysis that does. In fact the two approaches will have di↵erent inputs, di↵erent aims and di↵erent outputs. An “a priori” risk analysis, not considering a precise car model or system architecture, is more generic and less precise. Its only goal is to identify the main risks to be aware while designing a system and rank them to prioritize countermeasures. It will not be able to automatically understand if an attack is actually performable on the specific car which is being designed; this could be done through a “topology based” risk analysis that will consider instead the actual architecture topology of the system. An “a priori” analysis applied to di↵erent cars will have the same outcome since the topology will not influence calculations whereas a “topology based” anal-ysis applied to di↵erent cars will provide di↵erent outcomes. Having di↵erent outcomes means that we will be able to evaluate and compare architectures. Complete Process
The process of the “a priori” risk analysis is exactly the one described until now and corresponds to applying the risk function to all attacks present in the attack trees after having defined or derive all parameters. Figure 3.5 may help synthesizing how the process work: Malicious Actions of the attack trees are passed through an attack requirement analysis as a first step and from this phase the Action Feasibility is defined. The generated Action Feasibilities are then used as inputs of the attack trees to derive Attack Feasibilities. Finally,
Figure 3.5: Algorithm sequence process (“a priori”)
The Attack Feasibilities alongside the Severity and Controllability of each attack are passed through the Risk Function to obtain the set of outputs that we present in next subsection.
Outputs
At the end of the topology-based risk analysis process, we obtain as outputs: • The attack trees generated from original ones, annotated with
up-dated feasibilities and with risk values for each attack.
• A ranking of the most dangerous attacks, by safety, privacy, finan-cial or operational risk value.
• A ranking of the most sensitive malicious actions, showing the actions most involved in dangerous attacks: they can be ranked by an “importance value” obtained by adding together all the risk values of attacks in which the malicious action is involved, multiplied by the feasibility value of the action and by the feasibility value of the method
in which it appears (to give a higher importance to malicious actions that are easier to implement or that appear more frequently).
3.2.4
Topology Based Risk Analysis
The core novelty of our approach lies in the topology-based risk assess-ment. All previous research, to the best of our knowledge, always focused on analysing the risk either ignoring the actual architecture of the vehicle, or at best assuming it to be known a priori and fixed, a sort of “black box” that influences the output but is not a parameter under assessment.
We aim to perform a topology based analysis where we consider only attacks that are actually achievable given the topology under assessment and considering the impact of the topology on the feasibility of those attacks, with the final aim of proposing structural countermeasures.
In order to achieve this, we need to “map” the risk function discussed in Section 3.2.2 onto the topology model.
The first step is to provide a structure to model the architecture. In most cases, in-vehicle communications are based on di↵erent buses, on which sig-nals are transmitted using di↵erent protocols (the typical choice is CAN [11] but even LIN [12] is quite common). In this thesis we do not consider the specific di↵erences among such protocols, although the modularity of the analysis and of the developed tool allows future extensions in this direction and requirements can be simulated with constraints.
In most such architectures, there are several ECUs connected to a small number of di↵erent buses. Some ECUs are connected to more then one bus, acting as gateways. It is natural to represent such topologies using graph models, in particular star graphs. In these graphs we distinguish two di↵erent kinds of existing components: either an ECU is connected with external surfaces and is therefore defined as an attack surface or it is not and is then consider as a normal ECU. Finally, we map all buses to the attack tree leaf nodes that are involved in attacks focusing on a bus (i.e. DoS of CAN Bus) so that the action involves only the specific bus that is being attacked.
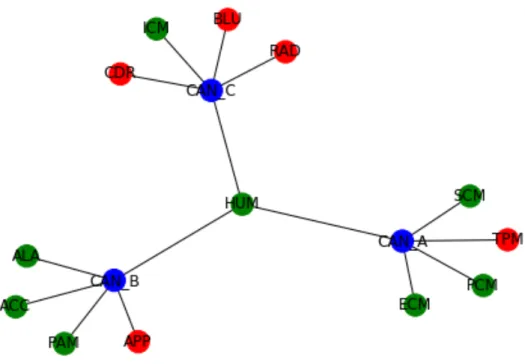
Figure 3.6: Topology example: three buses coloured in blue and multiple components connected to them (red for attack surfaces and green for other ECUs)
An architecture topology model example is provided in figure 3.6.
In order to map risks onto the topology, our key intuition is that the only input of risk functions (attack feasibility, severity and controllability) that can change due to the topology is the attack feasibility, as controllability and severity are related directly to the higher levels of the attack tree. Therefore, if we can link attack feasibility at leaf node level to the topology of the network, we can apply the very same process described in Section 3.2.2 to obtain a risk value that is influenced and changes along with the topology.
The only di↵erence we implement when working on the topology based risk analysis in relation to the risk function is that instead of using the tables proposed in section II-B to obtain the risk value, which only accept finite output values, we use the linear functions that represent said tables: for non
safety risk values (table 3.5) we use
Rx= Ax+ Sx 3
for safety related risk values (table 3.6) we use Rs= As+ Ss+ C 4
Values are then capped at a maximum of 8 and a minimum of 0 if required, to follow the tables. As in previous “table” version for both functions is valid this rule: if a severity level of an attack is 0, the risk level of the attack related to that severity will be 0. Moreover is also valid this other rule: if the feasibility of an attack is 0, then all risk values of the attack are 0. This second rule wasn’t considered in “a priori” risk analysis because it wasn’t permissible that a feasibility could be 0 whereas now this is a possible case. The impact of topology on attack feasibility can be twofold. The most trivial impact is that, in some architectures, an attack cannot be performed because of the absence of a specific required component. For instance, any attack which has a step where malware should be re-flashed on the Parking Assist Module of a vehicle cannot be performed if this specific ECU is not present. We handle this trivial case by setting to 0 (impossible) the feasibility of any action related to components not found in the topology.
More interestingly, as suggested by Miller and Valasek in [8], the prox-imity of an ECU to attack surfaces influences the feasibility. For example, observe Figure 3.6: an injection on the CAN-C bus can happen through mul-tiple attack surfaces, such as Bluetooth, CD reader and radio receiver. This is more feasible, for an attacker, than injecting content on a bus that is not connected to the outside. In order to account for this, we divide components in two categories: attack surfaces and simple components. Attack surfaces are all those components that o↵er an opportunity to the attacker to access the internal network. Not all attack surfaces are equally dangerous, so we rank them along three dimensions:
• Cost: a value from 1 to 3 describing the cost and the e↵ort necessary to break into the component and take control (1 means “high cost”, 3 means “low cost”)
• Surface: a value from 1 to 3 related to the amount of possible new attack steps that can be done if the attacker obtains control of the component (1 means few, 3 means many)
• Range: a value from 1 to 3 describing the necessary physical distance from the vehicle to access the surface (1 means “in car”, 3 means “re-motely exploitable”)
Once these values are set, they are added up and the result is transformed in a number between 1 and 3, 1 if the sum is between 1 and 5, 2 if the value is 6, 3 if the value is higher, obtaining a “dangerous parameter” value for every surface.
Established “dangerous” parameters of the surfaces it is possible to write a function for the update of the action feasibilities based on the distance between component and surfaces. To do so we define and use these values and functions:
• dx: distance between component and surface x defined as number of
minimum hops in the topology graph to reach one node starting from the other one (minimum value is 1).
• ax: “dangerous” parameters of the surface x (one for each attack surface
of the topology).
• w: is a value called “influence weight” whose objective is to define how much the topology should influence the action feasibility update (1 = high influence, 5 = low influence).
• Iw: through a function defined as
Iw = ( N X x=1 ax dx )/w
we produce the value that is going to update the action feasibility. it lowers each dangerous parameter value in relation to how far it is from the considered component, sums all of the resulting values and then divides the result foir w, lowering the impact of the topology on the risk assessment if required.
• K: malicious actions of the analyzed component (i.e. for Head Unit currently the two feasible actions are Root Access and Malware injec-tion).
• py: feasibility of action y of the component analyzed:
py = py + Iw
4
w for each y in K
The function increments the action feasibilities of all those actions con-cerning components that have a high number of surfaces in their prox-imity considering the distance and considering the dangerous level of the surfaces. The factor 4
w is used to maintain feasibilities around
original values and avoid a saturation of feasibilities values to 5. Complete Process
Figures 3.7 and 3.8 may help understanding how the whole risk analysis process work: Malicious Actions are passed through an attack requirement analysis as a first step, not considering the topology of the specific vehicle. From this process the Action Feasibility is derived. The topology of the vehi-cle is then taken into consideration, deleting the impossible actions (making their feasibility 0) and updating the Action Feasibility of the remaining. The generated Action Feasibilities are then used as inputs of the attack trees of all the considered attacks, generating Attack Feasibilities for the specific topology. Finally, The Attack Feasibilities alongside the Severity and Con-trollability of each attack are passed through the Risk Function to obtain the set of outputs that we present in next subsection.
Deletion of Impossible Actions
Attack Feasibility Severity Controllability
Risk Function Updated Attack Trees Mapped on Real Architectures Rankings of Attacks Dangerousness Action Importance Values Ranking of Actions Sensibility Path Value Ranking of Most Crossed Components Risk Value of the
Architecture Action Feasibility Malicious Action TOPOLOGY Update of Action Feasibilities Attack Requirement Analysis Attack Tree Outputs Inputs Functions
Figure 3.8: Algorithm sequence process (“topology based”) Outputs
At the end of the topology-based risk analysis process, we obtain as outputs: • The attack trees generated from original ones, mapped on the topol-ogy of the vehicle buses, annotated with updated feasibilities and with risk values for each attack.
• A ranking of the most dangerous attacks, by safety, privacy, finan-cial or operational risk value.
• A ranking of the most sensitive malicious actions, showing the actions most involved in dangerous attacks: they can be ranked by an “importance value” obtained by adding together all the risk values of attacks in which the malicious action is involved, multiplied by the feasibility value of the action and by the feasibility value of the method in which it appears (to give a higher importance to malicious actions that are easier to implement or that appear more frequently).
ob-tained by sorting the components according to the number of paths they are traversed by, from each attack surface to all components in-volved in malicious actions.
• A global risk value for the architecture, that can be obtained by adding together all risk values (safety, privacy, financial, operational) of each attack. It is a good approximation of an overall risk evaluation of the architecture.
3.2.5
Countermeasures Generation
Besides o↵ering all of the indicators listed in Section 3.2.4, which can be analysed by the designer to implement bespoke defence mechanisms and evaluate their impact (as briefly described in 3.2.5), our approach can also automatically suggest countermeasures for the proposed network topology. As we already stated, the distance between attack surface and target ECU plays a crucial role in defining the risk, so changes of the topology could better the architecture evaluation.
In order to help architecture designers to improve topologies and de-crease the global risk, we developed an algorithm that, starting from the original topology, proposes changes trying to reach a local optimum for the risk value. In particular, at each step the algorithm looks for the action that decreases the risk value the most, among two types of architectural counter-measures:topological changes or insertion of security gateways (i.e., firewall components).
The algorithm tries, first, all possible shifts of a component from a bus to another. After each movement, it recomputes the global risk value of the architecture. After trying all possible changes (separately), the algorithm saves the one that produces the maximum reduction of risk.
In a second phase, the algorithm tries to replace each component with a gateway, and to attach the component to that gateway. In this way, it increases the distance amongst components, so that attack surfaces have less
Figure 3.9: Gateway Insertion Example: a gateway has been added (coloured pink) between the “Apps and Internet” component and the rest of the net-work.
influence in increasing attack feasibility. After trying all possible insertions, the algorithm saves the one that produces the maximum reduction of risk. In Figure 3.9 we show an example of gateway insertion in the topology pre-viously presented in Figure 3.6.
Finally, the algorithm proposes the action among all the ones attempted that produces the largest decrease of risk value. After having confirmed this first best action, the topology is updated, and the algorithm can be rerun to find the “next best” action to perform. The complete process is the one described in figure 3.10.
As the knowledgeable reader might have noticed, many of the structural changes randomly proposed by such an algorithm would violate design con-straints. For instance, the algorithm may propose to move the Adaptive Cruise Control ECU far away from Speed Sensor for risk reasons relative to the bus in which ACC is communicating but this distance between ACC
Figure 3.10: Countermeasure Generation Process
and Speed Sensor could generate an unacceptable latency. To overcome this problem we add to the algorithm a list of requirements that have to be verified before proposing any change. The algorithm accepts two kind of requirements:
• DisMax, A, B: distance between component A and component B must be lower than this value
• DisMin, A, B: distance between component A and component B must be grater than this value
This list of requirements is completely programmable by the designer or by the analyst. One of the requirement that we choose to add by default is the impossibility to have two consecutive linked gateways as it would be useless.
Pruning
The evolution of the algorithm often generates topologies that need to be fixed, therefore after each step the algorithm checks and corrects any problem that has been produced amongst these:
• Useless Bus: if a bus becomes empty due to all components connected to it being moved to another subnetwork the bus is removed.
• Useless Gateway: if a bus is removed leaving a gateway connected only to one single component, the gateway is removed.
• Gateway Chain: if the only components that are communicating on a bus are two gateways, one can be removed alongside the bus inbetween them.
Termination and cost based regularization
After each termination the countermeasures algorithm moves a maximum of one component or inserts only one gateway. The process can then be run again on the new topology until there is no movement or gateway that decreases the risk value of a topology, which makes it a local minimum.
Supposing that the algorithm is run until its local minimum and without any distance constraint inserted the final result is a network in which every component is shielded by a gateway and ”owns” a bus. To avoid this solution which is clearly not optimal in real world scenarios due to time and cost limitations it is possible to add distance constraints amongst all components, which leads to faster and more realistic final configurations.
Analysis of the risk analysis outputs
Apart the automatic countermeasures proposals described above it is also possible for an analyst to consider the outputs of the risk analysis to under-stand which other countermeasures to apply and how to apply them. It is not possible to push the risks to a value of 0 mainly for economic reasons but the analysis of the outputs makes it possible to focus on the most important ones.
Considering the Attack Rankings it is possible to understand which attacks have to be prioritized in terms of countermeasures.
Analyzing Action Rankings an analyst can understand which are the actions that are mainly applied in attacks, considering both the number of attacks who apply that action both the dangerousness of those attacks.
Through these information it is possible to derive if some other countermea-sures are required for a specific action that is involved in many attacks. For instance bus injection is one of the most common actions and the analyst can consider if, for a specific bus, it may be required to improve cryptography or if an intrusion detection system [13] could be a solution.
Finally considering Path Value Ranking it is possible to understand which are the components that are mostly traversed by attacks paths, still considering the dangerousness of each attack which involves that component. This gives an interesting view on the components that are key nodes of the architecture, from an attacker point of view. The analyst can then decide for example to implement the software security of said component, or implement a firewall to ensure its security.
Chapter 4
Implementation Details
4.1
Tool overview
As introduced before, we developed a tool to perform the risk analysis and countermeasures proposals in a semi automatic way. The program takes as input three files (XML) and combines them to build a complete attack tree. These three files are “components.xml”, “steps.xml”, “trees.xml” and contain respectively: a list of actions on components, a list of steps, a list of attacks and methods. Then the tool imports a topology file (XML) that can be chosen by the user among di↵erent loaded topologies and subsequently it performs the analysis logging the outputs on the console and producing some output files. Finally it starts the countermeasures generation that can be carried forward step by step or directly until the terminal configuration that is the local optimum point. The main procedure code is contained in a script (Python) named “main.py” that calls functions and algorithms defined in another file (Python) named “functions.py”.
In building the tool we have used these coding languages and libraries: • Python: an object oriented programming language that we used to
write scripts, functions and algorithms.


![Table 3.1: Attack severity classification scheme (from [1]) Severity](https://thumb-eu.123doks.com/thumbv2/123dokorg/7497663.104270/33.892.162.761.371.920/table-attack-severity-classification-scheme-severity.webp)
![Table 3.2: Rating of attack requirements aspects (derived from [1])](https://thumb-eu.123doks.com/thumbv2/123dokorg/7497663.104270/35.892.156.779.222.1079/table-rating-attack-requirements-aspects-derived.webp)