D
OTTORATO DI RICERCA IN
M
ALATTIE
I
NFETTIVE
,
M
ICROBIOLOGIA E
S
ANITÀ
P
UBBLICA
Biomonitoring data as a tool for assessing mycotoxins
exposure of workers
Candidata
FRANCESCA DEBEGNACH
Tutor
Coordinatore
Prof.ssa Francesca Buiarelli
Prof. Stefano D’Amelio
SUMMARY
1. INTRODUCTION 1
2. GENERAL ASPECTS 2.1. Mycotoxins 4
2.1.1. Human exposure to mycotoxins 6 2.2. Aflatoxins (AFB1, AFM1, AFB1-N7-Guanine, AFB1-Lysine) 9 2.2.1. Physical and chemical properties 9 2.2.2. Toxicity and metabolism 12
2.3. Ochratoxin A 14
2.3.1. Physical and chemical properties 15
2.3.2. Toxicity and metabolism 16
2.4. State of the art 19
3. MATERIALS AND METHODS
3.1. Samples 23
3.2. Analytical method
3.2.1. Apparatus 25
3.2.2. Chemicals and reagents 27
3.2.3. AFB1-N7-Guanine adduct synthesis 28
3.2.4. AFB1-Lysine adduct synthesis 31
3.2.5. Urine 3.2.5.1. Sample preparation 34 3.2.5.2. LC-HRMS analysis 35 3.2.5.3. Analytical quantification 40 3.2.6. Serum 3.2.6.1. Sample preparation 41 3.2.6.2. LC-HRMS analysis 42 3.2.6.3. Analytical quantification 46 3.3. Method validation 47 3.3.1. Identification criteria 47 3.3.2. Linearity 48
3.3.3. Limit of detection and quantification 48 3.3.4. Apparent recovery, matrix effect and extraction recovery 50
4. RESULTS AND DISCUSSION 4.1. Method validation
4.1.1. Identification criteria 52
4.1.2. Linearity 52
4.1.3. Limit of detection and quantification 56 4.1.4. Apparent recovery, matrix effect and extraction recovery
4.1.4.1. Urine 57
4.1.4.2. Serum 58
4.2. Analytical results
4.2.1. Statistical analyses and data handling – left censored data 60
4.2.2. Urine sample analyses 61
4.2.3. Serum sample analyses 66
4.3. Estimated daily intake 72
5. CONCLUSIONS 77
1
1. INTRODUCTION
Microscopic filamentous fungi, commonly known as molds, can develop on food commodities of plant origin (maize, wheat, etc.) and in some cases on commodities of animal origin (meat products, sausages). These molds can, in suitable environmental conditions, produce via secondary metabolism, chemical toxic compounds, known as mycotoxins. Mycotoxins can occur at pre-harvest, harvest and post-harvest stage.
Molecular structures of mycotoxins vary widely, so their effects on human and animal health also vary widely. Mycotoxins may be classified according to the target organ as hepatotoxins, nephrotoxins, neurotoxins, immunotoxins, or according to their toxicological effects as carcinogenic, genotoxic, mutagen, teratogen.
To date, more than 500 mycotoxins are known, even if researchers are focusing their scientific interest only to approximately 10 compounds, including aflatoxins and ochratoxin A due to their toxicity and widespread.
The most common route of exposure to mycotoxins is the ingestion through the diet by direct exposure, due to the consumption of contaminated food, or by indirect exposure through the consumption of food derived from animals fed with contaminated feedstuffs.
In addition to food diet, humans and animals can also be exposed to mycotoxins by inhalation of contaminated dusts. This phenomenon is particularly observed in certain working places such as harbors and warehouses. Several studies report a higher prevalence of lung carcinogenesis and bronchus and trachea tumors in
2
workers exposed to aflatoxins contaminated dusts. Exposure by inhalation and/or dermal contact is well known in different branches of industry, especially where a significant handling of dusty commodities such as grains, spices, coffee, etc., is performed.
Due to their severe toxicological implications, exposure to mycotoxins must be characterized by an accurate evaluation. Commonly, two different approaches can be followed for targeting this issue: via dietary exposure assessment and/or via biological monitoring. In both cases, a considerable number of uncertainties is present because of the lack of representativity in assessing the intake via food and the peculiar characteristics of toxicokinetics and toxicodynamics associated to the intake of the parent mycotoxins and the formation in vivo of the corresponding biomarker of exposure in the case of biomonitoring studies.
The present study aims to explore the validity of the biomonitoring studies as a tool to investigate the intake of mycotoxins in population groups such as workers operating in risky workplaces, being potentially exposed to mycotoxins through the inhalation of contaminated dust and/or by dermal contact. The objective is to produce accurate exposure data and perform exposure assessment of these population groups, by considering the fraction derived from the workplace environment by inhalation of dusts and/or by dermal contact.
In particular, this study was conducted on two groups of population, the exposed workers group that includes staffs working in an Italian feed plant, and a control group composed by administrative employees (non-exposed) working on the same feed plant.
3
Urine and serum samples were collected for the determination of mycotoxins, namely aflatoxin B1, aflatoxin M1 and AFB1-N7-Guanine adduct were analyzed in
urine samples, while aflatoxin B1, AFB1-Lysine adduct and ochratoxin A were
analyzed in serum samples.
The analytical determination of mycotoxins and their metabolites should be based on validated method with performance characteristics fitting for the purpose of biomonitoring. Therefore, the study also includes the set up and validation of suitable methods for the determination of the selected analytes in specimens (LC-HRMS). In particular, for urine analysis two methods were optimized and validated, a dilute&shoot method and an immunoaffinity clean-up method; for serum analysis a method based on liquid-liquid extraction and QuEChERS purification was developed and fully validated.
Moreover, due to the unavailability of commercial standard of AFB1-N7-Gaunine
and AFB1-Lysisne, the adducts were synthetized. Unfortunately, it was not possible
to purify the synthesis products and to determine their concentrations; however, the obtained adducts were used for methods set up and for qualitative analysis (presence/absence) in the collected samples.
4
2. GENERAL ASPECTS
2.1. Mycotoxins
Microscopic filamentous fungi, commonly known as molds, can develop on food commodities of plant origin (maize, wheat, etc.) and in some cases also on commodities of animal origin (meat products, sausages). These molds can in suitable environmental conditions, produce chemical toxic compounds known as mycotoxins. The word mycotoxin stems from the Greek word µυκης, meaning mold, and τοξικόν meaning poison. Mycotoxins are naturally occurring secondary metabolites of some fungal species mainly belonging to the genera Aspergillus,
Penicillium and Fusarium.
Essential factors for fungi proliferation and mycotoxin production are both the stress of the plant, as derived by the extreme soil dryness or the lack of a balanced nutrient absorption, and environmental factors such as climatic conditions (temperature, humidity and water activity) or mechanical damage of kernels as well as insects and pest attack (CAST, 2003). Mycotoxins can occur at pre-harvest, harvest and post-harvest stage.
Molecular structures of mycotoxins vary widely, so their effects on human and animal health also vary widely. Mycotoxins may be classified according to the target organ, as hepatotoxins, nephrotoxins, neurotoxins, immunotoxins, or according to their toxicological effects, as cancerogenic, genotoxic, mutagen, teratogen.
5
To date, more than 500 mycotoxins are known, even if researchers are focusing their scientific interest only to approximately 10 compounds, including aflatoxins and ochratoxin A due to their toxicity and widespread (Hajslova, 2011).
The presence of mycotoxins in a food commodity can occur even in the absence of a visible mold infestation due to a ceased vital cycle of the microorganism or by the effect of a removal of the mold due to technological processing of the food commodity. Nevertheless, the presence of a visible mold on the surface of a food product does not represent a clear indication of the presence of a mycotoxin. Generally, plant-origin commodities directly contaminated by mycotoxins are cereals, with maize as the riskiest crop being a staple food in many parts of the world, dried fruit, spices, grape, coffee, cocoa, fruit juices especially apple-based and, at minor extent, meat products and licorice. During the storage cycle, mycotoxins can directly contaminate also cheeses and sausages.
In addition, food products can become contaminated as a consequence of a carry-over from contaminated feeds and be present in food of animal origin such as milk, eggs and, at a minor extent, meat. It has to be noted that mycotoxins resist high temperatures and the common domestic cooking procedures are not able to destroy them.
6
2.1.1. Human exposure to mycotoxins
The most common route of exposure to mycotoxins is the ingestion through the diet by direct exposure due to the consumption of contaminated food, or by indirect exposure through the consumption of food derived from animals fed with contaminated feedstuffs.
In addition to food diet, humans and animals can also be exposed to mycotoxins by inhalation of contaminated dusts (Flannigan, 1996). This phenomenon is particularly observed in certain working places such as harbors and warehouses. Several studies report a higher prevalence of lung carcinogenesis and bronchus and trachea tumors in workers exposed to aflatoxins contaminated dusts (Lai, 2014; Liao, 2005; Van Vleet, 2001). Exposure by inhalation and/or dermal contact is well known in different branches of industry especially where a significant handling of dusty commodities such as grains, spices, coffee, etc., is performed, (Viegas, 2017; Viegas, 2015; Viegas, 2013; Viegas, 2012; Brera, 2002; Iavicoli, 2002). In this case, chronic bronchitis and asthma-like disorder and the accelerated decline of lung functions can occur together with other serious pathologies like cancer as well. However, there is a lack of epidemiological studies showing the relation between exposure and health effects, probably due to the fact that in the workplace, the risk assessment of mycotoxins has never been done routinely. In fact, while mycotoxin exposure via food intake is largely documented in the literature, the occupational exposure to these toxic compounds has been much less evaluated so far, despite its high frequency. Probably, this trend is due both to the fact that mycotoxins are not recognized as real and common occupational risk factor in specific settings (Viegas,
7
2018a) and to the difficulty to recruit volunteers prone in providing biological fluids.
Due to their severe toxicological implications, exposure to mycotoxins must be characterized by an accurate evaluation. Commonly, two different approaches can be followed for targeting this issue: via dietary exposure assessment and/or via biological monitoring. In both cases, a considerable number of uncertainties is present because of the lack of representativity in assessing the intake via food and the peculiar characteristics of toxicokinetics and toxicodynamics associated to the intake of the parent mycotoxins and the formation in vivo of the corresponding biomarker of exposure in the case of biomonitoring studies.
The dietary risk assessment is classically performed combining contamination data with consumption rates. The scenario that can be outlined, taking into consideration lower (LB) and upper (UB) boundaries of the contamination values, has multiple uncertainty sources such as the paucity of occurrence data available, censored dataset and their use, consumption rates not always updated and fit for purpose. Moreover, one other important source of uncertainty is associated to the variability coming from the sampling procedures carried out during the implementation of monitoring studies for data collection. This sampling drawback is of upmost importance since mycotoxins are characterized by an uneven distribution in the commodity lots, both in raw and in some processed commodities, too. In all cases, the uncertainty associated with the sampling step is much higher than the one associated with the analytical step.
8
Therefore, in consideration of the relevant problems associated with the sampling step, with the aim to get more direct information of the intake of single or multiple mycotoxins, the use of biomonitoring studies deserves a noteworthy mentioning. While in the risk-based control programs, the classic deterministic method to estimate dietary exposure is accepted, in specific cases the biomonitoring studies, leading to the measurement of biomarkers of exposure, may represent a complementary method to directly confirm an exposure event or to substantiate the relevance or applicability of results derived from classical studies (Kroes, 2002). Moreover, researches on mycotoxins in biological fluids greatly contribute to clarify the mechanism of health impairment attributable to these toxic compounds and to elucidate the dose–response relationship (Miraglia, 1996).
The use of biomarkers is a tool that is still being explored in the mycotoxin field but is gaining more and more reliability for the most important mycotoxins in different population groups. Biomarkers represent a measure of the overall exposure and they are unable to discriminate between different sources of exposure (i.e. food or airborne) (Aitio, 1999) and in some cases this may represent a limit or a constrain to be taken into account. Biomarkers represent a parallel approach to the classic estimates of exposure based on food consumption and concentration levels, having the advantages of measuring exposure over time, estimating exposure directly (not relying on models and uncertainty assumptions) and assessing individual estimates (especially useful for specific subpopulations e.g. vegetarians, celiac patients).
9
2.2. Aflatoxins
On the basis of their potent toxic effects aflatoxins, in particular aflatoxin B1 (AFB1)
[CAS number: 1162-65-8], are historically the main toxins of concern since their characterization in 1958. These toxins are mainly produced by Aspergillus flavus and Aspergillus parasiticus, particularly in hot and humid areas, together with
Aspergillus nomius and Aspergillus pseudotamarii (Ito, 2001; Kurtzman, 1987).
Moisture higher than 85% and temperatures above 25°C are favorable conditions to the growth of aflatoxin producing fungi during storage (Diener, 1969). Aflatoxin B-hydroxilated metabolites, aflatoxins M1 and M2 [CAS number: 6885-57-0], are
two toxins occurring in milk and derived products, as an effect of the fast metabolism of aflatoxins B1 and B2 (AFB2).
2.2.1. Physical and chemical properties
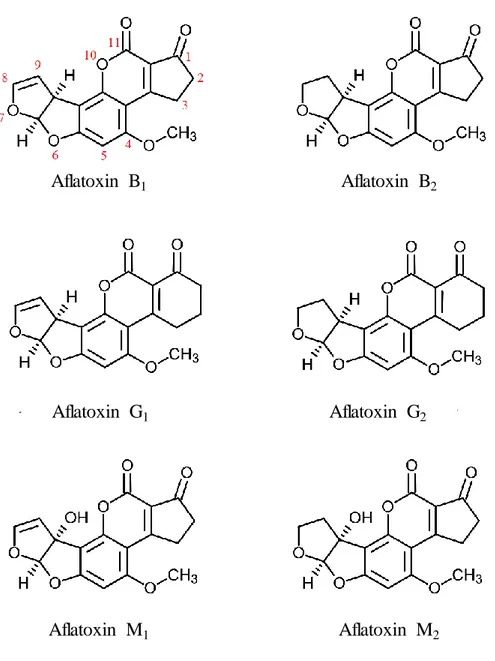
Aflatoxins (Figure 1) are substances that are chemically related to difuranocoumarin and classified in two broad groups according to their chemical structure; the difurocoumarocyclopentenone series, or B series, including AFB1 and
AFB2 [CAS number: 7220-81-7], and the difurocoumarolactone series, or G series,
including aflatoxin G1 (AFG1) [CAS number: 1165-39-5], aflatoxin G2 (AFG2)
[CAS number: 7241-98-7] and aflatoxin M1 (AFM1) [CAS number: 6795-23-9].
The G series contains a D-lactone ring, while the B series contains a cyclopentenone ring, which is responsible for the major toxicity of the B series. The aflatoxins fluoresce strongly in UV light (ca. 365 nm), the B series produces a blue
10
fluorescence whereas the G series produces green fluorescence. Aflatoxins are crystalline substances, insoluble in non-polar solvents, slightly soluble in water (10–20 µg/mL) and freely soluble in moderately polar organic solvents (e.g. chloroform, methanol), especially in dimethyl sulfoxide (Cole, 1981; O’Neil, 2001). Aflatoxins in dry state are very stable to heat up to their melting point. Pure aflatoxins are unstable to UV light in the presence of oxygen. Unstable to extremes of pH (< 3 or > 10). Unstable in the presence of oxidizing agents (Castegnaro, 1980, 1991). Under alkaline conditions, the lactone ring opens and the aflatoxins are apparently absent; however, the reaction is reversible upon acidification. Ammoniation, at high temperature and high pressure opens the lactone ring and results in decarboxylation, this reaction is not reversible.
11
Figure 1. Chemical structure of aflatoxins.
Aflatoxin B1 Aflatoxin B2
Aflatoxin G1
Aflatoxin M1 Aflatoxin M2
12 2.2.2. Toxicity and metabolism
Aflatoxins are characterized by acute and chronic toxic effects. The target organ is the liver, AFB1 is hepatotoxic, and several epidemiological studies related AFB1
assumption to cellular hepatocarcinoma (HCC) that is the major cause of death in many parts of the world. AFB1 is cancerogenic and genotoxic and is classified in
group 1 from the International Agency for Research on Cancer (IARC, 1993). Few cases of acute human poisoning were recorded, however there are known cases for animals, as Turkey X disease. Aflatoxicosis is characterized by hemorrhages, oedema, liver damage and can lead to death (IARC, 2012).
Aflatoxins metabolism has been extensively studied in animals and humans, this knowledge has provided the basis for development of biomarkers.
AFB1 absorption occurs mainly in the small intestine (Wilson, 1985). Its
permeability to the hepatocytes bring to accumulation in the liver, which is the principal organ for the xenobiotic transformation metabolism. Aflatoxins toxicity is activated by phase I of xenobiotic transformation metabolism. Among aflatoxins, AFB1 is characterized by stronger toxic effects because of highly efficient
metabolic activation with respect to the other forms.
AFB1 is activated by cytochromes P450. The major CYP enzymes involved in
human aflatoxin metabolism are CYP3A4 and 1A2. CYP3A4 is the predominant cytochrome in human liver and metabolizes AFB1 mainly to exo-8,9-epoxide with
much less efficient formation of AFQ1 which represents the detoxification product
13
considerable amount of endo-epoxide is formed, as well as the hydroxylated AFM1
(Gallagher, 1996; Ueng., 1995).
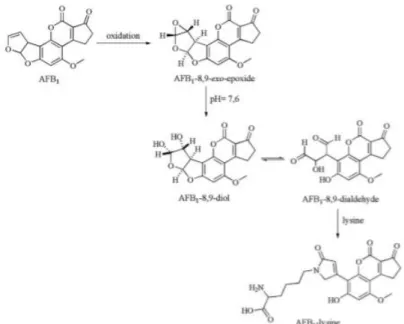
The exo-epoxide binds to DNA to form the predominant 8,9-dihydro-8-(N7 -guanyl)-9-hydroxy-AFB1 (AFB1–N7-Guanine) adduct that confers the mutagenic
properties to the compound. The positively charged imidazole ring of the AFB1-N7
-Guanine adduct promotes depurination and, consequently DNA damage (Wang, 1999). The AFB1-N7-Guanine can be found in urine in a 3-day period and represents
approximately the 0.2% of ingested AFB1. AFB1-N7-Guanine is a validated
biomarker of exposure for AFB1 (Groopman, 1985).
AFM1 is a poorer substrate for epoxidation and, consequently, is less mutagenic,
carcinogenic and toxic than AFB1. AFM1 is the major AFB1 metabolite excreted in
milk and urine (1.2 and 2.2% of dietary AFB1, respectively) and is a validated biomarker of recent exposure (Groopman, 1985).
The exo- and endo-epoxides in blood are hydrolyzed with non-enzymatic reaction to AFB1-8,9-dihydrodiol that form a dialdehyde phenolate ion.
Dialdehydes with a ring opening base-catalyzed reaction does not bind to DNA, but can form Schiff bases with primary amine groups for example with lysine, to form protein adducts such as aflatoxin–albumin (Wild, 2002). This adduct can be reduced by proteolysis at AFB1-Lysine that is a biomarker of a 3-4-weeks period exposure;
it was estimated that 1.4 – 2.3% of ingested AFB1 is covalently bound to albumin
14
Considering the metabolic pathway of aflatoxin B1, it was decided to determine
AFB1, AFM1 and AFB1-N7-Guanine adduct in urine and AFB1 and AFB1-Lysine
adduct in serum samples.
2.3. Ochratoxin A
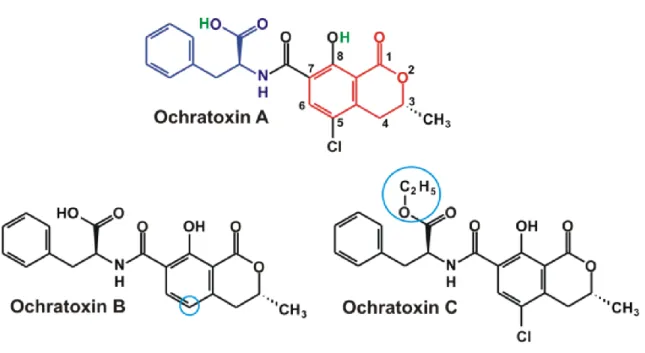
Ochratoxins A (OTA) [CAS number: 303-47-9], B and C (Figure 2) are compounds containing a phenylalanine moiety attached to a dihydroisocoumarin group via an amide bond. OTA, the toxin of most concern, also contains a chlorine atom on the aromatic ring, which accounts for its toxicity. Ochratoxins are produced by both
Aspergillus ochraceus and Penicillium viridicatum (among others), with OTA
being the most relevant toxin (Ciegler, 1973).
15
2.3.1. Physical and chemical properties
OTA is a white odorless crystalline solid (Pohland, 1982), intensely fluorescent in UV light, emitting green and blue fluorescence in acid and alkaline solutions, respectively, due to two different forms, i.e. closed or open lactone ring, respectively. The melting point is 59°C when recrystallized from benzene–hexane (Natori, 1970); 169°C when recrystallized from xylene (Van der Merwe et al., 1965a, 1965b); 168–173°C after drying for 1 hour at 60°C (Pohland, 1982). OTA shows specific rotation with [α]20D –118° (c = 1.1 mmol/L in chloroform) (Van der
Merwe, 1965a, 1965b); [α]21D –46.8° (c = 2.65 mmol/L in chloroform) (Pohland,
1982). As for the UV spectrum, at λmax of 214, 282, and 332 nm, extinction
coefficients of 37.2×10⁻³, 0.89×10⁻³, and 63.3×10⁻³ L×mol–1×cm–1, respectively, have been reported (Cole, 1981). OTA is moderately soluble in polar organic solvents (e.g. chloroform, ethanol, methanol) and is partially degraded under normal cooking conditions (Müller, 1983). The stability of OTA to heating conditions depends on the water activity of the medium (Subirade, 1996; Van der Stegen, 2001). The lactone ring opens under alkaline conditions, but the reaction is reversible. Solutions of OTA are completely degraded by treatment with an excess of sodium hypochlorite. Reaction in methanol and hydrochloric acid yields the OTA methyl ester, which can be used as a confirmatory reaction.
16 2.3.2. Toxicity and metabolism
The primary effect of OTA in all farm animals is nephrotoxicity. Fatty liver can occur in poultry. The most sensitive indicator of acute ochratoxicosis in chickens is the reduction in total serum proteins and albumin. A decrease in phosphoenolpyruvate carboxykinase in the kidney is a sensitive and specific indicator in pigs (Krogh, 1992; Marquardt, 1992).
The mechanism of action in farm animals is unclear. However, the structural similarity of OTA to phenylalanine and the fact that it inhibits many enzymes and processes that are dependent on phenylalanine, strongly suggest that OTA acts at least partially by disrupting phenylalanine metabolism (CAST, 2003; Riley, 2011).
In addition to inhibition of protein synthesis via binding to phenylalanine - tRNA synthetase, recent studies have demonstrated the ability of OTA to induce oxidative stress, reduce cellular defense, and alter signalling pathways involved in various aspects of cellular and mitotic regulation (Mally, 2009).
OTA is rapidly absorbed, the half-life in plasma depends on the extent of binding to plasma proteins. Published reviews have extensively summarized evidence on the absorption, distribution, metabolism, and mechanisms of action of OTA (IARC, 1993; Pfohl-Leszkowicz, 2007; Marin-Kuan, 2008; Mally, 2009).
Wide species differences have been reported in the serum half-life of OTA in vivo. In humans, the elimination of OTA follows a two-phase pattern, a fast excretion followed by a slow clearing, with a calculated plasma half-life of 35 days. Even infrequent exposure (consumption of contaminated food once a week or even once a month) can result in persistent blood levels of OTA (Studer-Rohr, 2000). Blood
17
samples from healthy people living in European countries show OTA levels in the range 0.1–40 ng/mL (WHO, 2008).
The parent molecule is the major compound found in blood, whereas ochratoxin α is the major component detected in urine (Studer-Rohr, 2000). OTA is absorbed from the gastrointestinal tract in mammals and becomes strongly bound to plasma proteins (predominantly albumin) in blood, whereby it is distributed to the kidneys, with lower concentrations in liver, muscle, and fat.
OTA is metabolized by several different CYP enzymes, depending on the species and tissue involved. In cells expressing human CYP enzymes, the main metabolite was 4(R)-hydroxy- OTA formed by CYP1A2, 2B6, 2C9, 2D6, and 2A6, whereas the 4(S)- hydroxy-OTA derivative was formed by only CYP2D6 and 2B6 (Pfohl- Leszkowicz, 2007).
Identified OTA metabolites include not only these two hydroxylated species but also 10-hydroxy-OTA and ochratoxin α, which is formed by hydrolysis of the peptide bond in OTA, the elimination of the phenylalanine moiety accounts for its non- toxicity.
The kidney is the major target organ for adverse acute effects of OTA (Pfohl- Leszkowicz, 2007; WHO, 2002). Short-term toxicity studies in mice, rats, dogs, and pigs have shown both time- and dose-dependent development of progressive nephropathy. Significant sex and species differences exist, as well as differences due to route of administration.
Other toxic effects include cardiac and hepatic lesions in rats, lesions of the gastrointestinal tract and lymphoid tissues in hamsters, myelotoxicity in mice, and
18
kidney lesions in chickens. Pigs appear to be the most sensitive species to the nephrotoxic effects; the lowest- observed-effect level (8 µg/kg bw) was used as the basis for establishing the Tolerable Weekly Intake (TWI) which was set by EFSA at 120 ng/kg bw (EFSA, 2006).
Due to the OTA strong interaction with serum albumin (yield>99%) (Chu, 1974), the presence of OTA itself in serum samples can be considered as a biomarker of exposure.
19
2.4. State of the art
Mycotoxins biomonitoring studies are mainly performed by LC-MS/MS, this approach allows to reach accuracy, selectivity and low LOD/LOQ values suitable for biological fluid analysis where mycotoxins content is quite low when compared to food and feed concentration levels (Capriotti, 2012; Warth, 2013). Recently, high resolution mass spectrometry (HRMS) methods for mycotoxins determination in biological fluids were also published.
In this study an Orbitrap Q-Exactive was used, this HRMS drives high resolution and accurate mass data, generating high resolution measurements of up to 500000 FWHM. When the instrument generates full-scan HRMS data during untargeted analysis, identification of novel compounds and retrospective data analysis are accomplished without the need to re-run samples. During targeted analysis scans, the instrument achieves confirmation and identification of residual small and large molecules (Righetti, 2016).
A research in the literature of methods on mycotoxin determination by LC-HRMS in biological fluids was performed before starting the methods set up for this project.
The first published method was the quantitative determination of zearalenone and its major metabolites in chicken and pig plasma samples (De Baere, 2012), followed by the study of Rubert et al. (2014) reporting a multi-mycotoxins method in milk also including AFB1 and OTA determination. Slobodchikova and Vuckovic (2018)
published a high resolution mass spectrometry method for monitoring 17 mycotoxins in human plasma including AFB1, for which a LOD of 40 pg/mLserum
20
was reported, and OTA, for which the obtained recovery factor was not acceptable and the toxin excluded from the quantitative determination. The recent work of McMillan et al. (2018) reports the determination of the AFB1-Lysine adduct in
serum samples of Nigerian children. None of the previous work is able to determine the needed mycotoxins/matrix combination, in addition the published methods report LOD/LOQ not fitting with the requirements set for this biomonitoring study. Regarding the sample preparation, for urine and serum purification and concentration different approaches are reported starting with light treatment and sample manipulation such as liquid-liquid extraction (LLE) (Meucci, 2005; Palli, 1999; Slobodchikova, 2018) that may be followed by further treatments such as QuEChERS (SLLE) (De Santis, 2017), or the employment of SPE cartidges (Brezina, 2014; Jager, 2016; McCoy, 2005). Also the use of mycotoxin specific immunoaffinity column (IAC), that allows to reach high selectivity and sensitivity but only on a very limited number of analytes, is reported (Ahn, 2010; Breitholtz, 1991; Dinis, 2007; Petkova-Bocharova, 2003; Sabbioni, 1990; Solfrizzo, 2011; Wild, 1992). Dilute&shoot approach may be conveniently applied for urine, providing that the LOD/LOQ requirements are fulfilled, but is not suitable for serum determination due to the matrix complexity (Gerding, 2015).
21
2.5. Aim of the work
The presented study was performed in the framework of the EFSA project “Biomonitoring data as a tool for assessing aflatoxin B1 exposure of workers – BIODAF” and aims to explore the validity of the biomonitoring studies as a tool to investigate the intake of mycotoxins in population groups, such as workers operating in risky workplaces, being potentially exposed to mycotoxins through the inhalation of contaminated dust and/or by dermal contact.
The objective is to produce a more accurate exposure and risk assessment of these population groups, by considering the fraction derived from the workplace environment by inhalation of dusts and/or dermal contact. The use of biomarker approach allows determining the possible contribution to the overall exposure due to potential professional exposure by enrolling for the study a group of professionally exposed workers as well as a control group composed of not exposed volunteers. The study also intends to contribute to obtain a more comprehensive and updated dataset on which management actions, aimed at minimizing the risk and improving the workplace conditions and workers’ health, should be generated. In particular, this study was conducted on two groups of population, the exposed workers groups, that includes staffs working in an Italian feed plant, and a control group composed by administrative employees (non-exposed) working on the same plant. Urine and serum samples were collected for the determination of mycotoxins, AFB1, AFM1 and AFB1-N7-Guanine adduct were analyzed in urine samples, while
22
The analytical determination of mycotoxins and their metabolites should be based on validated method with performance characteristics fitting for the purpose of biomonitoring. Therefore, the study also includes the set up and validation of suitable methods for the determination of the selected analytes in specimens. In particular, for urine analysis two methods were optimized and validated, a dilute&shoot method and an immunoaffinity clean-up method; for serum analysis a method based on liquid-liquid extraction and QuEChERS purification was developed and fully validated.
Moreover, due to the unavailability of commercial standard of AFB1-N7-Gaunine
and AFB1-Lysisne, the adducts were synthetized. Unfortunately, it was not possible
to purify the synthesis products and to determine their concentrations; however, the obtained adducts were used for methods set up and for qualitative analysis (presence/absence) in the collected samples.
The synthesis of AFB1-N7-Guanine and the validation of the dilute&shoot method
for AFB1, AFM1 and AFB1-N7-Guanine analysis were included in the conclusive
thesis of dr Gianmarco Mazzilli (AA 2016/2017), while the synthesis of AFB1
-Lysine adduct and the development and validation of the serum method were included in the conclusive thesis of dr Elisa Sonego (AA 2017/2018). As supervisor of dr Mazzilli and dr Sonego thesis I wish to thank them for the valuable work performed and the results obtained as well as for the contribution to this broader work.
23
3. MATERIALS AND METHODS
3.1. Samples
The investigation was conducted in a large feedstuff plant located in Northern Italy (Reggio Emilia), producing every year about 540000 metric tons of feedstuffs (e.g., flour, compost and pellet), nearly 100000 metric tons derived from maize.
The study was conducted under the supervision of the Local Health Unit of Reggio Emilia and was approved by the Ethical Committee of the Reggio Emilia Province. The plant management of the company agreed to participate according to the criteria and principles set by Italian legislation on workers’ health and safety and the study on human samples was also agreed with trade union representatives and the competent medical team. The workers were informed about the purpose of the study through a public meeting. During the meeting, formal consent for participation was individually requested and signed.
Two groups of volunteers were selected, the exposed group corresponding to all workers in direct contact with some risky activities such as the downloading of the raw material, its handling and the cleaning procedures, and the control group corresponding to people working in the same company but, designated to perform other activities to be considered not risky for the absence of contaminated environmental dusts.
The collection of human urine and serum samples was carried out on the work site by a physician and a nurse. The urine of exposed workers was collected in the morning and delivered to the medical staff before starting the morning shift. At that time, a blood sample was taken. A total of 61 male volunteers were enrolled. Blood
24
and urine samples were collected on Monday and Friday morning of the same working week from 32 exposed workers (employees working in dusty plant areas) and 29 non-exposed workers (employees with administrative duties working far from the dusty areas) as control group. Monday was chosen since it reflects a situation characterized by a preceding two-days washing period and Friday was selected with the aim to verify the possible accumulation of mycotoxins intake over the week of sampling. Blood samples were collected in 10 mL cryogenic tubes and immediately transported in refrigerated boxes at 0°C to the analytical laboratory. Urine samples were collected using sterile tubes (VACUETTE® Urine System, 10 mL, Greiner Bio-One Gmbh, 4550 Kremsmüster, Austria). Serum and urine samples were stored at -20°C until analysis.
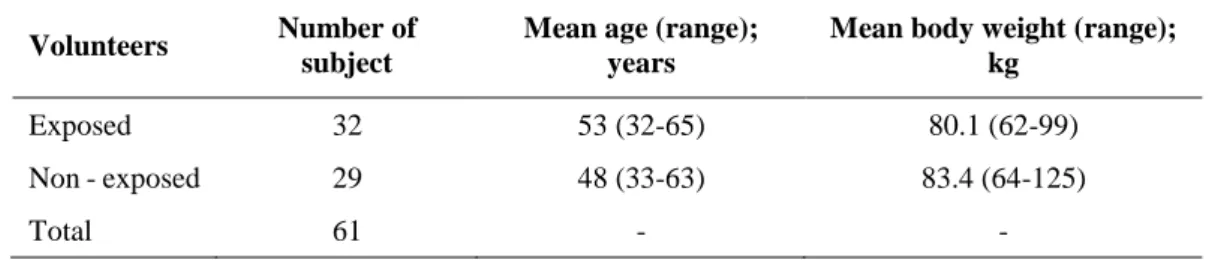
The mean value and range for age and body weight of the enrolled volunteers are reported in Table 1.
Table 1. Distribution of enrolled volunteers by group, age and body weight.
Volunteers Number of
subject
Mean age (range); years
Mean body weight (range); kg
Exposed 32 53 (32-65) 80.1 (62-99)
Non - exposed 29 48 (33-63) 83.4 (64-125)
25 3.2. Analytical method
3.2.1. Apparatus
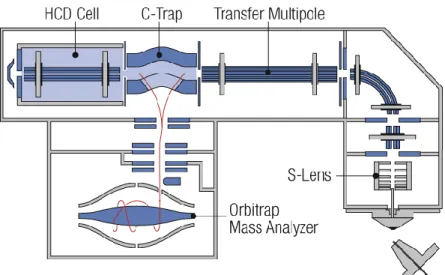
Beside the ordinary laboratory equipment, for the analytical determination a UHPLC-HRMS system was used. The analytes were separated with Ultra High Performance Liquid Chromatography (UHPLC) (Thermo ScientificTM Dionex UltimateTM 3000; (©2016 Thermo Fisher Scientific Inc.). The UHPLC is interfaced with a High Resolution Mass Spectrometer (Orbitrap™ Q-Exactive™; ©2016
Thermo Fisher Scientific Inc).
The scheme of the Q-Exactive is reported in Figure 3.
26 The Q-Exactive consists of 5 main components:
Ion source (HESI II)
Injection flatapole with mass resolving capabilities Quadrupole mass filter for precursor ion selection
Intermediate storage device (C-Trap) for short pulse injection
Collision cell for performing HCD (Higher Energy Collisional Dissociation) experiments
Orbitrap analyzer for Fourier transform mass analysis
Sample is introduced into HESI II probe from the UHPLC system. The HESI II probe transforms ions in solution into ions in the gas phase by using electrospray ionization (ESI) in combination with heated auxiliary gas.
The ions are transferred into the C-Trap through four stages of differential pumping. The injection flatapole transmits ions from the source to the quadrupole, the injection flatapole also performs coarse pre-filtering of ions according to their m/z ratios. In the C-Trap, the ions are accumulated and their energy is dampened with a bath gas (N2). The ions are then injected through three further stages of differential
pumping by a lens system (Z-lens) into the Orbitrap analyzer where mass spectra are acquired by image current detection. The vacuum inside the Orbitrap analyzer is maintained below 1E-9 mbar. Ions are passed through the C-Trap into the HCD cell. The HCD cell adds a Higher Energy Collision Induced Dissociation capability to the instrument, this allows performing all-ion fragmentation (AIF) experiments.
27
After the ions have been fragmented in the HCD cell, the HCD cell voltages are ramped up and the ions are transferred back into the C-Trap from where they are injected into the Orbitrap analyzer for detection.
3.2.2. Chemicals and reagents
Chemicals and solvents used for sample preparation were ‘pro-analysis’ quality or better. LC-MS grade solvents, including water, methanol, acetonitrile (ACN) and formic acid (FA) were purchased from Fisher Scientific (Milano, Italy). The following reagents were purchased from Sigma-Aldrich (Darmstadt, Germany): ammonium formate, meta-chloroperoxybenzoic acid, protease from Streptomyces
griseus, type XIV ≥3,5 units/mg, guanine (purity ≥98%), L-lysine (purity ≥98%).
QuEChERS were from Waters (DisQuE, Waters, Milford, MA, USA).
The analytical reference standards of AFM1 and OTA were purchased as stock
solutions (0.5 and 10 µg/mL in ACN for AFB1 and OTA respectively) from Biopure
(Tulln, Austria). The internal standards U-[13C17]- AFB1 (99.3% 13C), U-[13C17
]-AFM1 (98.3% 13C) and U-[13C20]-OTA (99.2% 13C) were also purchased as ACN
solution (0.5 µg/mL AFB1 and AFM1, 10 µg/mL OTA) (Biopure). Crystalline
powder of AFB1 from Aspergillus flavus (purity ≥98%) were purchased from
28
3.2.3. AFB1-N7-Guanine adduct synthesis
The AFB1-N7-Guanine adduct was synthetized since it was not commercially
available at the moment of the study. The synthesis was made accordingly with Vidyasagar et al. (Vidyasagar, 1997) as follows: meta-chloroperoxybenzoic acid (MCPBA), 20 mg in 4 mL of dichloromethane, was washed with 100 mM phosphate buffer, pH 7.4 (4 mL x 4). The resulting MCPBA solution was passed through anhydrous sodium sulphate to remove residual water.
AFB1 (0.64 µmoles) was dissolved in 250 µL of dichloromethane and was
converted to AFB1-8,9-epoxide (Figure 4) by addition of 250 µL of the above
MCPBA solution (4 µmoles) and 500 µL of 100 mM phosphate buffer, pH 7.2. The reaction was carried out at 5°C for 100 min with continuous vigorous stirring. At the end of 100 min the buffer fraction was pipetted out.
Figure 4. Electrophilic addition of oxygen to the double bond.
Guanine dissolved in 0.1 N HCl (0.32 µmoles) was taken in 500 µL of 100 mM phosphate buffer, pH 7.4 (maximum solubility of guanine in phosphate buffer was
29
found to be 140 µg/mL). The buffer with guanine was added to the tube containing AFB1-8,9-epoxide in dichloromethane and the reaction was continued for 60 min
at 5°C with continuous vigorous stirring. At the end of 60 min the reaction mixture was centrifuged at 4000 rpm for 5 min. The organic phase was separated and the buffer fraction was repeatedly washed with dichloromethane (500 µL x 3 times). Both the aqueous and organic phases were checked for the presence of AFB1-N7
-Guanine adduct by UHPLC-HRMS (for experimental conditions see section 3.2.5.2). Chromatograms and spectra obtained for AFB1-N7-Guanine are reported
in Figures 5 and 6, respectively. Due to the difficulties in assessing the concentration level of the synthetized adduct, it was used only for a qualitative evaluation of presence/absence in the collected urine samples.
30
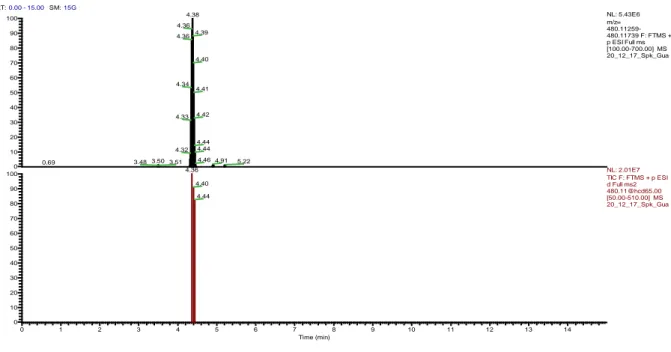
Figure 5. Extracted ion chromatogram for AFB1-N7-Guanine ([M+H]+, m/ztheo = 480.11499,
retention time 4.38 min).
Figure 6. Data dependent mass spectrum (dd-MS2) of AFB
1-N7-Guanine. RT:0.00 - 15.00 SM:15G 0 1 2 3 4 5 6 7 8 9 10 11 12 13 14 Time (min) 0 10 20 30 40 50 60 70 80 90 100 0 10 20 30 40 50 60 70 80 90 100 R e la tive A b u n d a n ce 4.38 4.36 4.39 4.36 4.40 4.34 4.41 4.42 4.33 4.44 4.44 4.32 4.46 4.91 3.503.51 5.22 3.48 0.69 4.36 4.40 4.44 NL: 5.43E6 m/z= 480.11259-480.11739 F: FTMS + p ESI Full ms [100.00-700.00] MS 20_12_17_Spk_Gua NL: 2.01E7 TIC F: FTMS + p ESI d Full ms2 [email protected] [50.00-510.00] MS 20_12_17_Spk_Gua
20_12_17_Spk_Gua #970-1005RT:4.36-4.44AV:3NL:2.65E5 F:FTMS + p ESI d Full ms2 [email protected] [50.00-510.00] 138 140 142 144 146 148 150 152 154 156 158 160 162 164 166 168 170 m/z 0 5 10 15 20 25 30 35 40 45 50 55 60 65 70 75 80 85 90 95 100 R e la ti ve A b u n d a n ce 152.05678 165.05499 153.04090 161.05988 147.04430 167.07074 137.05996 145.06485 149.73211 141.07021 166.05828 159.08087 157.06487 143.08524 151.03951 142.07785 144.08100 155.06039 146.06031 164.49245 148.04798 169.07720 160.07551 168.08078 162.09086 154.02666
31 3.2.4. AFB1-Lysine adduct synthesis
The AFB1-Lysine adduct was synthetized since it was not commercially available
at the moment of the study. The synthesis was made accordingly with the procedures available in the literature and described by Sass et al. (Sass, 2014). The synthesis of the AFB1-Lysine started by the preparation of AFB1-8,9-epoxide as
summarized in Figure 7.
32
The MCPBA (16 mg, 51 µmoles) was dissolved in 1 mL of dichloromethane and washed four times with phosphate buffered saline pH 7.4 (4 x 1 mL). The aqueous phase was removed and 0.8 mL of phosphate buffer (0.1 M, pH 7.6) was added to the organic phase.
The mixture was cooled to 0°C, and 2 mg of AFB1 (6 µmoles) dissolved in 1 mL
of dichloromethane was added. The reaction remained under agitation for 6 hours at 0°C. The aqueous phase was pipetted off, and the organic phase was dissolved in 1 mL of dichloromethane and washed with 0.5 M sodium thiosulfate (3 x 1 mL). Dichloromethane was removed by evaporation in a stream of nitrogen (Baertschi, 1988; Raney, 1992). Due to the instability of AFB1-epoxide, the reaction mixture
containing the AFB1-8,9-exo/endo-epoxide was submitted to reaction with 0.8 mL
of phosphate buffer (0.1 M, pH 7.6) to form the AFB1-dialdehyde in equilibrium
with AFB1-diol, which are more stable than the corresponding AFB1-epoxide
(Scholl, 2008). After 20 min of stirring, the solution was washed with dichloromethane (3 x 0.8 mL) to remove the unreacted AFB1. Afterwards, L-lysine
(5 mg) previously dissolved in 0.4 mL phosphate buffer (0.1 M, pH 7.6) was added in the aqueous phase containing the products AFB1-dialdehyde and AFB1-diol
(approximately 1 mg in total). The reaction remained under stirring for 24 hours to form the product AFB1-Lysine. Chromatograms and spectra obtained for AFB1
-Lysine are reported in Figures 8 and 9, respectively. For experimental conditions, see section 3.2.6.2. Due to the difficulties in assessing the concentration level of the synthetized adduct, it was used only for a qualitative evaluation of presence/absence in the collected serum samples.
33
Figure 8. Extracted ion chromatogram for AFB1-Lysine ([M+H]+, m/ztheo = 457.16054, retention
time 4.84 min).
Figure 9. Data dependent mass spectrum (dd-MS2) of AFB
1-Lysine. RT:0.00 - 15.00 SM:15G 0 1 2 3 4 5 6 7 8 9 10 11 12 13 14 Time (min) 0 10 20 30 40 50 60 70 80 90 100 0 10 20 30 40 50 60 70 80 90 100 R el at ive A bu nd an ce 4.84 4.83 4.82 4.85 4.81 4.87 4.79 4.78 4.77 4.88 4.75 4.32 4.22 4.89 4.19 3.98 4.90 3.95 4.92 3.79 4.96 3.76 0.87 5.42 4.82 4.79 4.86 4.75 4.90 4.39 4.35 4.94 4.31 5.01 4.28 5.06 4.24 4.20 4.03 3.95 3.84 NL: 8.96E6 m/z= 457.15825-457.16283 F: FTMS + p ESI Full ms [100.0000-700.0000] MS 11mag18_AFB1-Lys_ACN NL: 2.93E6 TIC F: FTMS + p ESI d Full ms2 [email protected] [50.0000-485.0000] MS 11mag18_AFB1-Lys_ACN
11mag18_AFB1-Lys_ACN #1061-1140 RT:4.75-5.06 AV:8NL:3.62E5 F:FTMS + p ESI d Full ms2 [email protected] [50.0000-485.0000] 310 320 330 340 350 360 370 380 390 400 410 420 m/z 0 5 10 15 20 25 30 35 40 45 50 55 60 65 70 75 80 85 90 95 100 R el at ive A bu nd an ce 394.12782 376.11752 328.08112 311.05429 348.12253 378.13361 366.13335 404.11234 323.09514 314.06395 337.09349 350.13859 396.13349 359.08843 380.10985 331.04428 346.10084 411.36385
34
3.2.5. Urine
3.2.5.1. Sample preparation
Dilute&Shoot
Urine samples were allowed to reach room temperature, a volume of 100 µL was mixed with 860 µL of H2O LC-MS grade, for quantification purpose 20 µL of
U-[13C
17]-AFB1 5 ng/mL in ACN and 20 µL of U-[13C17]-AFM1 10 ng/mL in ACN
were added to the sample. The diluted sample was centrifuged for 10 minutes at 10000 rpm before the injection of 10 µL into the UHPLC-HRMS system.
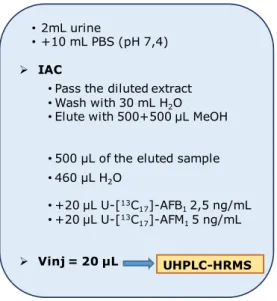
Immunoaffinity column clean-up
Urine samples were allowed to reach room temperature. Two mL of urine sample were mixed with 10 mL of phosphate buffered solution (PBS, pH=7.4) and applied to an IAC containing antibodies specific to AFB1 and AFM1 and tested for
cross-reactivity with AFB1-N7-Guanine adduct (Easy-extract aflatoxins; R-Biopharm,
Darmstadt, Germany). The IAC was washed with 30 mL of H2O (10+10+10 mL),
then the toxins were eluted with 1 mL of MeOH (500+500 µL). Five hundred µL of eluted sample were added with 20 µL U-[13C17]-AFB1 2.5 ng/mL in ACN, 20 µL
U-[13C17]-AFM1 5 ng/mL in ACN and 460 µL of H2O. Twenty µL of the sample
were injected into the UHPLC-HRMS system. In Figure 10, the scheme of the sample preparation is reported.
35
Figure 10. Scheme of the sample preparation for AFB1, AFM1 and AFB1-N7-Guanine analysis in
urine with IAC clean-up method.
3.2.5.2. LC-HRMS analysis
Determination was performed by UHPLC-HRMS. Chromatographic separation was performed using UHPLC Dionex UltiMate 3000 (Thermo Scientific, San Jose, CA, USA) with Waters RP column Acquity BEH C18 (1.7 µm, 100 × 2.1 mm, Milford, MA, USA). The flow rate of 0.3 mL/min and the column temperature of 40° C were used for all analytes. The mobile phases A and B were water and methanol containing 0.002% formic acid and 2 mM ammonium formate. The following step gradient was used: 20% B increase to 99% in 10 min, keep isocratic at 99% B for 4 min, from 14 to 14.6 min return to 80% B, and finally re-equilibrate the column at 20% B for 2.4 min. The injection volume was set at 10 µL for dilute&shoot method and 20 µL for IAC method. High-resolution MS (HRMS) analysis was performed using Q-Exactive Orbitrap equipped with HESI source (Thermo Scientific, San Jose, CA, USA). The following ESI (+) parameters were
• 2mL urine
• +10 mL PBS (pH 7,4)
IAC
• Pass the diluted extract
• Wash with 30 mL H2O
• Elute with 500+500 µL MeOH • 500 µL of the eluted sample
• 460 µL H2O • +20 µL U-[13C 17]-AFB12,5 ng/mL • +20 µL U-[13C 17]-AFM15 ng/mL Vinj = 20 µL UHPLC-HRMS
36
used: source voltage 3.5 kV, in-source CID 18 eV, NCE 50, capillary temperature 320°C, auxiliary gas heater temperature 350° C, sheath gas flow 40, S-lens RF level 75 and auxiliary gas flow 14. The MS acquisition was performed in Full Scan/Data Dependent (full MS/dd-MS2) for confirmatory purpose. In this acquisition mode the Q-Exactive Orbitrap automatically switch between full scan (mass range 100-700 m/z; automatic gain control target 1 × 10⁶ ions, and resolution of 70.000) and MS/MS acquisition, performing data-dependent scans. Precursor ions, selected by the quadrupole, are sent to the HCD collision cell; here they are fragmented to obtain ion spectra. At this stage resolution was set at 17.500 and automatic gain control target 2 × 10⁵ ions. Normalized collision energy (NCE) was set at 25 and 27 for AFB1 and AFM1 respectively and at 40 and 90 for AFB1-N7-Guanine adduct.
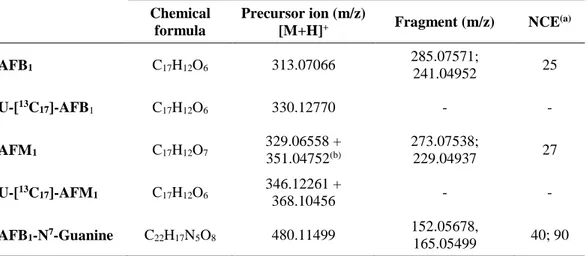
Precursor ion, fragments and collision energy (CE) used for the determination of the selected mycotoxins are reported in Table 2.
Table 2. Precursor ion, fragments and collision energy used for the determination of the selected
mycotoxins in urine samples.
Chemical formula
Precursor ion (m/z)
[M+H]+ Fragment (m/z) NCE(a)
AFB1 C17H12O6 313.07066 285.07571; 241.04952 25 U-[13C17]-AFB 1 C17H12O6 330.12770 - - AFM1 C17H12O7 329.06558 + 351.04752(b) 273.07538; 229.04937 27 U-[13C 17]-AFM1 C17H12O6 346.12261 + 368.10456 - - AFB1-N7-Guanine C22H17N5O8 480.11499 152.05678, 165.05499 40; 90 (a) NCE: Normalized Collision Energy
37
All analytical batches included analysis of appropriate extracts and solvent blanks, solvent calibration curves at the beginning and end of the analytical batch, and injection of a calibration level every 10 sample injections to ensure LC–MS stability throughout the run. For data acquisition and processing, Xcalibur software 4.0.27.19 was used. Mycotoxins were quantitated using the precursor ion which was extracted with ±5 ppm window. For AFM1 the sum of the molecular ion and
the [AFM1+Na]+ signals was considered.
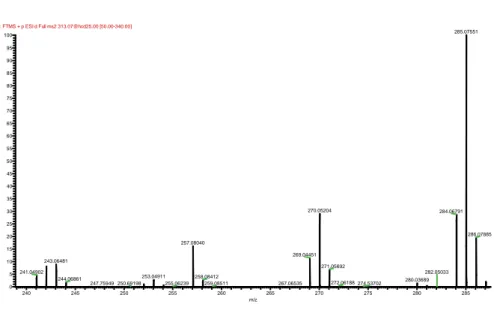
The extracted ion chromatograms and dd-MS2 TIC obtained by the injection of the highest calibration solution are reported in Figure 11. The data dependent spectra of AFB1 and AFM1 are reported in Figure 12 and 13, respectively. The extracted
ion chromatograms of a urine sample naturally contaminated with AFM1 is reported
38
Figure 11. Extracted chromatograms obtained by the injection of the highest calibration solution.
From the top AFB1 peak followed by dd-MS2 TIC of AFB1 fragments, AFM1 peak followed by
dd-MS2 TIC of AFM
1 fragments, the extracted ion chromatograms for U-[13C17]-AFB1 and
U-[13C
17]-AFM1, respectively.
Figure 12. Data dependent mass spectrum (dd-MS2) of AFB
1. RT:0.00 - 15.00SM:15G 0 1 2 3 4 5 6 7 8 9 10 11 12 13 14 Time (min) 0 50 100 0 50 100 0 50 100 0 50 100 R e la ti ve A b u n d a n ce 0 50 100 0 50 100 6.286.306.31 6.32 6.26 6.33 6.35 6.25 8.859.30 10.46 3.65 6.71 0.47 7.35 6.27 6.30 5.385.39 5.37 5.40 5.36 5.41 5.35 5.43 5.34 8.57 8.56 5.45 6.30 8.55 8.58 5.44 5.40 5.36 6.29 6.30 6.28 6.31 6.32 6.26 6.33 6.25 6.35 5.38 5.37 5.39 5.36 5.40 5.35 5.41 5.34 5.43 5.33 NL: 1.30E6 m/z= 313.06753-313.07379 F: FTMS + p ESI Full ms [100.00-700.00] MS 14_12_17_L6_2 NL: 5.58E5
TIC F: FTMS + p ESI d Full ms2 [email protected] [50.00-340.00] MS 14_12_17_L6_2 NL: 8.35E5 m/z= 329.06229-329.06887+ 351.04401-351.05103 F: FTMS + p ESI Full ms [100.00-700.00] MS 14_12_17_L6_2 NL: 1.38E7
TIC F: FTMS + p ESI d Full ms2 [email protected] [50.00-355.00] MS 14_12_17_L6_2 NL: 1.66E6 m/z= 330.12440-330.13100 F: FTMS + p ESI Full ms [100.00-700.00] MS 14_12_17_L6_2 NL: 9.03E5 m/z= 346.11915-346.12607+ 368.10088-368.10824 F: FTMS + p ESI Full ms [100.00-700.00] MS 14_12_17_L6_2 12_12_17_L6 #1352-1469RT:6.04-6.53AV:14NL:1.34E7 F:FTMS + p ESI d Full ms2 [email protected] [50.00-340.00] 240 245 250 255 260 265 270 275 280 285 m/z 0 5 10 15 20 25 30 35 40 45 50 55 60 65 70 75 80 85 90 95 100 R e la ti ve A b u n d a n ce 285.07551 284.06791 270.05204 286.07885 257.08040 269.04451 243.06481 271.05692 241.04902 253.04911 258.08412 244.06861 272.06188 280.03689 259.08511 255.06239 282.05033 267.06535 274.53702 250.69198 247.75949
39
Figure 13. Data dependent mass spectrum (dd-MS2) of AFM
1.
Figure 14. Extracted chromatograms obtained by the injection of a urine sample naturally
contaminated with AFM1. From the top the extracted ion chromatograms of AFB1, AFM1,
U-[13C
17]-AFB1 and U-[13C17]-AFM1, respectively.
12_12_17_L6 #1193-1220RT:5.37-5.44AV:3NL:8.50E4 F:FTMS + p ESI d Full ms2 [email protected] [50.00-355.00] 230 232 234 236 238 240 242 244 246 248 250 252 254 256 258 260 262 264 266 268 270 272 274 m/z 0 5 10 15 20 25 30 35 40 45 50 55 60 65 70 75 80 85 90 95 100 R e la ti ve A b u n d a n ce 273.07578 259.06013 274.07950 257.08064 260.06364 255.11990 229.04961 239.43586 266.04563 RT:0.00 - 15.00SM:15G 0 1 2 3 4 5 6 7 8 9 10 11 12 13 14 Time (min) 0 20 40 60 80 100 0 20 40 60 80 100 0 20 40 60 80 100 R e la ti ve A b u n d a n ce 0 20 40 60 80 100 1.661.66 1.641.68 1.68 1.63 1.63 2.55 2.56 2.53 2.58 2.52 1.61 1.291.02 2.20 2.60 3.67 3.654.22 5.555.57 5.58 6.38 8.508.90 9.609.90 0.32 7.027.247.91 10.2411.08 12.25 13.0413.7314.1714.45 1.64 1.65 1.631.66 1.63 5.28 5.28 1.68 5.27 5.29 1.61 1.68 5.30 1.60 5.25 5.32 1.70 1.59 0.86 5.23 0.84 3.45 1.71 3.44 1.58 3.43 4.10 5.34 8.57 0.75 2.45 5.21 6.30 6.30 6.28 6.31 6.27 6.32 6.26 6.33 1.671.64 6.25 1.63 1.03 6.35 0.93 0.93 0.94 5.39 0.91 5.38 5.39 5.41 0.89 0.96 5.37 5.41 0.88 5.36 0.96 5.43 1.59 1.60 0.87 1.55 1.64 2.892.92 2.91 3.57 4.63 5.34 5.45 6.71 NL: 1.80E6 m/z= 313.06753-313.07379 F: FTMS + p ESI Full ms [100.00-700.00] MS 13_12_17_219 NL: 2.76E6 m/z= 329.06229-329.06887+ 351.04401-351.05103 F: FTMS + p ESI Full ms [100.00-700.00] MS 13_12_17_219 NL: 1.27E6 m/z= 330.12440-330.13100 F: FTMS + p ESI Full ms [100.00-700.00] MS 13_12_17_219 NL: 1.99E6 m/z= 346.11915-346.12607+ 368.10088-368.10824 F: FTMS + p ESI Full ms [100.00-700.00] MS 13_12_17_219 AFB1 AFM1 U-[13C17]-AFB1 U-[13C17]-AFM1
40
3.2.5.3. Analytical quantification
For mycotoxins quantification an internal standard (ISTD) approach was adopted. The internal standard for AFB1 and AFM1 was the 13C isotope labelled molecule in
which all carbon atoms are substituted by the stable isotope 13C. The calibration curve was obtained by plotting the ratio (standard area/13C area) versus the concentration expressed in pg/mLurine. The calibration curve was obtained by fitting
the data with a linear regression model based on least squares method. ISTD was applied to the sample prior to extraction allowing to correct for extraction efficiency and matrix effects.
41 3.2.6. Serum
3.2.6.1. Sample preparation
Serum samples were allowed to reach room temperature. Five hundred µL were diluted with 200 µL of PBS (pH=7.4), mixed with pronase solution (100 µL, 40 mg/mL) and incubated in a water bath at 37°C for 18 hours. After enzymatic treatment with pronase, labelled internal standard solutions were added (20 µL U-[13C
17]-AFB1 5 ng/mL; 20 µL U-[13C20]-OTA 5 ng/mL). Serum sample was shacked
for 5 min with 800 µL of n-hexane and centrifuged at 15000 rpm for 15 minutes at 4°C. The sample was then extracted in a 2 mL Eppendorf tube with 1 mL of acidified ethyl acetate (1% formic acid) by shaking for 30 min. The sample was centrifuged at 15000 rpm for 15 minutes at 4°C and the supernatant transferred in a collection amber vial. One mL of ACN was then added to the serum residue, sample is vortexed and mixed with 300 mg of QuEChERS (DisQuE, Waters, Milford, MA, USA). The sample was centrifuged at 15000 rpm for 15 minutes at 4°C and the organic layer transferred in a separate collection vial. Both collected organic phases were evaporated to dryness, reconstituted in 500 µL of MeOH:H2O
10:90 v/v and 20 µL injected into UHPLC-HRMS system. In Figure 15, the scheme of the sample preparation is reported.
42
Figure 15. Scheme of the sample preparation for AFB1, OTA and AFB1-Lysine analysis in serum.
3.2.6.2. LC-HRMS analysis
Only slight modifications were applied for mycotoxins determination in serum with respect to the method previously reported for urine (Section 3.2.5.2). Namely, the following step gradient was used: 10% B increase to 99% in 10 min, keep isocratic at 99% B for 4 min, from 14 to 14.6 min return to 80% B, and finally re-equilibrate the column at 10% B for 2.4 min. The injection volume was set at 20 µL. For HRMS determination, the in-source fragmentation was not applied. Precursor ion, fragment and collision energy used are reported in Table 3.
The analytical method used for detecting AFB1 in serum was also applied for the
determination of OTA by the quantification of the free toxin. This extension to OTA was motivated by the explorative idea to evaluate a possible co-occurrence of AFB1
and OTA in serum.
PRETREATMENT Digestione enzimatica • 500 µL serum • +200 µL PBS 0.1 M (pH 7.4) • +100 µL pronase 40 mg/mL 18 h at 37 °C • Centrifuge 15000 rpm, 4°C, 15 min
Labelled ISTD addition
• +20 µL AFB113C 1,25 ng/mL
• +20 µL OTA 13C 50,0 ng/mL
Cleaning step
• +800 µL n-hexane
• Centrifuga 15000 rpm, 4 °C, 15 min
• 1 mL Ethyl acetate 1%HCOOH • 30 min shake
• Centr 15000 rpm, 4°C, 15 min
Organic fraction Dry the sample 40 °C under a
stream of N2
• 500 µL MeOH/H2O 10/90 • Centrifuge 15000 rpm,
4 °C 20 min
• Filtration (PTFE filter, 0,2 µm)
• 1 mL ACN + QuEChERS • 3 min vortex
• Centr 15000 rpm, 4°C, 15 min
Organic fraction Dry the sample 40 °C under a
stream of N2
• 500 µL MeOH/H2O 10/90 • Centrifuge 15000 rpm,
4 °C 20 min
• Filtration (PTFE filter, 0,2 µm)
AFB1 OTA AFB1-Lysine
43
The extracted ion chromatograms and dd-MS2 TIC obtained by the injection of the highest calibration solution are reported in Figure 16. The data dependent spectra of AFB1 and OTA are reported in Figure 17 and 18, respectively. In Figure 19 the
extracted ion chromatograms of a serum sample naturally contaminated with AFB1
and OTA is reported.
Table 3. Precursor ion, fragments and collision energy used for the determination of the selected
mycotoxins in serum samples.
Chemical formula Precursor ion (m/z) [M+H]+ Fragment (m/z) NCE AFB1 C17H12O6 313.07066 285.07571; 241.04952 50 U-[13C 17]-AFB1 C17H12O6 330.12770 - - AFB1-Lysine C23H24N2O8 457.16054 394.12782, 328.08112 37 OTA C20H18ClNO6 404.08954 257.02147; 239.01087 40 U-[13C 20]-OTA C20H18ClNO6 424.15664 - -
44
Figure 16. Extracted chromatograms obtained by the injection of the highest calibration solution.
From the top TIC of the full scan in the range 100-800, AFB1 peak followed by dd-MS2 TIC of
AFB1 fragments, OTA peak followed by dd-MS2 TIC of OTA fragments, the extracted ion
chromatogram for U-[13C
17]-AFB1 and U-[13C20]-OTA.
Figure 17. Data dependent mass spectrum (dd-MS2) of AFB
1. RT:0.00 - 15.00 0 1 2 3 4 5 6 7 8 9 10 11 12 13 14 15 Time (min) 0 50 100 0 50 100 0 50 100 0 50 100 R e la ti ve A b u n d a n ce 0 50 100 0 50 100 8.75 8.76 8.73 5.64 5.63 8.81 5.62 7.357.38 8.42 9.77 4.47 4.13 3.74 0.81 1.77 2.743.20 10.98 0.51 1.45 11.9612.4513.0913.8014.07 7.07 7.07 7.06 7.08 7.04 7.04 7.11 7.02 7.13 7.05 7.09 7.12 8.50 8.51 8.48 8.52 8.46 8.55 8.44 8.58 8.48 8.52 8.56 8.60 8.63 8.50 8.51 8.48 7.077.07 7.06 8.52 7.047.08 7.04 8.46 8.55 7.11 7.02 8.44 8.58 7.14 NL: 1.46E6 m/z= 313.06909-313. 07223 F: FTMS + p ESI Full ms [100.0000-800. 0000] MS 24lug18_L6_2 NL: 5.21E5
TIC F: FTMS + p ESI d Full ms2 [email protected] [50.0000-340.0000] MS 24lug18_L6_2 NL: 6.84E6 m/z= 404.08752-404. 09156 F: FTMS + p ESI Full ms [100.0000-800. 0000] MS 24lug18_L6_2 NL: 3.58E6
TIC F: FTMS + p ESI d Full ms2 [email protected] [50.0000-430.0000] MS 24lug18_L6_2 NL: 2.62E6 m/z= 330.12605-330. 12935+ 424.15452-424. 15876 F: FTMS + p ESI Full ms [100.0000-800. 0000] MS 24lug18_L6_2 10.66 NL: 6.42E9
TIC F: FTMS + p ESI Full ms [100.0000-800. 0000] MS 24lug18_L6_2
19giu18_L6 RT:7.06AV:1NL:7.56E4 F:FTMS + p ESI d Full ms2 [email protected] [50.0000-340.0000] 235 240 245 250 255 260 265 270 275 280 285 290 295 300 305 310 m/z 0 5 10 15 20 25 30 35 40 45 50 55 60 65 70 75 80 85 90 95 100 R e la ti v e A b u nd a nc e 285.07507 270.05157 241.04887 242.05708 298.04675 257.08032 271.05609 253.04889
45
Figure 18. Data dependent mass spectrum (dd-MS2) of OTA.
Figure 19. Chromatogram obtained by the injection of a serum sample naturally contaminated
with AFB1 and OTA. From the top, the TIC of the full scan in the range 100-800, AFB1 peak
followed by dd-MS2 of AFB
1 fragments, OTA peak followed by dd-MS2 of OTA fragments and
the extracted ion chromatograms of AFM1, U-[13C17]-AFB1 and U-[13C20]-OTA, respectively.
19giu18_L6 RT:8.50-8.58AV:3NL:1.21E6 F:FTMS + p ESI d Full ms2 [email protected] [50.0000-430.0000] 238 239 240 241 242 243 244 245 246 247 248 249 250 251 252 253 254 255 256 257 258 259 m/z 0 5 10 15 20 25 30 35 40 45 50 55 60 65 70 75 80 85 90 95 100 Re la ti v e A b u nd a nc e 257.02104 239.01040 259.01815 258.02437 241.00728 240.01373 248.93661 RT:0.00 - 15.00 0 1 2 3 4 5 6 7 8 9 10 11 12 13 14 Time (min) 0 50 100 0 50 100 0 50 100 0 50 100 R e la ti ve A b u n d a n ce 0 50 100 0 50 100 11.35 14.65 11.33 11.38 12.62 11.14 10.47 9.89 13.05 13.36 9.87 12.54 4.194.20 5.385.39 4.174.154.264.45 5.87 7.917.927.948.879.60 11.45 14.43 2.012.03 5.906.66 1.99 2.80 5.19 7.52 8.15 0.93 0.95 3.70 7.08 7.06 7.10 7.05 7.047.11 7.12 5.32 5.34 7.02 9.46 5.30 8.80 1.871.89 7.768.28 9.48 1.84 7.10 7.06 5.33 8.48 8.47 8.49 8.45 2.922.93 8.51 2.91 5.645.65 5.66 8.44 8.53 5.67 2.892.953.65 4.924.945.625.69 6.626.64 8.428.558.80 8.53 8.50 4.97 2.91 7.07 7.06 7.088.478.48 8.49 7.05 7.10 8.45 7.04 8.51 8.448.53 7.12 7.02 8.55 0.95 3.99 0.01 NL: 6.40E9
TIC F: FTMS + p ESI Full ms [100.0000-800. 0000] MS 11giu18_94 NL: 1.74E5 m/z= 313.06909-313. 07223 F: FTMS + p ESI Full ms [100.0000-800. 0000] MS 11giu18_94 NL: 6.56E5
TIC F: FTMS + p ESI d Full ms2 [email protected] [50.0000-340.0000] MS 11giu18_94 NL: 3.06E5 m/z= 404.08752-404. 09156 F: FTMS + p ESI Full ms [100.0000-800. 0000] MS 11giu18_94 NL: 2.51E5
TIC F: FTMS + p ESI d Full ms2 [email protected] [50.0000-430.0000] MS 11giu18_94 NL: 1.17E6 m/z= 330.12605-330. 12935+ 424.15452-424. 15876 F: FTMS + p ESI Full ms [100.0000-800. 0000] MS 11giu18_94
46
3.2.6.3. Analytical quantification
For mycotoxins quantification an internal standard (ISTD) approach was adopted. The internal standard for AFB1 and OTA was the 13C isotope labelled molecule in
which all carbon atoms are substituted by the stable isotope 13C. The calibration curve was obtained by plotting the ratio (standard area/13C area) versus the concentration expressed in pg/mLserum. The calibration curve was obtained by
fitting the data with a linear regression model based on least squares method. ISTD was applied to the sample prior to extraction allowing to correct for extraction efficiency and matrix effects.
47
3.3. Method validation
Identification criteria were set for all the analyzed mycotoxins. Linearity and LOD and LOQ of the analytical methods were assessed. Precision and trueness were assessed from repeated analyses on spiked blank urine and serum samples. Precision was evaluated by calculating the intermediate relative standard deviation (repeated analyses on different days), while trueness was estimated in terms of apparent recovery (RA). Extraction efficiency (RE) and matrix effect (SSE) were
also evaluated during the validation process.
3.3.1. Identification criteria
According to the criteria reported in the DG SANTE guidance document on identification of mycotoxins in food and feed (SANTE/12089/2016), the retention time (RT) of the analyte in the sample extract should correspond to the average RT of the calibration standards measured in the same sequence with a tolerance of ±0.1 min. Moreover, for the 13C-isotopically labelled analogue of the analyte (internal standard) added to the sample extract, the RT of the analyte should correspond to that of its labelled internal standard added to the pure solvent standard solution with a tolerance of ±0.05 min. For HRMS analysis identification is based on observation of the molecular ion (or, if not available, adducts) and at least one fragment that is specific for the selected analyte.
48 3.3.2. Linearity
Linearity of the method was evaluated from six points calibration curves injected in triplicate for three consecutive days, for each mycotoxin/matrix combination. For each calibration point a response ratio between response of target compound and response of internal standard was calculated and plotted against concentration. Regression lines were plotted applying a linear regression model based on least squares method.
The linearity was assessed by visual checking of the residual plot of response ratios (plotted in y-direction) versus the respective concentration levels (plotted in x-direction). The final estimated linearity model was verified using the lack-of-fit test (significance of the test with pvalue below 0.05), to confirm that the selected
regression and linearity were acceptable. Once visual checking of the residual and lack-of-fit test passed, the R squared coefficient was taken as a measure of linearity.
3.3.3. Limit of detection and quantification
The limit of detection (LOD) is defined as the smallest amount or concentration of analyte in the test sample that can be reliably distinguished from zero (Thompson, 2002).
The limit of quantification is the lowest concentration of analyte that can be determined with an acceptable repeatability and trueness (Thompson, 2002). According to Wenzl (Wenzl, 2016), the variability of multiple analyses of representative matrix blank samples may be used to estimate the LOD of an analyte in the respective matrix. If blanks do not exist or if a signal cannot be obtained from
49
blank analysis, a pseudo-blank sample (blank sample spiked at low level) may be used instead. The spiked blanks approach was used for LOD and LOQ assessment, the spiked sample was analyzed in ten replicates under repeatability conditions. The variability, expressed as standard deviation, obtained for the ten analyses of spiked blanks was used for the estimation of the critical value of LOD. Calculation was carried out according to Equation A.
𝑥𝐿𝑂𝐷 = 3.9 ∗ 𝑠𝑦,𝑏
𝑏 (A)
Where sy,b is the standard deviation of the 10 replicates and b represents the slope
of a dedicated calibration curve at concentration levels close to the expected LOD value.
According to Wenzl (Wenzl, 2016), the LOQ was estimated according to Equation B.
𝑥𝐿𝑂𝑄 = 3.3 ∗ 𝑥𝐿𝑂𝐷 (B)
The LOQ values obtained with the theoretical calculation approache were included in the validation as the lowest concentration level.
![Figure 8. Extracted ion chromatogram for AFB 1 -Lysine ([M+H] + , m/zt heo = 457.16054, retention](https://thumb-eu.123doks.com/thumbv2/123dokorg/2893521.11406/37.892.151.822.144.521/figure-extracted-ion-chromatogram-afb-lysine-heo-retention.webp)