U
NIVERSITÀ DELLA
C
ALABRIA
Facoltà di Ingegneria
Dipartimento di Meccanica
D
OTTORATO DI
R
ICERCA IN
I
NGEGNERIA
M
ECCANICA
XX Ciclo
S.S.D.ING-IND/15DISEGNO E METODI DELL’INGEGNERIA INDUSTRIALE
Innovative methodologies and tools
for the interaction with Virtual Prototypes
Coordinatore
Prof. Maria Laura Luchi
Tutor
Prof. Maurizio Muzzupappa
Dottorando
Ing. Francesco Caruso
Summary
Motivations... 4
Outline... 7
Chapter 1. Background... 9
1.1. The role of the virtual prototype in the product development process... 9
1.2. Virtual prototypes employments in Virtual reality ... 11
1.3. Virtual prototypes employment in Augmented Reality ... 13
Chapter 2. Visualization of Engineering Data in Augmented Reality... 22
2.1. State of the Art of the augmented reality application for scientific visualization 23 2.2. Methodology... 24
2.3. Hardware set-up ... 25
2.4. The VTK4AR framework ... 27
2.5. Implementation ... 28
2.6. New VTK Classes for AR... 31
2.7. Case Studies... 32
2.8. Conclusion and Future Developments ... 36
Chapter 3. An Integrated Environment For The Validation In Virtual Reality Of The Dynamical Behavior Of Functional Digital Mock-Ups... 38
3.1. Implementation ... 40
3.2. Division MockUp ... 41
3.3. The SIMLib library ... 42
3.4. The Simulink S-Function for the communication... 44
3.5. The Divison plug-in... 46
3.6. Test Case... 46
3.7. Summary ... 49
Chapter 4. Multi-domain co-simulation using Multi-Body and Electronic Control System solvers 51 4.1. State of the Art ... 54
4.2. Methodology... 55
4.3. Benefits and Drawbacks... 58
4.4. Case study... 59
4.5. Conclusions... 67
Chapter 5. An experimental environment for the runtime communication among different solvers and visualization modules... 68
5.1. Introduction... 68
5.2. Implementation ... 73
5.4. The solvers... 75
5.5. The VisSim application ... 76
5.6. Test Case... 78
Motivations
After the Scientific Revolution, scientists have always tried to integrate and correct their knowledge by observing and investigating real phenomena. The scientific method in fact, is properly based on the observation and the experimentation. Due to the recent technologies, the scientific method has been revised, and a wide range of experimentations are now performed using computers. Nowadays in fact, using the computers, it is possible to virtually recreate an experiment, i.e. to reproduce the experiment in a computer synthesized environment. As it is easy to understand, this possibility has enormous advantages with respect to the standard experimentation methods. Therefore, we assisted to the birth and widespread diffusion of software products for virtual simulations, which actually represent one of the most powerful tools in the hands of the scientists.
However, as the scientific method teach, the observation of the phenomena is crucial for the enhancement of the knowledge. Therefore, the results of the simulations must be processed and visualized in the most effective way to get a better comprehension of the phenomena. The large amount of data produced by the numerical simulation must be interpreted and presented in the most effective way. For this reason, part of this PhD work has been spent in the study of innovative techniques of visualization for the numerical simulations results.
During last years, a process of high specialization of the knowledge occurred. The specialization of knowledge lead to the specialization of the “tools” needed by the scientists. In particular, as far as simulation software concerns, it became highly specialized too. In fact we can find many software for simulations in a specific physical domain, e.g. CFD simulators, FEM simulators, and so on.
On the other side, the complexity of the industrial products is rapidly increasing, and more and more often, several physical domains are involved in the development of a single product. This lead to the birth of the so called
cross-domain engineering, in which several engineers of different fields are involved and engaged in the development of a complex product.
In order to apply the scientific method to the current complex projects it is necessary “to join” the results of each simulator to create a cross-domain simulation environment. In this way scientists will be closer to the original scientific method, because in the real experiments all the domains are naturally involved.
Obviously, as a mechanical engineer, the research work has been focused and fitted for the mechanical engineering tasks. The mechanical engineer uses the computers in order to simulate and observe the behavior of its work before its physical realization. This target is achieved by the use of the Virtual Prototype (VP). Therefore, the role of the virtual prototype has been central throughout this research. As it is easy to understand, in the engineering field, the experiments regard the prototype of the under development product. The object of the experimentation is therefore the virtual prototype. During the product development process in fact, the virtual prototype is incrementally enriched by the results provided by the numerical simulations. Virtual prototype should include the geometry, the mathematical models to describe the physical properties of the product and, if presents, the behavioral model provided by the control logic. The final goal should be a complete and fully functional virtual prototype, on which it should be possible to perform a cross-domain validation phase before the launch of the product on the market. At present instead, each of the aspect of the experimentation is almost always performed in a specific simulation environment, i.e. the dynamic validation is performed with a multi body solver; the fluid dynamic evaluation is performed within a CFD simulator and so on. It is possible to perform a cross-domain simulation using dedicated multi-physics software like COMSOL/Multi-Physics, or trying to use built-in software interfaces between two different commercial software, e.g. Matlab/Adams, Simulink/Visual Nastran. However, both solutions do not allow engineers to employ their own solver or to choose the best combination among the available simulation software. A
framework, which allows one to use different solvers as modular blocks to build an integrated cross-domain simulation environment, could be, obviously, a better and more flexible solution. Further, in order to achieve an effective comprehension of numerical data, it should be possible to use high-end visualization techniques, like Virtual or Augmented reality and powerful post-processors. One of the targets of this PhD work in fact was to improve the effectiveness of the numerical simulations. Therefore, a co-simulation framework for multi-domain simulations, which allows one to inter-change solvers and visualization frameworks has been developed. The framework allows one to perform the visualization in a Virtual Reality environment in order to improve the interaction of the user with the experiment. The aim of this framework is therefore to consider all the physical domains and to reproduce the experiments in the most natural way for the user.
The whole research is addressed in the creation of a new environment to support designers. This environment mixes different kind of information (coming from the real world, the numerical simulations and so on) to provide
Outline
In the first chapter, a background of the current technologies employed throughout the research, i.e. Virtual Prototyping, Virtual Reality and Augmented Reality is presented. Afterwards, the research work is presented. The research work can be divided into two main topics:
Advanced interaction techniques with numerical simulation Multi-Domain simulation
Chapter 2 and chapter 3 regards the first research topic.
In the second chapter an Augmented Reality framework for scientific visualization is presented [1][2][3][4]. The target of this work has been the capability of visualize data from numerical simulations superimposed to the real object that they refer to. As previously said, the visualization is crucial for the understanding and the comprehension of the real phenomena. Therefore, in this chapter is presented an investigation on the capabilities provided by the augmented reality in scientific visualization tasks. A methodology that provides the tools and defines the steps needed to obtain the visualization in Augmented R eality of industrial engineering data has been developed.
In the third chapter, a possible improvement of the user interaction with numerical simulations is presented. In particular, an integrated environment for the validation in virtual reality of the dynamical behavior of functional digital mock-ups is described [5][8]. In this environment it is possible to achieve multi-body simulation in Virtual Reality. The multi-body solver animates the three-dimensional model visualized in a virtual reality environment, and the user can interact with the simulation using joysticks.
Chapter 4 and chapter 5 regard the second research topic, i.e. the multi-domain simulation.
The fourth chapter describes a co-simulation environment in which multi-body solver and electronic control solver are used to simulate the behavior of a mechatronic product. With the help of the co-simulation, a new design
methodology for complex product has been developed. This methodology, based on the top-down approach, starts from the conceptual model, and uses the simulation to validate each step of the design process. At the end of the design process it is possible to perform the validation of both the aesthetic and the functional part of an industrial product within an immersive virtual environment. The fifth chapter describes an experimental environment for runtime communication among different solvers and visualization modules [7]. The target of this work is a visualization and simulation environment which allows the runtime communication among the visualization framework and different solvers, to obtain a multi-domain simulation and visualization environment. This work provides great flexibility and modularity for solvers and visualization environments, since it uses an external scheduler for triggering the different applications. It is a new approach compared to the standard simulation techniques.
Chapter 1.
Background
1.1.
The role of the virtual prototype in the product
development process
Today’s product development is under a highly challenging environment, and companies are under increasing pressure to sustain their competitive advantages by reducing product development time and cost while maintaining a high level of quality. Normally, the Product development process is made up by different phases, resumed in the picture below.
Figure 1: Product Development Process
Prototyping is the design verification phase of Product Development used to demonstrate or prove aspects of a design. Normally, prototyping is simply taking the design from the virtual and imaginary realm to the physical world. There are many levels of Prototypes. Some are simple duct-tape and bailing wire to visualize how something might work; Others are highly polished but fragile representations for show and tell; still others are functional representations that work. The kind of prototype used should fit the needs of the project especially since there is often a significant cost involved.
Typical prototyping methods include clay (or other) mock-up, fabrication and machining, and rapid prototyping. Mock-ups are typically done very early in the design for visualization, feel, and to allow adjustments or fiddling with shape and size. Fabricated prototypes are typically functional versions that may or may not look like the final product but give the opportunity to test function and prove something works.
The virtual prototyping is a new way to perform the validation phase. It aims to reduce (or avoid) the realization of the physical prototypes by creating a digital model of the product. The idea is to simulate and forecast the behavior of the real product before its realization by using a numerical model. All the tests will be therefore performed on the Virtual Prototype (VP) and not on a real one. In other words, the Virtual Prototype is a numerical model containing most of the information of the product needed for its validation and its evaluation.
The term “virtual prototype” (VP) has been widely used by various researchers and engineers. It is important to formally describe what constitutes a VP and, subsequently, provide a background on various types of virtual prototyping. Practically, it is a computer-based simulation of a system or subsystem with a degree of functional realism comparable to a physical prototype. In general, a VP is a 3-dimensional virtual reality (VR) based model which seeks to “mimic” a target (or “real-world”) object, system, or environment. This model can be an object, system (or collection of objects), or a complex environment. The process of creating and using a VP in various applications can be referred to as virtual prototyping. A VP, has certain characteristics which differentiates it from other models or prototypes. These include:
1. Appearance characteristics: VPs must possess accurate geometry, topology, and appearance, reflecting characteristics of the target part, object, system, or environment
2. Simulation characteristics: VPs should be capable of simulating engineering or science-based characteristics, including behavior with real-time responses 3. Representation criteria: AVP is a digital or computer-based representation
4. Interface criteria: VPs must possess the ability to interface VR technology and graphics, including supporting semi-immersive or immersive applications
1.2.
Virtual prototypes employments in Virtual reality
The term Virtual Reality (VR) was coined in the 1989 by Jaron Lanier,
acknowledged as one of the fathers of the VR. Lanier in 1984 founded the VPL Inc. (Virtual Programming Language), which was one of first companies involved in Virtual Reality, producing first dedicated devices: the Eyephone helmet for the stereoscopic vision, the Dataglove gloves and the Datasuit suit. For several years research tried to find which were the best tools and instruments to provide the user the feeling of “immersion” in the virtual world. At the beginning nobody knew which were the possible employments of these new technologies, but it was clear that VR capabilities were enormous. The interest for the devices invented and developed by Lanier was very high, in fact also the Matsushita company invested in this field. However, times were not ripe to get concrete results to grant an adequate remunerations for the investments. The VPL in fact, was in loss and it was absorbed by Thomson. The excitement
Virtual Reality (VR) technologies are widely employed in the Product Development Process (PDP) in several industrial sectors like automotive, aerospace, defence, bioengineering, etc. [9][10]. Visualization has been the first application area in which VR has been appreciated, since the immersive visualization, employing large display and stereoscopic vision, allows the user to better understand the meaning of the data visualised or the aesthetics of new products. In the automotive field, for example, VR has been employed for the visualization, in real scale, of the virtual prototype of new cars [11] and for the visualization of complex data-sets like the results of the Finite Elements Method (FEM) or Computational Fluid Dynamics (CFD) analysis[12]. The visualization of data-sets generated by engineering simulation software does not present particular integration problems because the software for immersive visualization is usually able to read a wide range of file formats.
Although visualization has played an important role in the diffusion of VR inside industries, it does not exploit the natural interaction capabilities of VR. In a VR environment, in fact, it is possible to interact in a more natural way with the digital mock-up. As a matter of fact, thanks to special devices, the user finds him/herself in a simulated environment in which, through stereoscopic vision, he/she can perceive the depth of the scene, having -at the same time- the possibility of interacting with the virtual product by using his/her hands. Such interaction is possible thanks to the use of special gloves, which have sensors that are able to detect the bending of one’s fingers. By supplying the gloves with tracking sensors, that are able to reveal position and orientation, it is possible to reconstruct the movements of the user’s hands in a virtual environment; this way the user may carry out several types of simulations connected to the interaction with the product. The main advantages offered by VR technologies are more evident in all the applications in which the interaction with the virtual product is important. A widespread example in this sense is the virtual assembly that aims to simulate the entire operative context in which the human operator works, during the assembly/disassembly task. In this way, a designer can directly verify potential difficulties in component reachability, in posture and visibility [13][14][16][17][18][19][20][21].
Other examples in which the interaction capabilities of VR have been successfully employed in the product development process are Virtual Cabling[22][23] tools, ergonomics evaluation [24] and simulation of the product behaviour both for functional [25] and usability tests[26]. Most of the reported references show that VR is an effective tool to support the design process of industrial products, but it is not clear if the routine use of these tools is really efficient. In fact, the lack of integration between VR and other tools, employed in the design process (usually CAx software) requires a lot of manual work to prepare the virtual environment or to post-process the results obtained in VR. This problem is one of the main obstacles to a wider diffusion of the VR technologies in the PDP and, for this reason, it is important to create an efficient link between CAx and VR.
Many CAD vendors have approached this problem because they are widening their offer in IT solutions acquiring or developing the technologies needed to complete their product range with VR tools like visualization software for DMU or CAE analysis, in order to satisfy the manifold requirements of the product development process. The interoperability between CAD software and VR system has been gradually realised thanks to the development of common file formats for product data exchange and sharing. UGS [27] and Dassault Systemes [28], two of the foremost companies in the PLM systems market, have released some specific languages to support interoperability in the PLM system. UGS proposes the JT format, which is the one employed for the storage and visualization of DMU geometric data. UGS also proposes the PLM XML format, which is defined by a set of XML schemas and includes the representation of both the high-level metadata and the geometric representation of the product. Dassault proposes 3DXML, which is an open file format usable in all their software for product development. Both these XML based file formats offer the advantage of being customizable with user defined metadata that can be added to the standard schemas to enhance the model with all the information needed to perform a specific task.
This possibility can be very useful for VR application development. As a matter of fact, each specific VR tool requires different product data, and these can be stored using the previously mentioned XML based language. Besides, the availability of a powerful language for data storage does not resolve the integration problems at all, because it requires the development of software interfaces (in both the CAx and VR applications), able to read, write and manage the specific metadata stored in the file.
1.3.
Virtual prototypes employment in Augmented Reality
Augmented Reality (AR) is a variation of Virtual Environments (VE), or Virtual Reality as it is more commonly called. VE technologies completely immerse a
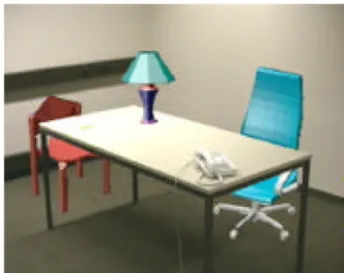
user inside a synthetic environment. While immersed, the user cannot see the real world around him. In contrast, AR allows the user to see the real world, with virtual objects superimposed upon or composited with the real world. Therefore, AR supplements reality, rather than completely replacing it. Ideally, it would appear to the user that the virtual and real objects coexisted in the same space, similar to the effects achieved in the film "Who Framed Roger Rabbit?" shows an example of what this might look like. It shows a real desk with a real phone. Inside this room are also a virtual lamp and two virtual chairs. Note that the objects are combined in 3-D, so that the virtual lamp covers the real table, and the real table covers parts of the two virtual chairs. AR can be thought of as the "middle ground" between VE (completely synthetic) and telepresence (completely real) [29][30]
Figure 2 Augmented Reality Scene
An AR system supplements the real world with virtual (computer-generated) objects that appear to coexist in the same space as the real world. While many researchers broaden the definition of AR beyond this vision, we define an AR system to have the following properties:
• combines real and virtual objects in a real environment; • runs interactively, and in real time; and
Certain AR applications also require removing real objects from the perceived environment, in addition to adding virtual objects. For example, an AR visualization of a building that stood at a certain location might remove the building that exists there today. Some researchers call the task of removing real objects mediated or diminished reality, but we consider it a subset of AR. Milgram defined a continuum of real-to-virtual environments, in which AR is one part of the general area of mixed reality (Figure 2). In both augmented virtuality, in which real objects are added to virtual ones, and virtual environments (or virtual reality), the surrounding environment is virtual, while in AR the surrounding environment is real. We focus on AR and don’t cover augmented virtuality or virtual environments. The beginnings of AR, as we define it, date back to Sutherland’s work in the 1960s, which used a seethrough HMD to present 3D graphics[31]. However, only over the past decade has there been enough work to refer to AR as a research field. In 1997, Azuma published a survey [32] that defined the field, described many problems, and summarized the developments up to that point. Since then, AR’s growth and progress have been remarkable. In the late 1990s, several conferences on AR began, including the International Workshop and Symposium on Augmented Reality, the International Symposium on Mixed Reality, and the Designing Augmented Reality Environments workshop. Some well-funded organizations formed that focused on AR, notably the Mixed Reality Systems Lab in Japan and the Arvika consortium in Germany. A software toolkit (the ARToolkit) for rapidly building AR applications is now freely available on the internet.
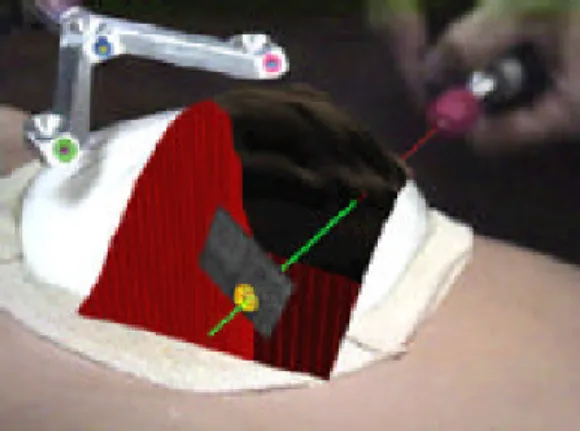
Doctors could use Augmented Reality as a visualization and training aid for surgery. It may be possible to collect 3-D datasets of a patient in real time, using non-invasive sensors like Magnetic Resonance Imaging (MRI), Computed Tomography scans (CT), or ultrasound imaging. These datasets could then be rendered and combined in real time with a view of the real patient. In effect, this would give a doctor "X-ray vision" inside a patient. This would be very useful during minimally-invasive surgery, which reduces the trauma of an operation by using small incisions or no incisions at all. A problem with minimally-invasive techniques is that they reduce the doctor's ability to see inside the patient, making surgery more difficult. AR technology could provide an internal view without the need for larger incisions. AR might also be helpful for general medical visualization tasks in the surgical room. Surgeons can detect some features with the naked eye that they cannot see in MRI or CT scans, and vice-versa. AR would give surgeons access to both types of data simultaneously. This might also guide precision tasks, such as displaying where to drill a hole into the skull for brain surgery or where to perform a needle biopsy of a tiny tumor. The information from the non-invasive sensors would be directly displayed on the patient, showing exactly where to perform the operation. AR might also be useful for training purposes [33]. Virtual instructions could remind a novice surgeon of the required steps, without the need to look away from a patient to consult a manual. Virtual objects could also identify organs and specify locations to avoid disturbing [34]. Several projects are exploring this application area. At UNC Chapel Hill, a research group has conducted trial runs of scanning the womb of a pregnant woman with an ultrasound sensor, generating a 3-D representation of the fetus inside the womb and displaying that in a see-through HMD (Figure 3). The goal is to endow the doctor with the ability to see the moving, kicking fetus lying inside the womb, with the hope that this one day may become a "3-D stethoscope" [35][36]. More recent efforts have focused on a needle biopsy of a breast tumor. Figure 4 shows a mockup of a breast biopsy operation, where the virtual objects
identify the location of the tumor and guide the needle to its target [37]. Other groups at the MIT AI Lab [38][39][40][41], General Electric [42], and elsewhere [43][44] [45] are investigating displaying MRI or CT data, directly registered onto the patient.
Figure 4: Virtual fetus inside womb of pregnant patient. (Courtesy UNC Chapel
Hill Dept. of Computer Science)
Figure 5: Mockup of breast tumor biopsy. 3-D graphics guide needle insertion.
(Courtesy UNC Chapel Hill Dept. of Computer Science)
Another category of Augmented Reality applications is the assembly, maintenance, and repair of complex machinery. Instructions might be easier to understand if they were available, not as manuals with text and pictures, but rather as 3-D drawings superimposed upon the actual equipment, showing step-by-step the tasks that need to be done and how to do them. These superimposed 3-D drawings can be animated, making the directions even more explicit. Several research projects have demonstrated prototypes in this area. Steve Feiner's group
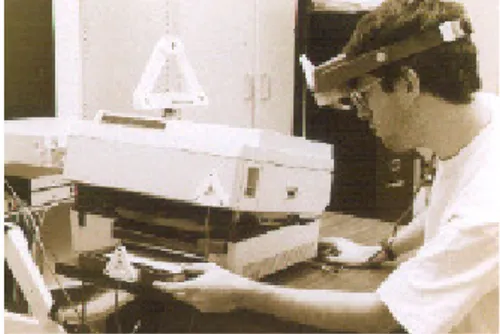
at Columbia built a laser printer maintenance application [46], shown in Figures 5 and 6. Figure 5 shows an external view, and Figure 6 shows the user's view, where the computer-generated wireframe is telling the user to remove the paper tray. A group at Boeing is developing AR technology to guide a technician in building a wiring harness that forms part of an airplane's electrical system. Storing these instructions in electronic form will save space and reduce costs. Currently, technicians use large physical layout boards to construct such harnesses, and Boeing requires several warehouses to store all these boards. Such space might be emptied for other use if this application proves successful [47][48][49]. Boeing is using a Technology Reinvestment Program (TRP) grant to investigate putting this technology onto the factory floor [50]. Figure 7 shows an external view of Adam Janin using a prototype AR system to build a wire bundle. Eventually, AR might be used for any complicated machinery, such as automobile engines [51].
Figure 6 External view of Columbia printer maintenance application. Note thatall objects must be tracked. (Courtesy Steve Feiner, Blair MacIntyre, and
Dorée Seligmann, Columbia University.)
Figure 7 Prototype laser printer maintenance application, displaying how to remove the paper tray. (Courtesy Steve Feiner, Blair MacIntyre, and Dorée
Figure 8 Demonstration of Boeing's prototype wire bundle assembly (Courtesy David Mizell, Boeing)
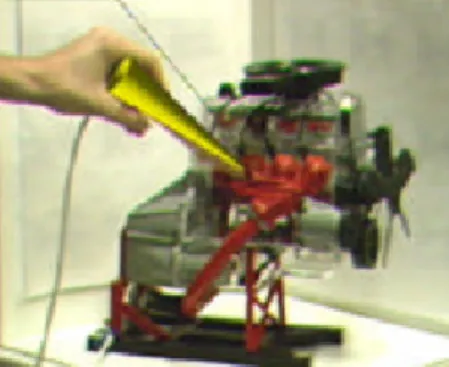
AR could be used to annotate objects and environments with public or private information. Applications using public information assume the availability of public databases to draw upon. For example, a hand-held display could provide information about the contents of library shelves as the user walks around the library [52][53][54]. At the European Computer-Industry Research Centre (ECRC), a user can point at parts of an engine model and the AR system displays the name of the part that is being pointed at [55]. Figure 9 shows this, where the user points at the exhaust manifold on an engine model and the label "exhaust manifold" appears.
Figure 9 Engine model part labels appear as user points at them. (Courtesy ECRC)
Figure 10 Windows displayed on top of specific real-world objects. (Courtesy Steve Feiner, Blair MacIntyre, Marcus Haupt, and Eliot Solomon, Columbia
University.)
Alternately, these annotations might be private notes attached to specific objects. Researchers at Columbia demonstrated this with the notion of attaching windows from a standard user interface onto specific locations in the world, or attached to specific objects as reminders [56]. Figure 10 shows a window superimposed as a label upon a student. He wears a tracking device, so the computer knows his location. As the student moves around, the label follows his location, providing the AR user with a reminder of what he needs to talk to the student about.
Figure 11 Virtual lines help display geometry of shuttle bay, as seen in orbit.(Courtesy David Drascic and Paul Milgram, U. Toronto.)
AR might aid general visualization tasks as well. An architect with a see-through HMD might be able to look out a window and see how a proposed new skyscraper would change her view. If a database containing information about a building's structure was available, AR might give architects "X-ray vision" inside a building, showing where the pipes, electric lines, and structural supports are inside the walls [56]. Researchers at the University of Toronto have built a system called Augmented Reality through Graphic Overlays on Stereovideo (ARGOS) [57],
which among other things is used to make images easier to understand during difficult viewing conditions [58]. Figure 11 shows wireframe lines drawn on top of a space shuttle bay interior, while in orbit. The lines make it easier to see the geometry of the shuttle bay. Similarly, virtual lines and objects could aid navigation and scene understanding during poor visibility conditions, such as underwater or in fog.
Chapter 2.
Visualization of Engineering Data in
Augmented Reality
During this PhD work a research about the capabilities of Augmented Reality in the field of industrial engineering has been carried out. The first idea was try to investigate the employment of AR techniques to improve the comprehension of numerical data in collaborative tasks. In order to validate this idea, an innovative application of Augmented Reality techniques in the field of industrial engineering has been developed. With the help of this application the user can explore data from numerical simulations or the results of measurements and experiments, superimposed to the real object that they refer to. The user observes the object through a tablet PC, used as a video see-through handheld display. Data are visualized superimposed to the real object that represents a spatial reference which the user can refer to, so the exploration is more natural compared to a traditional visualization software. Moreover a new framework, called VTK4AR, has been developed. This framework provides a set of useful software classes for the rapid development of AR applications for scientific visualization. VTK4AR is built on top of VTK (an open source API for scientific visualization), so it will be possible to employ a wide range of visualization techniques in many application fields, and moreover, it is possible to interactively manipulate data-sets in order to achieve a more effective way of visualization.
The AR visualization improves the collaboration among designers and technicians, since their analyses tasks are often correlated. Furthermore, it improves the handling and availability of the data itself and also simplify the explanation of complex data-sets to non-expert people. A methodology that provides the tools and defines the steps needed to obtain the visualization in AR of industrial engineering data has been developed. The methodology employs different engineering technologies, an AR system based on a tablet PC as a displaying device and a new all-in-one framework, called VTK4AR, that allows
developers to easily and rapidly develop AR applications for scientific visualization. In accord with what is above mentioned, this work presents two main innovations:
• for the first time AR techniques are employed in data visualization in an industrial design context.
• A new AR software framework for the rapid development of AR applications for scientific visualization has been developed.
2.1.
State of the Art of the augmented reality application
for scientific visualization
As previously mentioned, AR applications have been implemented in many application domains. Other applications of scientific visualization in AR have been developed upon Studierstube, a framework for collaborative AR [59][60][61][62]. These applications allow users to display and examine volumetric data in a collaborative AR environment, and to highlight or explore slices of the volume by manipulating an optical marker as a cutting plane interaction device. In these applications AR is a novel interface for scientific visualization for improving collaborations among the users, but it has not been employed to enrich real objects with useful information related to the objects itself. From the papers mentioned above, it can be inferred that AR visualization improves comprehension and interaction of the visualized data. However, none of the authors above employs this technique in the industrial engineering field, in which more and more effective ways to analyze data are required. From this perspective, in fact, the AR visualization improves the collaboration among designers and technicians, since their analyses tasks are often correlated. Furthermore, it improves the handling and availability of the data itself and also the need to explain complex data-sets to non-expert people is simplified.
2.2.
Methodology
The introduction of computer aided systems (CAx systems) has made the use of virtual prototypes indispensable, thus radically modifying the design process of industrial products. On the other hand, despite the fact that such systems are nowadays widespread, design activities still strongly depend on physical mock-ups, which are necessary to validate numerical models.
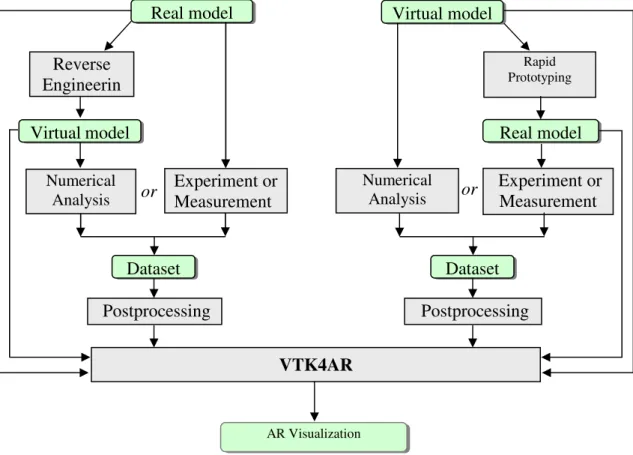
The need to use both physical and virtual prototypes during the design activity has supported the development of technologies able to easily generate physical prototypes through virtual ones and vice versa. In particular, the Reverse Engineering (RE) is nowadays the most common technique used in the engineering fields to generate virtual models from physical models, through a 3D scanner; whereas the Rapid Prototyping (RP) is the technique which allows an easy and completely automated way of generating physical prototypes through virtual models.
The methodology, proposed in the present study, integrates the above-mentioned technologies with augmented reality, for the fist time. It stands out because it has two starting points according to the kind of prototype (virtual or physical) designers initially have at their disposal.
The methodology in question requires the presence of both prototypes and, therefore, the first step one has to take is the generation of the missing prototype through the above-mentioned techniques. Secondly, in keeping with project requirements, one has to decide whether to use the virtual model to make simulations or analysis (eg. structural, fluid-dynamic, thermal, etc.) or the physical model to carry out experiments and measurements (eg. assessing mistakes made during the forming process, tension and fatigue tests, wind tunnel analyses, etc.). The third step is the post processing of data obtained, both through CAE analysis and experiments and measurements. Thanks to this operation one may determine, for example, the magnitudes visualized, or eliminate any noises from the dataset. The last step is the visualization of AR, which is made through an ad hoc software: VTK4AR. This software is supposed to create an augmented reality
environment which uses a special hardware set-up and video-tracking technology in order to be able to visualize the data-set directly superimposed on the real model. Moreover, VTK4AR requires the contemporaneous use of both the physical and the virtual prototype. In particular, VTK4AR uses virtual models to correctly visualize the real model and the data-set solving any occurring occlusion problems. Furthermore, VTK4AR uses the physical model to define the spatial reference on which the results of the simulation are visualized.
In figure 12 the various steps of the methodology proposed, are shown.
Figure 12: Methodology Diagram
2.3.
Hardware set-up
An augmented reality system can be implemented using different hardware configurations. One of the most widespread solutions is the optical see-through Head Mounted Display (HMD). Another chance is the video see-through approach: one or two cameras can be employed to transform a normal HMD, a hand-held device [60] or a flat monitor [63], into a simulated see-through display.
Real model Dataset AR Visualization VTK4AR Reverse Engineerin Numerical Analysis Virtualmodel Experiment or Measurement Postprocessing Virtual model Rapid Prototyping Experiment or Measurement Real model Numerical Analysis Dataset Postprocessing or or
Tablet PC and PDA has been widely employed in AR applications. In [65] the Tablet PC was employed to display detailed information about plant machines in an oil refinery (i.e. the inner parts of a pump), and, in the real in real project (www.contents4u.com), tablets and PDAs are employed in interior design applications to show virtual furniture in a real room.
A tablet PC has been employed as a display device because it offers some advantages compared to other possible configurations. Compared to the HMD, it is a low cost device, it is completely wireless and can be observed by two or three people at the same time, but, on the other hand, it cannot support stereoscopic vision. Compared to a handheld device, it offers a wider display and much better hardware performances, but it weighs more.
As described by Rekimoto [64], the tablet works like a magnifying glass, that can be used to perceive information about the objects that, otherwise, could not be seen. The tablet can be imagined as an augmenting window which augments the perception of the objects visualized through it. Navigation is then much more natural compared to a standard desktop environment. Furthermore, real objects on which the data are superimposed represent a spatial reference which the user can refer to. But the magnifying glass metaphor in industrial engineering data visualization has never been tested before.
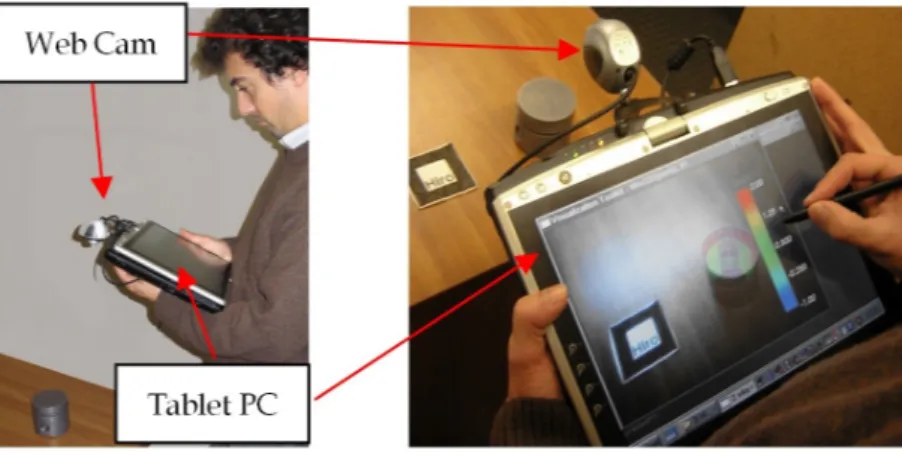
The tablet PC is equipped with a video camera employed both to simulate the see-through functionality and to track the display position with a pattern recognition algorithm.
The hardware used in this study is a tablet PC with: Intel® Pentium® M processor 1.60 GHz, 1024MB PC2700 DDR333 SDRAM, Nvidia GeForce FX Go5200 32Mb graphics card, 12.1" Polysilicon SXGA+ Display, weight 2.0Kg. The webcam employed is a Creative LivePro. It has a VGA CCD sensor and a digital video capture speed of 30 fps.
The video camera has been mounted on the top of the tablet, so it is possible for the user to handle the tablet with one hand, while the other hand holds the pen used to interact with widgets displayed on the tablet monitor.
Figure 13: Hardware set-up of vtk4ar
The use of the tablet PC as a magnifying glass allows the user to immediately become familiar with the system, even if he/she does not have any experience in augmented reality. The exploration of the dataset is natural because the user only has to move the tablet where he/she would like to display data. In fact the magnifying glass metaphor gives the user the possibility to directly experience the 3D space, and this is the best way to understand the 3D space itself [66]. The real object on which data are superimposed, represents a spatial reference, which the user can refer to when interacting in 3D. In fact, as also reported in an experiment, made by Badler et al. [67], the presence of a real spatial reference can change the 3D interaction task from a “consciously calculated activity” to a “natural and effortless” action.
2.4.
The VTK4AR framework
A video-tracking based AR application for scientific visualization needs to perform four fundamental operations: video capture, user position tracking, reading and managing data-set and a correct visualization of the AR scene. In vtk4ar the first two tasks are performed using the video-camera handling, and video tracking functionalities of the ARToolKit library suite (www.hitl.washington.edu/artoolkit), considered by now a standard de facto for Augmented Reality. Instead, as regards the management of data-sets and the
visualization of the AR scene, VTK (www.vtk.org), a specific library for scientific visualization has been used.
Figure 14: Implementation schema of a video-tracking based AR application for scientific visualization
There are many free libraries that perform such operations, but only open source software has been employed, both to keep license costs down and for the possibility to publish them achieving a large diffusion of the vtk4ar framework. As a matter of fact, it will soon be released under GNU/GPL license. Both libraries are cross platform, so all the porting problems have been bypassed (actually vtk4ar has been tested on Windows and Linux).
2.5.
Implementation
VTK4AR is born to be a framework to visualize all kinds of datasets in AR with the availability of all the functionalities implemented in VTK. VTK4AR is made up by a set of high level software classes to simplify the development of new AR applications. It can be considered as an extension of VTK with the support for AR. In fact, VTK has been extended with some classes, specific for the scientific visualization in AR. Furthermore, a set of classes for an easy and object oriented handling of the video camera and tracking system has been coded.
Compared to the medical applications [68][37][69], in which the virtual data and the real images were mixed by the hardware, vtk4ar is able to completely handle the application, natively supporting the video see-through and the video-tracking functionalities. Also compared to the technology used in the Studierstube applications, vtk4ar represents an improvement. In fact, in the above-mentioned works, there was a total decoupling between the scientific visualization system and the AR user interface (Studierstube). The AR scene was obtained exporting
Data-set Data
manipulation
3D scene
Camera Image Video
Tracking position camera
+ image AR
visualization data from the visualization system to Studierstube. As the authors also recognize, this approach has a bottleneck in the data conversion process that does not have to be repeated each time that visualization parameters change. Instead, vtk4ar allows a rapid implementation of all the interaction techniques for data manipulation, without any conversion.
The occlusion problem
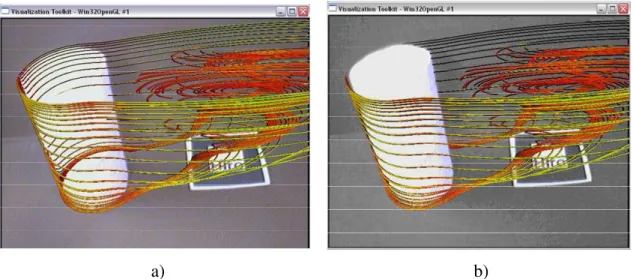
VTK4AR also manages the occlusion between real and virtual objects. As a matter of fact, one of the problems in AR visualization arises when real objects occlude 3D geometries, thus leading to a misunderstanding of the AR scene. In the case of CFD (Computational Fluid Dynamics) analysis of a cylinder such misunderstanding is shown in figure 13.a. If the streamlines are drawn superimposed on the real scene, the result is not realistic, because the streamlines “do not wrap” the cylinder. In figure 13.b the correct occlusion of the cylinder has been calculated. The data-set, employed in the example represented in figure 4, is a demo included in the VTK package.
a) b)
Figure 15: Streamlines wrapping a real cylinder without (a) and with (b) occlusion taken in account
In previous works the occlusion problem has been tackled with different methods, but two general approaches can be identified. The first approach, defined as “model-based”, implies that geometries of real objects are known. It means that
the model of the real object, correctly positioned in the virtual world, can be used to produce occlusions by drawing it in black. These models have to be placed in the correct position in camera coordinates to produce an image identical to the live video image of the real objects. In other words, when the geometric model is rendered, it appears at the same location and orientation in the computer-generated image as the real object in the live video. In the system presented in [70] the video output of the graphics workstation is combined with the output of a video camera using luminance keying.
If the geometric models of the real objects are unknown, the depth-based approach can be employed [71][72][73][74]. Depth information has to be written in the Z-Buffer before the rendering of the virtual objects occurs. With this approach, the model of the real world is acquired reconstructing the depth of the real environment from the point of view of the camera.
In our methodology, the geometrical models of the real objects are available, so a model based approach has been used. Occlusion handling has been implemented thanks to a proper class, which writes in the Z-Buffer only. The matter will be analyzed in depth later.
The ARToolKitHandle Library
In order to have an easy handling of the tracking and video libraries, and to have a full Object Oriented environment, the ARToolKitHandle, a C++ API for managing ARToolKit C libraries, has been developed.
The ARToolKitHandle library is made up of two main classes:
• ARVideoHandle class that provides an easy interface to the video devices; • ARVideoTracker that is an abstract class, implemented in
ARMonoMarkerTracker and ARMultiMarkerTracker classes, for managing mono-marker and multi-marker tracking.
Every ARVideoTracker object has associated an ARVideoHandle object, from which it acquires images that will be processed for tracking.
2.6.
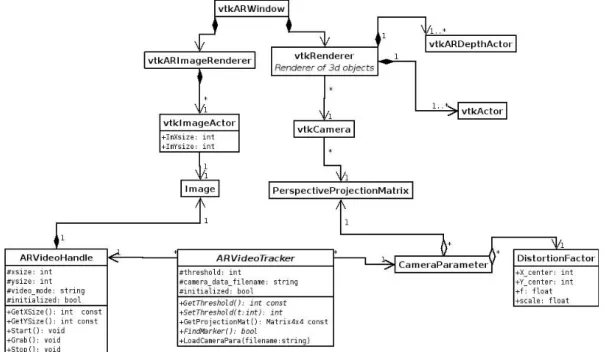
New VTK Classes for AR
The technique to obtain an AR scene is quite standard: virtual objects (i.e. the results of CAE analysis) must be rendered above the real scene obtained by the camera. To automate/mechanize the development of new applications, VTK4AR directly provides the developers with an environment made up by:
• a viewport to render virtual objects (vtkRenderer)
• a viewport to render the real image (vtkARImageRenderer)
• a window with two layers to contain the previously mentioned viewports (vtkARWindow).
The vtkRenderer class is a native class of VTK that renders actors (e.g.: 3D objects, data-set and images) in a window. Every vtkRenderer has its own camera, lights and actors.
The new class vtkARImageRenderer (directly derived from the vtkRenderer class) renders the camera grabbed images in the window. Every vtkARImageRenderer is linked by default to a ARVideoHandle object, which manages the camera, to generate the background image. Finally, the new class vtkARWindow contains a vtkARImageRenderer in the background and a vtkRenderer in the foreground.
In order to be able to display the occlusion between real and virtual objects correctly, a new class called vtkARDepthActor has been implemented. The main feature of this kind of actor is that it will be rendered in the Z-Buffer only. VtkARDepthActors must be rendered before the standard vtkActor. In this way, the depth-buffer is filled with the Z values of real objects, before virtual objects are rendered, and, therefore, only the visible parts of the virtual objects will be drawn.
2.7.
Case Studies
In this section three case studies of our methodology are presented.
The first case (figure 6) shows the results of a CFD simulation of the flow past a helmet. The application of our methodology to this case has four steps:
1. the CAD model of the product is obtained by means of reverse engineering techniques, in particular a 3D laser scanner Minolta Vivid 300 (VI-300) has been employed;
2. a CFD analysis is performed on this model using COSMOSFloWorks (www.solidworks.com) and the results have been exported in ASCII format; 3. the results are imported, through a data reader developed ad-hoc, in Paraview
(www.paraview.org). It is an open-source postprocessor, built on top of VTK and it has been employed to properly choose visualization parameters.
4. the processed data are visualized in AR with vtk4ar.
Figure 18: Virtual streamlines around a real helmet
The performance of the system, obtained in this test case, are reported in the table below. Two different visualization techniques have been tested: Stream surfaces (central image of figure 6) and stream lines (figure 7).
Table 1: Performances obtained with two different visualization techniques
Model Number of points Number of Polygons Frame Rate Stream-surfaces model 12270 532 Helmet model 1723 3442 ~28 fps Stream-lines model 29921 58828 Helmet model 1723 3442 ~20 fps
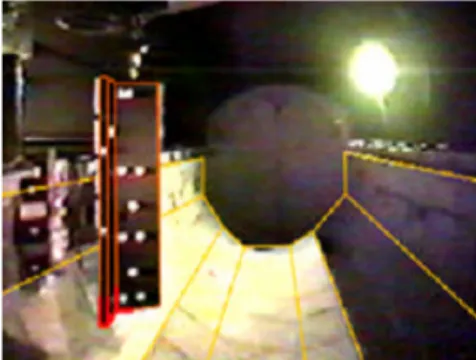
The second test case focuses its attention on the manufacture of an ankle support, which is made starting from what we can roughly call the “patient geometry”. As concerns production technology, Incremental Forming [75] has been utilized; in this kind of application, one of the main drawbacks is represented by the discrepancies between the desired shape and the obtained one. For this reason, a final evaluation of the manufactured product has been carried out at the end of the production step, using AR visualization. The methodology employed in this test case has five different steps:
5. the CAD model is generated starting from the patient ankle geometry, acquired by a 3D laser scanner;
7. the geometry of the prototype is acquired by a 3D laser scanner and the cloud of points, which represents the real product, is compared, in Pro-Engineer
environment (www.ptc.com), with the CAD model of the designed surface. This operation generates a map where, for each point, the discrepancy between the designed and the obtained shape is represented by a scalar value (discrepancies map);
8. the discrepancies map is visualized in AR superimposed to the prototype, so the user evaluates the accuracy of the forming process.
Figure 19: Schema of the methodology employed in the second test case
The marker needed for the optical tracking has been placed on the physical prototype of the ankle support before the scanning. The texture has been acquired using the camera integrated in the scanner, so the marker appears, drawn on the 3D model surface in the acquisition software. The user can easily determine the position and orientation of the marker in the CAD coordinate system, by retrieving the coordinates of some points belonging to the marker itself.
The data-set displayed in AR is composed by 15345 points and it is rendered as a point-set, which is a fast rendering technique. The frame-rate obtained is quite high (~29 fps) also because there is no need to consider the occlusion.
Due to the frame grabbing speed of the camera the frame rate of the application cannot exceed 30 fps.
a) b)
Figure 20: The cloud of points of the ankle support obtained with a 3D laser scanner (a) and the visualization of the discrepancies obtained in the forming
process (b).
As it is easy to understand, it is possible to use the framework for general visualization purpose, without following the methodology. In the third case study therefore, the framework has been employed in order to display data of an analysis of the flow field in the intake system of a high performance production engine motorcycle. In particular, the results of both numerical and experimental studies were visualized and compared employing the AR visualization system. The numerical simulation has been performed using Fluent 6.0, while the experimental results have been obtained using Laser Doppler Anemometry (LDA) techniques.
a ) b)
Figure 21: a) Experimental and Numerical comparison and b) stream-tubes of the flow field of the intake system
2.8.
Conclusion and Future Developments
Industrial engineering deals with many kinds of data-sets from numerical simulations, measurements or physical experiments. Often these data-sets have to be presented to non-technical people like customers or managers, but this requires that the visualization techniques have to be as easy and clear as possible. This work presents an innovative methodology that integrates different engineering technologies with augmented reality and scientific visualization, in order to achieve an effective way to present and analyze industrial engineering data. Our methodology allows the data to be displayed directly superimposed on the physical objects, so the user can more easily understand the meaning of the data-sets and their relations with the studied objects. The software framework VTK4AR has been developed to allow the rapid implementation of AR applications, based on this methodology. Moreover, VTK4AR is able to visualize in AR any kind of data supported by VTK, so it could be employed not only in industrial engineering applications, but in every field dealing with scientific visualization.
As concerns future developments, it is possible to implement a formal usability test to quantify benefits of this methodology, which must be weighted against the cost of preparation time. In fact, visualizing data in vtk4ar requires data to be imported in VTK and some alignment of real and digital objects to be carried out as previously described. This task requires an effort that depends on the data complexity, on the scene extension in which data are presented and on the number and the shape of physical objects that can occlude data.
Even if in the industrial practice it is very important to weigh benefits against costs, in some visualization tasks the use of augmented reality, not only improves the human-computer interaction, but it could represent a new useful tool.
Two possible future applications have been identified:
1. explain physical phenomena to students from scientific and technical faculties 2. compare numerical and experimental data
The latter is the case of some experimental analyses in which the results could not be expressed with numerical values. For example, in aerodynamic studies in the wind tunnel, techniques like smoke injection, placement of tufts or streamers into the flow [76] and pressure-sensitive paint [77] are used to obtain essential information to be used in the prediction of aerodynamic performance. This data can be retrieved and represented in a virtual environment [78], but by using augmented reality techniques the results of the same experiment, realized both physically and numerically, could be visualized at the same time, superimposed on the subject of the experiment. Comparing the results of a numerical simulation and the corresponding physical experiment in augmented reality; as a matter of fact, the user can perceive possible discrepancies between them immediately, making the refinement of the simulation parameters easier. Moreover, the employment of AR visualization in physical experiments can be crucial when material defects change the expected behavior, when numerical models are not accurate enough in predicting the real behavior.
Chapter 3.
An Integrated Environment For The Validation
In Virtual Reality Of The Dynamical Behavior Of
Functional Digital Mock-Ups
In the previous chapter an innovative way to explore numerical data has been presented. The previously described methodology can be useful when numerical data regard finite element analyses. However, numerical simulations can also be addressed to the simulation of the behavior of a mechanical system. In this case, numerical data can be computed dynamically, in order to animate the virtual prototype and faithfully reproduce the behavior of the mechanical system. In order to improve the comprehension of such simulations, the visualization can be performed in a Virtual Reality environment.
Virtual Reality (VR) technologies in fact, are widely employed in the Product Development Process (PDP) in several industrial sectors like automotive, aerospace, defense, bioengineering, etc.[79][80].
The main target of the VR in industry is the preview/foresight and the discovering of any possible design flaw before the realization of physical prototypes. The aid provided by VR is noticeable, since the user can interact with the virtual prototype in a very natural way. The earliest industrial VR applications merely provided the visualization of the digital mock-up (DMU) in VR in order to perform an aesthetical validation of the product. The DMU is the geometrical representation of a more or less complex product. DMU visualization in VR is crucial to exploit the overall appearance of the product, but it can also be useful in order to exploit part reachability, cabling, etc.
More recent applications instead, try to simulate in VR the real behavior of the industrial products, i.e. try to simulate the functional virtual prototype. In this way it is possible to use VR not only for aesthetical purposes, but also for discovering any functional flaw.
An example of the use of functional virtual prototypes in the PDP is presented by Bruno et. al. who describe a methodology for the usability assessment of an industrial product, based on the creation of a usability test, carried out in a virtual environment. This approach allows designers to conduct the test also in the first stages of the PDP without worrying about the realization of physical prototypes needed to perform the test with the user. Authors point out that the behavior of the digital mock-up employed in virtual usability tests has been generated by implementing the logic of the product interface inside the code of the virtual reality application and this approach entails several problems that will be discussed in section 3.2.
Figure 22: The functional virtual prototype implemented for usability tests
The lack of software tools able to support designers in the development of interactive and fully functional virtual prototypes is probably one of the main obstacles in the diffusion of VR techniques for the product behavior simulation. At the moment it is not possible to evaluate, in VR, models developed in simulation package. One of the few approaches devoted to the integration of simulation package and VR has been presented by Kirner et al. [81] who developed the VR-SIM, an object oriented C++ library, able to incorporate a Real-Time Systems (RTS) simulator with VR technologies. The use of VR-SIM involves the creation of the system to be validated and of a virtual environment related to this system. The case-study is a robot arm coupled to an automatic transport-belt, used in a factory for piling up boxes. This work demonstrates that VR technology is applicable and useful to support RTS simulations, as a form used to evaluate the correctness of such systems. But the VR-SIM is a tool addressed to software engineers responsible for the development of real-time,
process control systems, it requires code development for the implementation of the virtual product and it is not suitable to be used by industrial or mechanical engineers in the PDP.
A similar work has been presented by Sánchez et al.[83] who developed the Easy Java Simulation (Ejs) [84], a software tool designed to create interactive simulations in Java using models created with Simulink. Basically, Ejs is able to communicate with the Simulink model and to tightly control its execution. The communication takes place through a DLL library written in C and some utility Java classes. The main advantage of this work is that Ejs creates Java applets that are independent, multi-platform, which can be visualised using any Web browser, read data across the net and be controlled using scripts from within html pages. Ejs can also be used with Java 3D to create interactive virtual products in 3D, but it has been conceived mainly for educational purposes and it cannot be efficiently integrated into a PDP because Java 3D is not suitable for complex models visualization.
The aim of this work is the development of an environment for the evaluation and the validation of both the aesthetic and the functional part of an industrial product. To achieve this target, it is important to consider both the geometrical model and the behavioral model of the product and let them interact each other. The behavioral model considers the dynamic features of the product, due to its mechanical and electronics properties. From a mathematical point of view, it is a differential equations system, but it can be modeled and simulated using a Computer Aided Control Engineering (CACE) software and/or a multi-body solver. We can summarize everything saying that with the visualization software we can validate the geometric model of the product, and with the multi-body solver we can validate the mechanics and the dynamic of the multi-body model. Our purpose is “linking” the geometrical and the multi-body model in order to visualize in VR the functional virtual prototype of the industrial product.
In order to achieve our purpose, an high level software library for the inter-process communication (IPC) has been developed. This library let the simulation software communicate with the VR environment.
Figure 23: Framework architecture
We choose Matlab/Simulink as simulation software. This environment is almost a standard for the general purpose simulation. It is very diffused and versatile. Further, a lot of optional packages (called toolbox) are present. These packages provides further sets of high level operations for a specific task. In this work the SimMechanism toolbox has been used as multi-body solver. With the
SimMechanism toolbox it is possible to model and simulate a mechanic assembly, specifying properties for bodies and joints.
The software used as virtual environment are Division MockUp by PTC and Virtools Dev by Dassault Systemes. They will be described in the next sections.
3.2.
Division MockUp
Division MockUp provides several virtual environments visualization and exploration functionalities and, further, every application can be customized. Division MockUp in fact, provides an SDK for the plug-ins development, and a scripting language to create virtual environments.
Virtual environments are re-created using a VDI file, i.e. a plain ASCII file
containing the description of the virtual scene. It contains both the hierarchy of the
VR Env Sim Geometric Model Numerical Model IPC channel
assembly and the attributes of each part of the assembly. Division is made up by two software module: a low-level core called dVS, and an high level interface, called dVISE. Further, it is possible to use the EC library, i.e. an API to dVISE, in order to easily achieve the following tasks:
• Define new action funtions to customize assemblies’ behaviour. • Create assemblies, cameras, reference points and annotations • Execute functions on the assembly’s hierarchy
The communication between Division and Matlab can be synchronous or asynchronous. The sender (i.e. MATLab/Simulink) sends data deriving from the simulation in asynchronous mode using non-blocking sockets, and does not take care about the reception of the visualization environment. In this way, the simulator compute the simulation results also for the next simulation cycles, without stopping the computation.
Division instead, adopts the synchronous mode communication, using the blocking sockets. It stops its execution until it gets the message from MATLAB/Simulink. Once received, it moves the 3D model using the obtained information, and it sends the request for the new data. As it is easy to understand, a new thread take care of the communication. In this way the user can still interact with the 3D scene.
Resuming, Matlab/Simulink does not send new data computed for the next simulation cycles until a DIVISION request occurs. Division instead, stops the execution and waits for the whole data from Matlab/Simulink, then sends a data request to the simulator.
3.3.
The SIMLib library
In order to simplify the development of such applications, it is necessary the implementation of an high level communication library. This library should provide an easy to use IPC channel for the communication between the VR environment and the solver. Therefore, we implemented the SimLIB library. It is a