1
UNIVERSITY OF CALABRIA
Department of Biology, Ecology and Earth Sciences
PhD School “Life Sciences”
PhD in “Health, Ambient and Eco-sustainable Processes”
UNIVERSITY OF NAVARRA SUPPORTING
XXVII CYCLE
EXTRA VIRGIN OLIVE OIL INTAKE AND THE LOWER
LIKELIHOOD OF BEING OBESE, HYPERTENSIVE AND DIABETIC
BIO/09
Coordinator
Eminent Prof. Bruno de Cindio
Supervisors
Eminent Dr. Sergio Mazzulla
Eminent Dr. Pedro González Muniesa
PhD Student
Anita Schella
2
INDEX
ABBREVIATIONS
CHAPTER 1: ADIPOSE TISSUE DYSFUNCTION IN OBESITY
1.1 Introduction
1.2 The changing colour of fat 1.3 White adipose tissue 1.3.1 An overview 1.3.2 Cellular complexity
1.3.3 Secretory role of WAT: adipokines 1.4 Substrate and general metabolism 1.4.1 Glucose metabolism
1.4.2 Insulin Sensitivity
1.4.3 Lipid and Oxidative Metabolism
CHAPTER 2: PHARMACOLOGICAL STRATEGIES AND DIETARY SUPPLEMENTATION 2.1 Therapeutic intervention 2.2 Mediterranean diet 2.3 Olive oil 2.3.1 The plant 2.3.2 Cultivar 2.3.3 Extraction process 2.3.3.1 Collection 2.3.3.2 Washing 2.3.3.3 Crushing 2.3.3.4 Malaxation 2.3.3.5 Decantation 2.3.3.6 Filtration 2.3.4 Classification
2.3.5 Chemical composition: the phenolic compounds 2.3.5.1 Oleuropein: chemistry and biological effects
5 9 9 12 12 12 15 19 25 25 26 28 29 29 32 34 34 35 35 35 36 36 36 37 37 37 39 45
3
AIM
CHAPTER3
MATERIALS AND METHODS: AN IN VIVO STUDY
3.1 Animals
3.2. Spread Bio Oil processing 3.3 Plasma biochemistry analysis 3.4 Anthropometric assays
3.5 Western Blot analysis 3.7 Statistical analysis
CHAPTER 4 RESULTS
5.1 SBO processing
5.2 Plasma biochemistry analysis 5.4 Western Blot analysis
CHAPTER 5 DISCUSSIONS SUGGESTION CONCLUSION ACKNOLGMENT BIBLIOGRAPHY APPENDIX 1 51 52 52 52 53 54 54 54 55 55 55 56 56 59 62 63 64 65 92
5
ABBREVIATIONS
ADIPORs Adiponectin Receptor AKT Protein Kinase B
AMPK AMP-Activated Protein Kinase ANGPTL2 Angiopoietin Like Protein 2 Apo A-I Apoprotein AI
Apo B-I Apoprotein BI
APPL1 Adaptor protein, Phosphotyrosine interaction, PH domain and Leucine zipper containing 1
ATLG Adipose Triglyceride Lipase ATP Adenosine Triphosphate BAT Brown Adipose Tissue BMI Body Mass Index
BP Blood Pressure
C/EBPβ CCAAT/Enhancer Binding Protein beta C1q Complement C1q subcomponent CAV1 Caveolin 1 CCL2 Chemokine Ligand 2 CD36 Cluster of Differentiation 36 CD91 Cluster of Differentiation 91 COMT catechol-O-Methyl-Transferase CRP C-Reactive Protein CXCL5 CXC-Chemokine Ligand 5 DG Diglyceride EAT Exercise-Induced Activity
eNOS endothelial Nitric Oxide Synthase
ERKs Extracellular Signal-Regulated Protein Kinases EVOO Extra virgin olive oil
FA Fatty Acid
FAO Fatty Acid Oxidation
6
FAOSTAT Food and Agriculture Organisation of the United Nations FASN Fatty Acid Synthase
FDA Food and Drug Administration FFA Free Fatty Acid
GDP Guanosine Diphosphate
GI Gastrointestinal
GLUTs Glucose Transporters
GPCRs G-Protein-Coupled Receptors GTP guanosine triphosphate HBS Hexosamine biosynthesis HDL-C High-Density Lipoprotein HFD High-Fat Diet HIFs Hypoxia-Inducible Factors HMW High–Molecular Weight HOCXC9 Homeobox 9
HSL Hormone-Sensitive Lipase
HPLC High-performance liquid chromatography ILs Interleukins
NOS2 inducible Nitric Oxide Synthase
IOOC International Olive Oil Council IRS-1 Insulin Receptor Substrate 1 LCN2 Lipocalin 2
LDL-C Low-Density Lipoprotein
LDLR Low density lipoprotein receptor
LG Lipogenesis LMW Low–Molecular Weight LP Lipolysis LPS Lipopolysaccharide MCP-1 Monocyte Chemoattractant Protein-1 MCTs Monocarboxylate Transporters Med Diet Mediterranean Diet
MEKs Mitogen-Activated Protein Kinase MGL Monoacylglycerol Lipase
7
MMP-9 Matrix metallopeptidase 9 MMW Middle–Molecular Weight MUFA Mono Unsaturated Fatty Acids
NAMPT Nicotinamide Phosphoribosyltransferase NEAT Non Exercise-Induced Activity
NF-κB Nuclear Factor Kappa-Light-Chain-Enhancer of Activated B cells NPRA Atrial Natriuretic Peptide Receptor
OPO Pomace Olive Oil
p38MAPK p38 Mitogen-Activated Protein Kinases PAI-1 Plasminogen Activator Inhibitor 1 PDO Protected Designation of Origin PGE-2 Prostaglandin E2
PGI Protected Geographical Indication PGI2 Prostaglandine
p-HPEA p-Hydroxyphenil ethanol
p-HPEA-EDA Dialdehydic form of decarboxymethyl etenolic acid linked to p-HPEA PI3K Phosphatidylinositide 3-Kinases
PIP3 Phosphatidylinositol (3,4,5)-trisphosphate PKCs Protein kinases C
PKs Protein kinases
PPARGC1A Peroxisome Proliferator-Activated Receptor γ Coactivator 1α PPARs Peroxisome Proliferator-Activated Receptors
PTEN Phosphatase and Tensin Homolog PUFA Polyunsaturated Fatty Acids PYY Peptide Tyrosine Tyrosine RAF protein-serine/threonine kinase Ras Rat Sarcoma
RBP-4 Retinol-Binding Protein 4 RER Rough Endoplasmic Reticulum ROO Refined Olive Oil
ROS Reactive Oxygen Species RXR Retinoid X Receptor
8
SER Smooth Endoplasmic Reticulum SFA Saturated Fatty Acid
sFRP5 Secreted Frizzled-Related Protein 5 SGLT1 Sodium-Glucose Trasporter
SHOX2 Short Stature Homeobox 2 SNP Single-Nucleotide Polymorphism SOCS Suppressor of Cytokine Signaling S SOS Son of Sevenless
SR-A Steroid receptor RNA Activator
SREBP-1c Sterol Regulatory Element Binding Protein-1c T2D Type 2 Diabetes
TBX15 T-Box Transcription Factor 15
TFA Trans Fatty Acid
TFAM Transcription Factor A, Mitochondrial TGs Triglycerides
TLR Toll-Like Receptors
TNF Tumor Necrosis Factor UCP1 Uncoupling Protein-1
UNESCO United Nations Educational, Scientific and Cultural Organization USA United States of America
VAT Visceral Adipose Tissue
VCAM1 Vascular Cell Adhesion Molecule 1 VOO Virgin Olive Oil
WAT White Adipose Tissue
WHO World Health Organization WNT5a Protein Wnt-5a
ZIC1 Zinc Finger Protein 1
β-Ars β-adrenoreceptors
9
CHAPTER 1
ADIPOSE TISSUE DYSFUNCTION IN OBESITY
1.1 Introduction
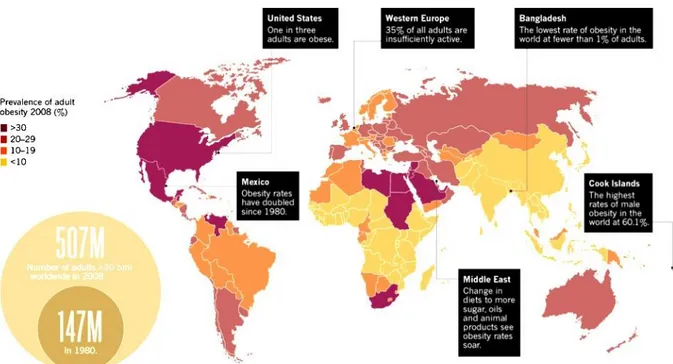
Obesity is a worldwide phenomenon which affects people from different cultural and economic backgrounds (WHO 2014), who tend to eat more fat and sugar, while reducing their intake of complex carbohydrates and dietary fibers. Globally, there has been an increase both in the amount of people consume and sedentary works. On the other hand, the modes of transportation and the increasing urbanization typically resulting in decreased of physical activity (Dean et al. 2014). In 2008 the WHO estimated that more than 35% adults aged 20 and over were overweight and 11% obese (Fig. 1). However in 2011 more than 40 million children under the age of five were overweight, with a raising to 2.1 billion in 2013 (Ng et al. 2014). Are considered overweight people who have a BMI between 25.0 and 29.9 and obese whose have a BMI of 30.0 (Table 1) (Anthes 2014).
Figure 1: Global Spread. World Health Organization estimation about aged-related overweight and obese individuals in 2008. Modified from Scully (Scully 2014).
10
Overweight Obese
BMI 25.0 – 29.0 (kg/m) BMI 30 (kg/m)
Table 1: Definition of overweight and obese people according with the BMI. Adapted from Anthes (Anthes 2014).
Like a multifactorial chronic disease, obesity is characterized by hypertrophy and hyperplasia of adipose tissue, as a result of imbalance energy intake versus energy expended (Chatzigeorgiou et al. 2014).
The energy intake is regulated by appetite (Kalra et al. 1999). During fasting, the regulation of food intake is mainly achieved by altering the expression of neurotransmitters such as norepinefrin, endorphin and pancreatic peptides (neuropeptide Y and peptide YY) . Upon food intake, in order to reduce food intake or induce satiety, suppressor appetite like dopamine, seroronin, calciton, cholecystokinin, and glucagon are secreted (Panickar 2013). The basal metabolism, the minimum energy expenditure required to maintain vital function, is ranged around 65% and 75% of the total energy expenditure (Suarez 2012). Its increase is closely associated to the percentage of lean mass that consume more energy, and decreases with age while increases with physical exercise (Suarez 2012).
The energy expended is regulated by basal metabolism, thermogenesis and physical activity (Astrup et al. 1997). Thermogenesis, the heat production which occurs primarily in BAT and skeletal muscle in response to the diet, is induced by activation of β3-ARs (Ricquier 2002; Arch 2008) and of AMPK signal pathway that stimulates the FA into mitochondria (Dulloo 2011). Physical activity, any movement of muscle mass that results in energy expenditure (Hills and Byrne 2004), can be divided into EAT and NEAT (Levine 2004). NEAT, ranged from 15-50 % of total calories (Levine et al. 2005), concerns activities which are physical but fall outside of exercise, such as pacing, fiddling, typing, talking, standing, and other occupational activities performed at work or school. Moreover, exercise is defined as vigorous activity, scheduled and repetitive in order to maintain or improve physical health (Hills and Byrne 2004).
Evidences have been suggested about the involvement of genetic factors (nutrigenomics and epigenetics) into appetite/satiety regulation in obesity susceptibility (El-Sayed Moustafa and Froguel 2013). It has been shown that nutrient intake can also influence gene expression (Bouchard and Ordovas 2012), providing a possible justification at the molecular level of how
11
nutrients and other food components interact with the genes (Marti et al. 2005). Among the different mechanisms that may be involved in the interindividual differences occurring in obesity, epigenetics has recently emerged (F. I. Milagro et al. 2013). They are defined as heritable changes in gene expression which occur without DNA sequences modifications, include DNA methylation, histone modifications and several types of micro RNAs (Fermin I. Milagro et al. 2011). In this context, epiobesigenes, such as PPARGC1A, PPARγ, SOCS1/SOCS3, TNFα and CAV1, have proposed (Campion, Milagro, and Martinez 2009). The expansion in scientific understanding of genetics, cellular and socio-economic influences has not translated into sustainable solutions for its prevention and treatment (Dean et al. 2014). Since the large variability in individuals’ responses, some leading scientists in the field presented an holistic approach for tackling obesity, the so called healthy weight management throughout life (Dean et al. 2014), a weight-loss treatment in term of genetic and epigenetic research, optimization of energy expenditure, food intake behaviour and lifestyle interventions.
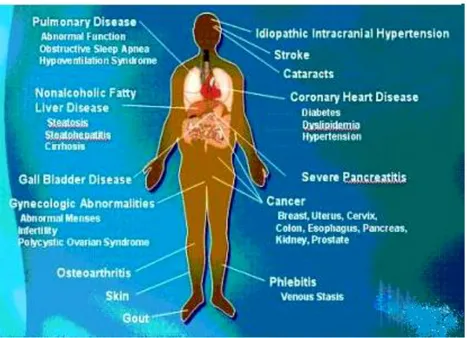
Currently, obesity which is associated with comorbidities such as T2D, cardiovascular diseases and hypertension (Fig. 2) (Dean et al. 2014), it’s become one of the leading threats to public health worldwide (WHO 2014).
12
1.2 The changing colour of fat
Adipose tissue is composed of three distinct forms, beige, brown and white, with fundamentally different functions. Beige cells express UCP1, that do not possess the complete molecular characteristics of that in brown adipocytes (Petrovic et al. 2010; Walden et al. 2012), Tbx 15, Shox2, Hoxc9 Zic1, unique marker of classical brown adipose tissue depots (Walden et al. 2012). It has been proposed that the formation of beige cells is stimulated by irisin, a hormone produced by skeletal muscle in response to exercise The stimulation of lipolysis and the activation and regulation of thermogenesis during chronic exposure to cold are regulated through the release of noradrenaline, which interacts with a β3-AR on the plasma membrane of adipocytes (Arch 2008).
BAT is specialized for the oxidation of FA, through the presence of UCP1, a specific mitochondrial protein which dissipates heat generation by non shivering mechanisms, dispersing the proton gradient across the inner mitochondrial membrane (Ricquier and Bouillaud 2000; Cannon and Nedergaard 2004). Heat generation by BAT may be evoked for thermoregulation, to dissipate calories excess as a mechanism for the maintenance of energy balance, or body weight (Cannon and Nedergaard 2004; Cannon and Nedergaard 2009), and for the arousal from hibernation (Cannon and Nedergaard 2004). It has been proposed that the termogenic gene expression in brown fat may involve the macrophages activation which in turn stimulate catecholamines realese (Nguyen et al. 2011).
WAT is specialized on fuel storage rather than for the oxidation of stored fatty acids, providing substrate to other tissues such as muscle during fasting and periods of high energy demand. Its function and regulations are largely discussed in the next sections.
1.3 White adipose tissue
1.3.1 An overview
White adipose tissue (WAT) forms a layer called the panniculus adiposus or hypodermis in the connective tissue under the skin that provides a significant thermal insulation against cold by reducing the rate of heat loss. It is richly supplied with blood vessels, and surrounded by reticular fibers (type III collagen), which are secreted by the adipocytes. Special stains also reveal the presence of unmyelinated nerve fibers and numerous mast cells (Ross and Wojciech) (Table 2).
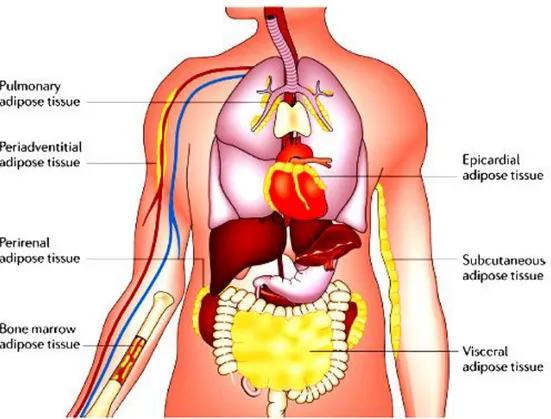
The two most abundant depots are visceral and subcutaneous adipose tissues, which produce unique profiles of adipokines (Fried, Bunkin, and Greenberg 1998; Samaras et al. 2010), but
13
also takes place throughout the body in association with multiple organs, including heart, kidneys, bone marrow, lungs and the adventitia of major blood vessels (Fig. 3).
Features White Adipose Tissue
Location Subcutaneous layer, mammary gland, greater omentum, mesenteries, retroperitoneal space, visceral pericardium,
orbits (eye sockets), bone marrow cavity Function Metabolic energy storage, insulation, cushioning,
hormone production, source of metabolic water Adipocyte morphology Unilocular, spherical, flatten nucleus, rim of cytoplasm
Large diameter (15–150 µm) Transcription factors “master switch” in
differentiation UCP-1 genes expression
Mitochondria Innervation Vascularization
Response to environmental stress (cold exposure)
Growth and differentiation
PPAR-γ/RXR
No
Few, poorly developed Few sympathetic nerve fibers
Few blood vessels
Decreased lipogenesis. Increased lipoprotein lipase activity
Throughout entire life from stromal-vascular cells Table 2: A summary of white adipose tissue features.Adapted from Ross and Wojeciech (Ross and Wojciech,
2010).
It has been shown that high-calorie diets can promote the development of a pro-inflammatory state in these depots in a similar manner to that observed in subcutaneous and visceral adipose tissue (Chatterjee et al. 2009). Although the functional importance of many of these individual adipose depots is generally not known, evidence suggests that diet-induced changes in their adipokine secretion can influence the function of the associated tissue (Takaoka et al. 2009). The amount of an individual’s adipose tissue is determined by two physiological systems: one associated with short-term weight regulation and the other one with long-term weight regulation. The first system controls appetite and metabolism on a daily basis through two small peptide hormones produced in the gastrointestinal tract, ghrelin, an appetite stimulant, and PYY, an appetite suppressant (Ross and Wojciech, 2010). Ghrelin is a small 28-amino-acid polypeptide produced by gastric epithelial cells, which in addition to its appetite stimulatory role, acts on the anterior lobe of the pituitary gland to release growth hormone. In humans, ghrelin increases the sense of hunger through receptors located in the hypothalamus. PYY is a small 36-amino-acid gastrointestinal hormone produced by the small intestine that as well to its appetite suppressor role through receptors in the hypothalamus, promotes and maintains weight loss by inducing a greater sense of fullness soon after a meal and desire to
14
stop eating. In experimental clinical studies, the infusion of PYY into humans has been shown to reduce food intake by 33% over a period of 24 hours (Ross and Wojciech, 2010).
Figure 3: Adipose tissue depots. Under conditions of obesity, adipose tissue expands in these and other depots throughout the body. Common sites of adipose tissue accumulation include the heart, the kidneys and the adventitia of blood vessels. From Noriyuki Ouchi et al. (Noriyuki Ouchi et al. 2011).
The second system controls appetite and metabolism on a continual basis (over months and years) and it is influenced by leptin and insulin, along with other hormones, including thyroid hormone, glucocorticoids, and hormones of the pituitary gland.
Leptin, identified in ob/ob mice by positional cloning, regulates the amount of fat stored in the body. In experimental animal models, the addition of recombinant leptin to obese, leptin-deficient ob/ob mice causes them to reduce their food intake and lose about 30% of their total body weight after 2 weeks of treatment. Unlike mutant mice, in most obese humans, levels of leptin mRNA in adipose tissue as well as serum levels of leptin are elevated.
Insulin is a pancreatic hormone that regulates blood glucose levels and enhances the conversion of glucose into triglycerides by the adipocyte. Like leptin, insulin regulates weight by acting on brain centers in the hypothalamus, but in contrast to leptin, insulin is required for the accumulation of adipose tissue.
15
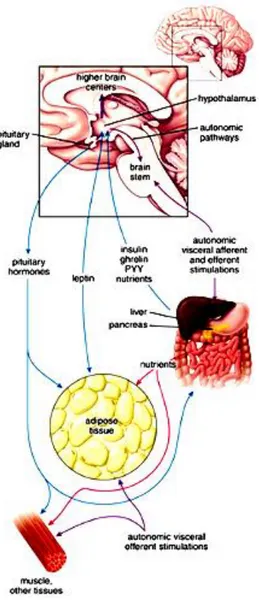
alimentary tract, and central nervous system form the brain–gut–adipose axis that regulates appetite, hunger, satiety, and energy homeostasis (Fig. 4). In fact, WAT is innervated by sympathetic nerve endings, being the sympathetic system the principal physiological mediator of lipolysis (Hales, Luzio, and Siddle 1978) with marked activation occurring in situations where there is net lipolysis (Garofalo et al. 1996; Migliorini, Garofalo, and Kettelhut 1997).
Figure 4: Regulation of energy homeostasis. This schematic diagram shows the relationship between adipose tissue, digestive processes and functions of the central nervous system. From (Ross and Wojciech, 2010).
1.3.2 Cellular complexity
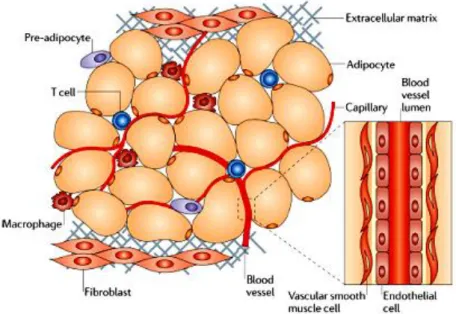
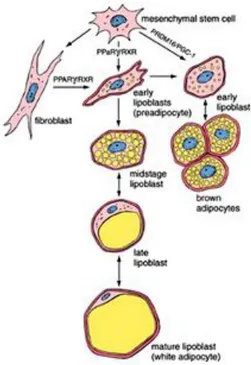
WAT is mainly comprised of adipocytes, although other cell types contribute to its growth and function, including fibroblasts, vascular cells and immune cells (Fig. 5). Adipocytes are derived from undifferentiated mesenchymal stem cells associated with the adventitia of small venules (Fig. 6). Current evidence suggests that PPARγ in complex with the RXR play a
16
critical role in adipocyte differentiation and initiation of lipid metabolism. It induces the maturation of early lipoblasts (adipoblasts) or preadipocytes into fat cells. Most of the PPARγ target genes in adipose tissue influence lipogenic pathways and initiate the storage of triglycerides. Therefore, PPARγ/RXR is regarded as the “master switch” regulator in the white adipocytes’ differentiation (Ross and Wojciech, 2010).
Figure 5: Components of adipose tissue. Adipocytes are the main cellular component of adipose tissue, and they are crucial for both energy storage and endocrine activity. The other cell types that are present are precursor cells (including pre-adipocytes), fibroblasts, vascular cells (endothelial cells and vascular smooth muscle cells) which are associated with the major blood vessels and immune cells (macrophages and T cells). These last type of cells constitute the stroma vascular fraction of adipose tissue. From Noriyuki Ouchi et al. (Noriyuki Ouchi et al. 2011).
When isolated, white adipocytes are spherical, but they may appear polyhedral or oval when crowded together in adipose tissue. Their large size is due to the accumulated lipids in the cell that are deposited in a single unilocular droplet occupying the central portion of the cytoplasm. The nucleus is flattened and displaced to one side of the lipid mass; the cytoplasm forms a thin rim around the lipid (Ross and Wojciech) (Fig. 7). The perinuclear cytoplasm contains a small Golgi apparatus, free ribosomes, short profiles of RER, microfilaments, and intermediate filaments.Filamentous mitochondria and multiple profiles of SER are also found in the thin rim of cytoplasm surrounding the lipid droplet (Ross and Wojciech, 2010).
17 Figure 6: Development of adipose tissue. Like all connective tissue cells, adipocytes are derived from undifferentiated mesenchymal stem cells. From Ross and Wojciech (Ross and Wojciech, 2010).
Figure 7: WAT. Photomicrograph of WAT showing its meshwork profiles. From Ross and Wojciech Ross and Wojciech, 2010).
Interest has been paid to the status of the vasculature in adipose tissue, showing that obesity can lead to capillary rarefaction in adipose tissue leading to localized hypoxia (J. Ye et al. 2007; Pasarica et al. 2009). Theoretically, a restriction of blood flow adipose tissue could contribute to an inflammatory state, possibly as a result of ischaemia-induced adipocyte necrosis and the subsequent recruitment of macrophages. Furthermore, obesity leads to the
18
downregulation of anti-inflammatory factors and the upregulation of pro-inflammatory factors that activate endothelial cells and promote a dysfunctional phenotype (Takaoka et al. 2009). In turn, the activated vascular endothelium expresses adhesion molecules and chemotactic factors that accelerate and localize inflammatory processes.
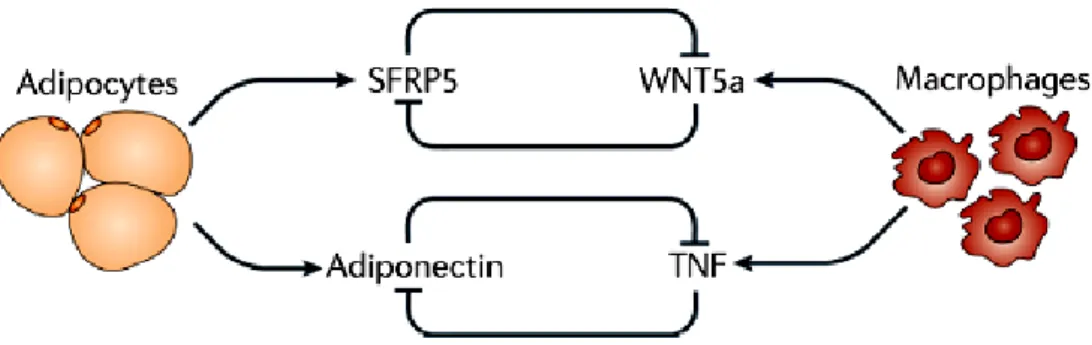
Fibroblasts produce extracellular matrix components. It has been shown that metabolically dysfunctional adipose tissue produces excess matrix components that may interfere with adipose mass expansion and contribute to metabolic dysregulation (T. Khan et al. 2009). The intercellular communication within adipose tissue is required for normal metabolic function. Examples of this, include the counter-regulation between adiponectin and sFRP5, adipocyte derived anti-inflammatory factors, and the TNF and WNT5a, which are macrophage-derived pro-inflammatory factors. Under conditions of obesity, TNF and WNT5a are upregulated, whereas adiponectin and sFRP5 are downregulated (Noriyuki Ouchi et al. 2003; Berg and Scherer 2005; Noriyuki Ouchi et al. 2010) (Fig. 8).
Figure 8: Examples of intercellular communication between different adipose tissue cell types include the counter-regulation between adiponectin and TNF, and between SFRP5 and WNT5a. Under conditions of obesity the pro-inflammatory factors (TNF and WNT5a) predominate. From Noriyuki Ouchi et al. (Noriyuki Ouchi et al. 2011).
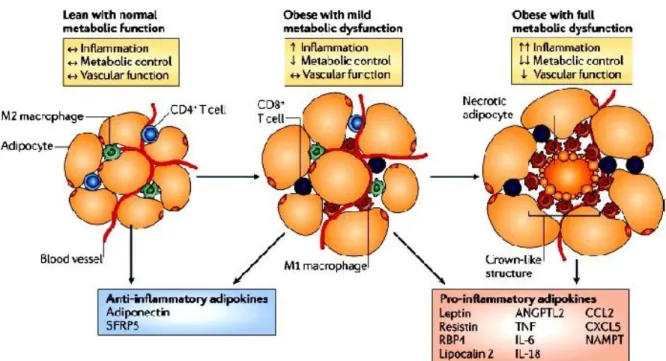
Macrophages are particularly important in the inflammatory response that occurs in the tissue as obesity develops, and the obese state is associated with a major recruitment of these cells (Xu et al. 2003; Weisberg et al. 2003; Cancello et al. 2005). Because a key function of macrophages is to remove apoptotic cells in an immunologically silent manner to prevent the release of noxious substances, their presence as crown-like structures in adipose tissue may reflect a pro-inflammatory state that is due, in part, to an impairment of the macrophage-mediated phagocytic process (Fig. 9). According with this notion, is the finding that the induction of adipocyte apoptosis in an inducible mouse model of lipoatrophy leads to macrophage accumulation in adipose tissues (Pajvani et al. 2005). However, the process may
19
be more complex as a recent paper has reported that adipocyte death is not increased by obesity in humans (Spalding et al. 2008).
Figure 9: Phenotypic modulation of adipose tissue. As obesity develops, adipocytes undergo hypertrophy promoting the transition to a metabolically dysfunctional phenotype. This generates large amounts of pro-inflammatory factors, including leptin, resistin, RBP4, lipocalin 2, ANGPTL2, TNF, IL-6, IL-18, CCL2, CXCL5 and NAMPT. Metabolically dysfunctional adipose tissue can be associated with higher levels of adipocyte necrosis, and M1 macrophages are arranged around these dead cells in crown-like structures. From (Noriyuki Ouchi et al. (Noriyuki Ouchi et al. 2011).
1.3.3 Secretory role of WAT: adipokines
WAT metabolic function is mediated by the secretion of numerous proteins that are collectively referred to as adipokines, which by exerting their biological roles in autocrine, paracrine, or systemic manner, influence several physiological processes concerning energy, glucose metabolism and immunity (Waki et al. 2003) (Fig. 10).
Adipose tissue from lean individuals preferentially secretes anti-inflammatory adipokines such as adiponectin, TGF , IL-10, IL-4, IL-13, IL-1Ra and apelin, while obese adipose tissue mainly releases proinflammatory cytokines which are TNF-α, IL-6, leptin, visfatin, resistin, angiotensin II, and PAI-1 (Noriyuki Ouchi et al. 2011).
Adipokines enlisted in regulation of insulin resistance as well as in immunity and inflammation are: adiponectin, leptin, resistin, visfatin, chemerin, TNF- , IL-1, IL-6, IL-8, IL-10, PAI-1, MCP-1 and RBP-4 (Table 3).
20 Figure 10: Illustration of the major physiological and metabolic processes with which adipose tissue is involved through the secretion of various adipokines from adipocytes. The interactions may be autocrine, paracrine, or endocrine. From Trayhurn (Trayhurn 2013).
Adipokine Distribution Function Situation in obesity
Adiponectin Only secreted by adipose tissue. Lower production in men
Insulin sensitizing effect. Improves insulin resistance and
glucose metabolism
Decreased in mouse models and in human
and
correlated negatively with BMI. Increased after weight
loss Chemerin In rodents and humans,
expressed in placenta and WAT
Regulates adipocyte development and metabolic function Circulating levels in T2D patients and correlated with body fat, glucose, and
lipid metabolism IL-1 Secreted mainly by adipocytes
and macrophages
Role in macrophages chemotaxis and
thermogenesis
In mice and human. Predictive of T2D
IL-6 Secreted predominantly by adipocytes for one-third of total circulating
levels, in macrophages, skeletal muscle, endothelial cells,
and fibroblasts
Controversial role in the development of insulin resistance.
Affects glucose metabolism
In human and correlated with adiposity and reduced
with weight loss. In plasma of T2D
patients IL-8 Secreted by adipocytes (visceral
WAT > subcutaneousWAT) and Macrophages
Neutrophil chemotaxis In subjects and related to fat mass and TNF-
levels IL-10 Secreted by monocytes,
macrophages, dendritic cells, and B and T cells
Improves insulin sensitivity and glucose
transport
Attenuated in T2D patients and increased with weight
loss Leptin Predominantly WAT and to a lesser
degree in
hypothalamus, gastric epithelium, placenta, and gonads
Regulates energy intake, expenditure, feeding behavior, storage of fat
and insulin signaling
Mouse and human models and correlated with BMI
21 weight loss MCP-1 Secreted by adipose tissue Affects insulin
sensitivity and increases macrophage recruitment
in adipose tissue and inflammation
Increased in mouse models of obesity.
Increased in T2D subjects
PAI-1 Expressed by WAT Potent inhibitor of
fibrinolytic pathway
In human and T2D subjects Resistin In rodents, secreted by
adipocytes and in humans predominantly by circulating macrophages and monocytes and to
a lesser degree by WAT
Regulation of neoglucogenesis and insulin resistance in rodents. Proinflammatory role in humans
In mouse models and in
human correlated with insulin resistance in
diabetic patients
RBP4 Secreted by adipocytes, macrophages, and hepatocytes
Affects insulin sensitivity, hepatic glucose output, and
muscle insulin signaling
Circulating levels in subjects and correlated
with BMI and insulin resistance
TNF-α Expressed by macrophages and adipocytes (visceralWAT >
subcutaneousWAT)
Provokes insulin resistance and stimulates
lipolysis
Mouse models and in human correlated
with BMI Visfatin Expressed in liver, muscle,WAT,
bone marrow, and lymphocytes
Role in insulin sensitivity, insulin
secretion and inflammatory properties
Correlates with visceral adiposity in humans
Table 3: Adipokines increased in obesity and/or diabetes. Modified from Makki et al. (Makki, Froguel, and Wolowczuk 2013).
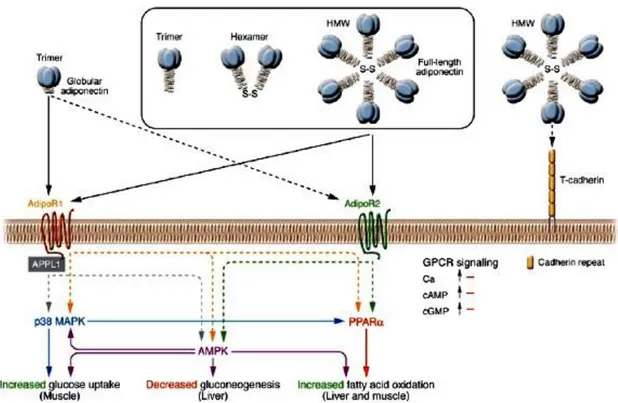
Among all the adipokines, adiponectin (also known as ACRP30 and ADIPOQ) was identified as an adipocyte-specific adipokine (Scherer et al. 1995; Hu, Liang, and Spiegelman 1996). It exists in a wide range of multimer complexes in plasma and combines via its collagen domain to create three major oligomeric forms: a LMW trimer, a MMW hexamer, and HMW 12- to 18-mer adiponectin (Pajvani et al. 2003; Waki et al. 2003) (Fig. 11). HMW is the most biologically active form and best reflective of the reduction in total adiponectin levels associated with obesity (Ryo et al. 2004). This association is related to clinical observations that plasma adiponectin levels are negatively correlate with visceral fat accumulation (Ryo et al. 2004) and decreased in patients with T2D (Noriyuki Ouchi et al. 2003). With this regard, it has been proposed that reduced adiponectin levels caused by interactions between genetic factors, such as SNP 276G>T in the adiponectin gene itself, and environmental factors causing obesity, i.e. such as a HFD and a sedentary lifestyle, may play a crucial role in the development of insulin resistance, type 2 diabetes, and the metabolic syndrome (Kadowaki et al. 2006) (Fig. 12).
22 Figure 11: Signal transduction by adiponectin receptors. Globular adiponectin exists as a trimer, whereas full-length adiponectin exists as at least 3 species of multimers: an LMW trimer, an MMW hexamer, and an HMW multimer. AdipoR1 and AdipoR2 serve as receptors for globular and full-length adiponectin and mediate increased AMPK, PPARα ligand activities, p38MAPK, and adiponectin-induced biological functions. T-cadherin is capable of binding adiponectin but is thought to have no effect on adiponectin cellular signaling, since T-cadherin lacks an intracellular domain (Hug et al. 2004). Interaction of APPL1 with AdipoR1 appears to play important roles in adiponectin signaling and adiponectin-mediated downstream events such as lipid oxidation and glucose uptake (Mao et al. 2006) S-S, disulfide bond. From Kadowaki (Kadowaki et al. 2006).
Figure 12: Adiponectin hypothesis for insulin resistance, metabolic syndrome and atherosclerosis. Interactions of genetic and environmental factors reduce adiponectin levels, appearing to play an important causal role in the development of insulin resistance, T2D and metabolic disease, thereby indirectly causing atherosclerosis. From Kadowaki et al.(Kadowaki et al. 2006).
23
Consistent with these, adiponectin-deficient mice develop hypertension and impaired endothelial cell-dependent vasodilation when fed an atherogenic diet (Li et al. 2007), and its disruption also leads to the enhancement of salt induced hypertension resulting in reduction of eNOS expression (Ohashi et al. 2006) and increased T cell accumulation in atheratoma (Okamoto et al. 2008). The formation of atherosclerotic lesions is inhibited by decreasing the expression of SR-A, TNF and VCAM1 (Okamoto et al. 2002; Toshimasa Yamauchi et al. 2003). In acordance with these, it has been reported that the homeostasis of the vascular function is promoted through the activation of AMPK–eNOS signalling pathway and of PGI2 (Ohashi et al. 2009). However, a recent study did not find an association between atherosclerosis and levels of circulating adiponectin, in the LDLR-deficient mouse model (Nawrocki et al. 2010).
Administration of adiponectin to diabetic mice has been shown to reduce hyperglycaemia by enhancing insulin activity (Berg and Scherer 2005), while given to obese mice it increases fatty acid oxidation in muscle tissue, reduces plasma levels of glucose, free fatty acids and triglycerides (Fruebis et al. 2001). In line with these observations, adiponectin deficient mice develop exacerbated diet-induced insulin resistance (Maeda et al. 2002; Nawrocki et al. 2006), whereas transgene-mediated overexpression of adiponectin in ob/ob mice improves glucose metabolism independently of weight loss (J.-Y. Kim et al. 2007). These beneficial effects on insulin sensitivity seem to be mediated in part by its ability to activate AMPK in skeletal muscle, increasing fatty acid oxidation and glucose uptake, and inhibiting gluconeogenesis in liver (Tomas et al. 2002; T. Yamauchi et al. 2002) through interactions with its cell surface receptors, AdipoR1 and AdipoR2 (Toshimasa Yamauchi et al. 2003) (Fig. 11). AdipoR1 is ubiquitously expressed, including abundant expression in skeletal muscle, whereas AdipoR2 is most abundantly expressed in the mouse liver. These receptors appear to be integral membrane proteins, with the N-terminus internal and the C-terminus external, opposite to the topology of all other reported GPCRs (Toshimasa Yamauchi et al. 2003) (Fig. 13).
The roles of these receptors in mediating the metabolic actions of adiponectin in vivo are controversial and incompletely understood. AdipoR1 deficiency results in reduced adiponectin-induced AMPK activation, increased glucose production and impaired insulin resistance, whereas AdipoR2 deficiency causes decreased activity of PPARα signalling pathways, attenuates high-fat diet-induced insulin resistance, but exacerbates glucose intolerance after long-term exposure to a high-fat diet, presumably owing to the dysfunction
24
of pancreatic β-cells (Bjursell et al. 2007; Toshimasa Yamauchi et al. 2007; Y. Liu et al. 2007). The deletion of both receptors abolishes adiponectin binding and actions leading to exacerbation of glucose intolerance.
Several studies have investigated the ability of adiponectin to suppress pro-inflammatory cytokine production. Adiponectin levels are negatively correlated with CRP levels in obese or diabetic patients, conversely in non-diabetic or healthy subjects (Noriyuki Ouchi et al. 2003). Additionally, adiponectin deficient mice have higher levels of TNF mRNA in adipose tissue and TNF protein in the blood (Maeda et al. 2002) and these parameters were restored to normal levels on administration of adiponectin. It is also known its role in controlling inflammation by mediating modulation of macrophage function and phenotype. It inhibits the transformation of macrophages into foam cells, abrogates LPS-stimulated TNF production (Yokota et al. 2000), TLR-mediated NF-κB activation and reduces intracellular cholesteryl ester content in human macrophages by suppressing the expression of class SR-A (N. Ouchi et al. 2001). Evidences suggest that adiponectin mediates modulation of macrophage function and phenotype, exerting its role in controlling inflammation, although the receptor-underlye pathways in these cells are poorly understood. Peritoneal macrophages and adipose tissue stromal vascular fraction cells of adiponectin-deficient mice show increased expression of pro-inflammatory M1-type markers and decreased expression of anti-inflammatory M2-type markers (Ohashi et al. 2010). Conversely, the systemic delivery of adiponectin to mice stimulates arginase 1 expression by these cells, and stimulation of cultured macrophages with recombinant adiponectin results in an increase in the levels of M2-type markers and a reduction in ROS generation (Ohashi et al. 2010). Because M2-like phenotype in macrophages is induced by the phagocytosis of early apoptotic cells (Savill et al. 2002), it has been suggested that adiponectin can function as a collectin protein. With this regard, similar to collectin protein like C1q and surfactant proteins A and D, adiponectin can binds to calreticulin and CD91 expressed on the apoptotic cells surface, facilitating their uptake by macrophages (Takemura et al. 2007). Despite its actions, the adiponectin receptor-mediated signalling in macrophages is poorly understood.
25 Figure 13: Structure of ADIPORs. AdipoR1 and AdipoR2 are predicted to contain 7 transmembrane domains but are structurally and topologically distinct from GPCRs. Modified from (Kadowaki et al. 2006).
1.4 Substrate and general metabolism
1.4.1 Glucose metabolism
WAT is a net exporter of lactate, particularly in obesity (Hosogai et al. 2007; Hodson et al. 2013) where the percent of glucose converted to lactate - correlated directly with fat cell size- is as much as 70% (Marin et al. 1987).
As adipose tissue mass increases, hypoxia develops in adipose tissue, leading to a switch into anaerobic metabolism, so more glucose is catabolized to lactate rather than oxidized through the citric acid cycle (Trayhurn 2014). The rise in lactate production in hypoxic adipocytes involves the recruitment of MCTs (Halestrap and Meredith 2004; Perez de Heredia, Wood, and Trayhurn 2010; Halestrap and Wilson 2012) for the remove of monocarboxylate, preventing cellular toxicity by the metabolites. Human adipocytes have been shown to express three family members called MCT1, MCT2, and MCT4. It has been suggested that both their transcription and expression levels are regulated through HIF-1, leading to a decreasing of MCT2 and a stimulation of MCT1 and MCT4 expression, but only MCT1 protein levels are increased (Perez de Heredia, Wood, and Trayhurn 2010).
Recent evidence suggests that lactate run as a signaling factor (Rooney and Trayhurn 2011), inducing insulin resistance in skeletal muscle (Choi et al. 2002), stimulation of inflammation in macrophages (Samuvel et al. 2009) and the inhibition of lipolysis in adipocytes (C. Liu et al. 2009). This findings raise the possibility of lactate shuttling between adipocytes and other cells within adipose tissue (Doherty and Cleveland 2013).
The increase in glucose uptake in adipocytes exposed to hypoxia implies increased hexose transport (Trayhurn 2013). Among the several members of GLUTs, GLUT1 gene expression and protein levels are markedly increased for several days in murine and human adipocytes in
26
response to hypoxia, accompanied with a substantial fall in GLUT4 gene expression by 48 h (Trayhurn 2014). It seems that glucose uptake in hypoxic adipose tissue is modulated by HIF-1 system (Trayhurn 20HIF-14). Transgenic mice with a selective knockdown of HIF-HIF-1β in adipose tissue exhibit a decrease in 2-deoxy-glucose uptake accompanied by a reduction in GLUT1 and GLUT4 gene expression, while in 3T3-L1 adipocytes it has been shown to result in a fall in GLUT1 and GLUT4 protein (Lee et al. 2011).
Although the induction of GLUT-1 expression is frequently utilized as a marker for the cellular response to low PO2, and GLUT4-mediated glucose uptake may be compromised by
chronic exposure to hypoxia, several other GLUTs are expressed. With this regard, authors have suggested GLUT12 as a potential therapeutic target linked to insuline resistance (Pujol-Gimenez et al. 2013), although it has been reported that this transporter is expressed in all the major human and rats depots, but not in 3T3-L1 cells (Wood, Hunter, and Trayhurn 2003). The interest about this facilitative transporter is due to a direct relation with the glycolytic metabolism of normal human skeletal muscle, where in response to insulin GLUT12 is translocated to the plasma membrane together with GLUT4 (Stuart et al. 2009). Conversely, basing on a recent study, seem that the expression of GLUT12 is increased in the diabetic myocardium, potentially as a compensatory mechanism for the observed downregulation of active GLUT4, and may probably be functioning as a basal non-insulin dependent GLUT located primarily at the cell surface (Waller et al. 2013). Even though informations about GLUT12 have been released, still little is known about its functional characteristics and its physiological role.
1.4.2 Insulin Sensitivity
Insulin stimulated glucose uptake is one of the fundamental mechanisms responsible for the maintenance of glucose homeostasis in the body. Impaired insulin action or insulin resistance which occurs in obesity leads to TD2 (Hotamisligil 2000; Kopelman 2000) whose risk increases by more than tenfold for those with a BMI of 30 (Trayhurn 2014).
Insulin-sensitizing action is linked to an impaired state between adiponectin secretion, that decreases under conditions of low PO2, and the release of IL-6 that raises, conversely
(Trayhurn 2014).
It seems that the antilipolytic action of insulin in WAT is dysregulated by hypoxia (T. Yamauchi et al. 2001; Berg and Scherer 2005; Wang, Wood, and Trayhurn 2007) and that this effect is driven by both HIF-1 and HIF-2, since their overexpression mimics the effects of low
27
PO2 (Regazzetti et al. 2009), while their inhibition attenuates the hypoxia-induced
downregulation of the insulin signaling pathway. This is a consequence of a reticence in the insulin-induced phosphorylation of IR-β and IRS-1.
In the insulin signaling cascade, PI3K and PTEN play a central role (Taniguchi et al. 2006). For the first time, authors reported that PIP3 increases GLUT4 surface expression and glucose uptake as well as glucose utilization at the cellular level mediated by AKT/PKCς/γ phosphorylation (P. Manna and Jain 2013). This raises the suggestion that defects in insulin stimulated glucose metabolism in T2D are due to the uncoupling of AKT/PKCς/γ /GLUT4 signaling pathways, which may in turn be linked with the decreased production of PIP3 in the hyperglycemic environment (P. Manna and Jain 2013).
It is well known that after insulin binding to the receptor, IRS-1 is phoshorylated and PI3K activated. This last one catalyzes the addition of a phosphate group to the membrane lipid PIP2, converting it to PIP3 that can be transformed by PTEN back to PIP2. PIP3 binds Akt, that catalyzing the phosphorylation of key proteins, leads to an increase in glycogen synthase activity and recruitment of GLUT4 to the membrane (Hemmings and Restuccia 2012) (Fig. 14).
On the other hand, IRS-1 can activate Ras-MAPK pathway that lead to recruitment of GRB2 binds to the guanine nucleotide exchange factor SOS activating it (Zarich et al. 2006). Activated SOS then promotes the removal of GDP from a member of the Ras subfamily that can bind GTP and become active. Activated Ras make actives RAF kinase that in turns activates MEK1 and MEK2 and sequentially ERKs (Avruch et al. 2001). The series of kinases from RAF to MEK, and to MAPK, is an example of a protein kinase cascade. Such series of kinases provide opportunities for feedback regulation and signal amplification.
28 Figure 14: Insulin cascade signaling. When insulin receptor binds insulin, the active receptor phoshorylates the IRS-1 activating PI3-kinase. This one catalyzes the addition of a phosphate group to the membrane lipid PIP2, thereby converting it to PIP3 that can be converted by PTEN back to PIP2. PIP3 binds Akt, that catalyzes phosphorylation of key proteins, leading to an increase in glycogen synthase activity and recruitment of GLUT-4 to the membrane. Modified from Pearson Education, Inc 2012.
1.4.3 Lipid and Oxidative Metabolism
Adipocytes store extra energy in the form of TGs inside lipid droplets or LDL-C. When a continuous storing of TGs occurs, adipocytes must expand in size and become stressed to synthesize more proteins for LDL-C formation (Zha and Zhou 2012). So, they secrete multiple cytokines that activate resident and circulating macrophages forming the signature “crownlike structures” found in obese tissue (Surmi and Hasty 2008). During this cascade, amplified cytokines secretion can increase adipocyte lipolysis which in turns lead to a raise of circulating FFA that are deposited in muscle and liver (“lipid dumping”) resulting in a decreased insulin sensitivity in these tissues (Mittra, Bansal, and Bhatnagar 2008). Particularly, FFA from visceral adipose tissue is directly deposited into the portal vein, growing the possibility of fatty liver disease, an high-risk factor for cardiovascular syndromes (Kabir et al. 2005; Yoshii et al. 2006). An increase in FFA release is also induced by cellular insulin insensitivity.
Lipid oxidation and lipolysis are the top pathways modulated in adipocytes by hypoxia (Geiger et al. 2011; Mazzatti et al. 2012). In response to low pO2, basal lipolysis has been
reported to be either unchanged (Lolmede et al. 2003) or increased (Yin et al. 2009; O’Rourke et al. 2013), whereas the uptake of fatty acids from the circulation is reduced (Yin et al. 2009)
29
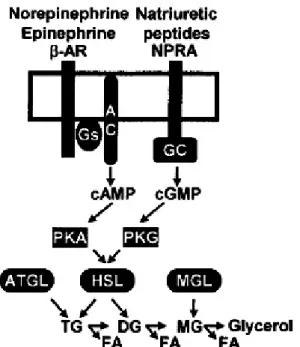
by an attenuation of lipogenesis (O’Rourke et al. 2013) through suppression of adipogenic transcription factors PPAR-c and C/EBPβ (Yun et al. 2002; Swiersz, Giaccia, and Yun 2004; Gentil et al. 2006; J.-Y. Kim et al. 2007; Park and Park 2010). This underlies the elevation of plasma FFA levels in obesity (Frayn et al. 2003). A model for stimulatory lipolysis pathways is reported in figure 15.
Figure 15: Model for stimulatory pathways in human adipose tissue lipolysis. Catecholamines and natriuretic peptides are the major hormones stimulating hydrolysis of TG and release of FFAs ( ). PKA- PKG activation induced by β2-ARs and NPRA stimulates the expression of HSL and ATGL. The MGL completes monoglycerides hydrolysis into glycerol and FA. From (Langin et al. 2005).
It has been suggested that the effect of hypoxia on lipolysis and lipogenesis is mediated through inhibition of HBS and that low pO2 impairs the buffering capacity of adipocytes and
contributes to lipotoxicity (O’Rourke et al. 2013). Specifically, HBS induces LG and LP in VAT but not in SAT and promotes FAO in the same manner in these tissues. Hypoxia also inhibits HBS, as well as LG, and induce LP. This shifts lipid metabolism towards LP, inhibiting adipocyte lipid storage and buffering capacity, increasing FFA release, and thus promoting systemic lipotoxicity (Fig. 16).
30 Figure 16: A model for hypoxia/HBS-mediated adipocyte overflow. HBS induces LG and LP in VAT but not in SAT and promotes FAO at the same way in these tissues. Hypoxia also inhibits HBS, so LG, and induce LP. This shifts lipid metabolism towards LP, inhibiting adipocyte lipid storage and buffering capacity, increasing FFA release, and thus promoting systemic lipotoxicity. From O’Rourke et al. (O’Rourke et al. 2013).
31
CHAPTER 2
PHARMACOLOGICAL STRATEGIES AND DIETARY
SUPPLEMENTATION
2.1 Therapeutic intervention
Reducing body weight requires manipulation of the energy balance equation to produce energy deficits that should be accomplished through diet and exercise, pharmacological interventions, or surgical means. However, each of these methods comes with disadvantages. For instance, many diet and exercise lifestyle interventions are not usually long-term lasting (Barte et al. 2010). Furthermore, pharmacological and/or surgical means to reduce body weight are typically expensive and are sometimes accompanied by potentially unpleasant and/or dangerous side effects (Kernan et al. 2000; McEwen et al. 2010). Currently, there are few options for obesity pharmacotherapy. One of the approved drug for weight management in Europe is Orlistat (Xenical®) (Yumuk et al. 2014) that acts by inhibiting pancreatic lipase activity reducing the triglyceride digestion and absorption by 30% (Yumuk et al. 2014), but have several common adverse effects (Filippatos et al. 2008; de la Garza et al. 2011).
In addition, there are other categories that act by suppressing appetite, increasing energy expenditure or by redistributing adipose tissue (Chatzigeorgiou et al. 2014) (Table 4), but the European organizations still seem skeptical due to these medications’ unwanted effects (Chatzigeorgiou et al. 2014). The only ones approved by the FDA are phentermine, an appetite-suppressant amphetamine, and topiramate, an anantiepileptic-controlled release drug that decrease lipogenesis and modifies the food taste via inhibition of carbonic anhydrase isoenzymes.
As such, recent evidences suggest that the consumption of natural ingredients and/or dietary supplements may provide a safe and effective means to induce weight loss and improve overall health (Lopez et al. 2013; Outlaw et al. 2013). The beneficial effects of poly- and monounsaturated fats on the recommended indexes ω3 have been determined to result in decreased obesity and IR (Burrows, Collins, and Garg 2011), as well as high-fiber cereals and whole grains (E. Q. Ye et al. 2012). A diet rich in soluble fiber (20 g/1000 kcal) and low in polyunsaturated fats (20% of total calories) and a decreased consumption of food items with a
32
high GI, can decrease the prevalence of MetS by improving BP and IR (Cho et al. 2013; Cuenca-Garcia et al. 2014). This suggests an overall food pattern in line with the Med Diet.
Drug Compound Clinical trials References
Thyroid hormone receptor subtype β-agonists
Eprotirome (KB 141) Terminated at phase III (Sharma et al. 2014)
Growth hormone analogues
AOD9604 Insufficient efficacy in clinical trials
(A. Khan et al. 2012)
11β-HSD1 inhibitors BVT-3498 Terminated at phase III (Wang 2006)
ADRβ3 L-796568 Not effective in
clinical trial
(Larsen et al. 2002) Diazoxide Diazoxide choline Completed several phase I
and II clinical studies
(Alemzadeh et al. 2008) Sirtuin 1 activators SRT2104 In phase II (Baksi et al. 2014) Angiogenesis inhibitors TNP-470 In phase II (J.-Y. Kim et al. 2007) Inhibitors of methionine
aminopetidase 2
Belonarib In phase II (Hughes et al. 2013)
Table 4 : Anti-obesity drugs involved in increasing energy expenditure or adipose tissue redistribution. Modified from Chatzigeorgiou et al. (Chatzigeorgiou et al. 2014).
2.2 Mediterranean diet
The Med Diet was first described by Oldways, the Harvard School of Public Health and the European Office of the World Health Organization at a conference in Cambridge, MA, in the 1993 (Oldways 2009) . This dietary pattern, based from the observations on dietary habits of people living in different regions of the Mediterranean basin (Keys 1995), it is generally illustrated by a diet pyramid graphic (Fig. 17).
As a source of minimally processed foods, it gathers a proper ratio between macronutrients, low glycemic index meals and energy density, with a high nutritional value (Bach-Faig et al. 2011; Gargallo Fernandez et al. 2012).
Previous studies exploring the adherence to the Med Diet have been conducted in Italy (di Giuseppe et al. 2008), Greek (Panagiotakos et al. 2007) and Spain (Mar Bibiloni et al. 2011; Bibiloni et al. 2012). A stronger association between the Med Diet and lower likelihood of being obese, hypertensive and having diabetes has been reported (Esposito et al. 2004; Psaltopoulou et al. 2004; Nunez-Cordoba et al. 2009; Domenech et al. 2014; Grosso et al. 2014). The negative correlation between the adherence to MedDiet and the weight gain (Mendez et al. 2006; Field et al. 2007), is ascribed to the customary use of olive oil, high in MUFA and PUFA (Bach-Faig et al. 2011), probably more easily oxidated, conversely to a
33
SFA and TFA intake (Field et al. 2007). In 2004, the FDA of the USA allowed a claim on olive oil labels concerning “the benefits on the risk of coronary heart disease of eating about two tablespoons (23 g) of olive oil daily, due to the MUFAs in olive oil” (Covas 2007).
Stated as a health model, the UNESCO has also recognized it as an Intangible Cultural Heritage of Humanity.
Figure 17: Graphic representation of MedDiet Pyramid graphic. This pyramid is a well-known guide to what is now universally recognized as the “gold standard” eating pattern that promotes lifelong good health. Modified from Oldways (Oldways 2009).
34
2.3 Olive oil
2.3.1 The plant
Olea europaea is an evergreen fruit plant that belongs to the family Oleaceae. It is native to
the southern European countries and throughout the entire Mediterranean region, where represents the prime source of olive oil (Bouskou 1996).
The plant grows to approximately 6-9 meters in height, has rigid branches and a grayish bark. The leaves are opposite, lanceolate, or ovate-lanceolate, mucronate, shortpetioled, green above, and hoary on the underside. The flowers are small, in short, axillary, erect racemes, very much shorter than the leaves. The corolla is short, white, with 4 broad, ovate segments; the calyx short and 4-toothed (Y. Khan et al. 2007) (Fig. 18).
Figure 18: Illustration of Olea europeae L. Branch with ripe olive (A), flowering olive branches (B) and olive flowers (C). Modified from Y. Khan et al (Y. Khan et al. 2007).
The fruit is an oval-shaped drupe with a typical size of 2–3 cm (width and length) made up of 3 parts, epicarp or skin, mesocarp or pulp and endocarp or stone. The epicarp that is covered with wax, during the growth phase turns from light green to purple and brown or black. The mesocarp, with a soft pulpy flesh, accounts for 84–90% (of the total fruit mass). The endocarp containing the seed or kernel may differ from 13 to 30% of fruit weight. The seed contains 2– 4 g oil /100 g. The fruit weight may range from 2–12 g, although some varieties may weigh as much as 20 g (Bouskou 1996; Niaounakis and Halvadakis 2006). Its growth and ripening is a long process which takes about 5 months in usual climatic conditions. It is composed by water (50%), protein (1.6%), oil (22%), carbohydrate (19.1%), cellulose (5.8%), inorganic substances (1.5%), phenolic compounds (1–3%), pectin, organic acids, and pigments (Bouskou 1996). However, this composition depends on a large amount of parameters including agronomical factors (e.g., olive cultivar) (Romani et al. 1999), agroclimatic conditions (Vinha et al. 2005) and irrigation management (Patumi et al. 2002).
35 2.3.2 Cultivar
Although the tree is now cultivated in several parts of the world, the Mediterranean area serves as the major producer accounting for about 99% of the world’s olive cultivation (Ghanbari et al. 2012). Among this area, the major olive producers countries are Spain, Italy and Greece which accounts for only the 12.1%, but has the largest per capita consumption of olive oil worldwide, over 26 liters per person per year. Spain produces 43.8% of olive oil world making, of whose the 75% comes from the region of Andalucía, particularly within Jaén province (FAOSTAT 2012). Although Italy is a net importer of olive oil, it still accounts for 21.5% of the world's production. Major Italian producers are known as "Oil Cities", including Lucca, Florence and Siena. However the largest production is harvested in Puglia and Calabria.
Italian and Spanish extra-virgin olive oils are the best-known and top-quality in North America, where are sold at high prices, often in prestige packaging. A large part of USA olive oil imports come from Italy, Spain, and Turkey (Sibbett and Ferguson 2005).
2.3.3 Extraction process
The mechanical and physical processes of olive oil production involve harvesting, washing, crushing, malaxation, decantation and filtration.
2.3.3.1 Collection
Olives are harvested in the autumn and winter, but the time varies in each country and with the season and the cultivar. Most of their today are harvested by shaking the boughs or the whole tree, but the found lying using on the ground can result in poor quality oil, due to damage. Another method involves standing on a ladder and "milking" the olives into a sack tied around the harvester's waist. This one produces high quality oil. A third method uses a device called an oli-net that wraps around the tree trunk and opens to form an umbrella-like catcher from which workers collect the fruit. Another method uses an electric tool, 'the oliviera’, which has large tongs that spin around quickly, removing fruit from the tree. Olives harvested by this method are used for oil.
In some countries like Italy, Croatia and Greece, olives are harvested by hand because the terrain is too mountainous for machines. As a result, the fruit is not bruised and leads to a superior finished product.
36 2.3.3.2 Washing
The purpose of the washing section is to remove leaves, dirt, stones and other heavy extraneous objects before the olives enter the first part of the processing line.
Olives are placed in special washing machines where the washing water is decanted into a reservoir and circulated within the process. Olives passing accross different automatically conveyors are defoliatoring and washed. Leaves, dirt and stones are discharged through a suitable duct.
2.3.3.3 Crushing
This operation is designed to tear the fruit cells to release the droplets of oil from the inner cavity (vacuole). Like an important part of extracting olive oil, it affects its physical and chemical properties, therefore its quality.
Olives are grinded by a metal crusher-hammer or a toothed-disc. Using the hammer increases the oil extraction yield because the intercellular structure is destroyed by using the stone mill and consequently oil droplets may be retained inside the cells that are cut without destroying the intercellular structure (Veillet et al. 2009). Although the metal crusher may increase the yield of extraction from olives, but because of high speed it may create more emulsion than a stone crusher, the produced paste needs to stay longer in the malaxation process. In addition, the hammer crusher instead of a stone crusher cuts better the olives and increases the amount of total phenols components, so the stronger antioxidant power in the oil. This can be ascribed to the higher temperature which is caused by the speed of the hammer crusher as well as solubilisation phenomena by which more phenolic compounds pass into the oil (Veillet et al. 2009).
2.3.3.4 Malaxation
Malaxation process (also called beating or kneading) is essential for increasing extraction yields, to enhance the effect of crushing and to make the paste uniform. During this step the small droplets of the oil, by means of slow and continuous kneading of the paste produced by metallic crusher, merge into large drops that can be easily separated by the separating apparatus. The bioactive compounds in olive oil can be significantly improved by various factors including temperature, time (Servili et al. 2003), and the use of enzymes (Vierhuis et al. 2001). Addition of commercial enzyme preparations such as pectolytic, hemicellulolytic, and cellulolytic during the olive oil malaxation process resulted in degrading the cell wall of the fruit and reducing the complex of hydrophilic phenols with polysaccharides, increasing
37
the concentration of free phenols in the olive paste and their consequent release into the oil and wastewaters through processing (Aliakbarian et al. 2008).
2.3.3.5 Decantation
In this section the oil is separated from the paste and the vegetation water by using decanters. They are of two types named three-phases (10–30 L of added water per 100 kg of olive paste) and two-phases decanter that operates without adding any water. Actually, in three phase system in order to reduce the viscosity of pastes and to separate oil easily from the solid phase, sufficient water needs to be added before centrifugation (Montedoro et al. 1992). Disadvantages of this process include higher amounts of waste water (1.25 to 1.75 times more water than press extraction), loss of valuable components (e.g., natural antioxidants, phenolics) in the water phase, and problems of disposal of the oil mill waste water. Therefore, pressure system that does not need to add water to the olive paste offers a large amount of phenolic compounds in comparison to those obtained by the centrifugation system (Montedoro et al. 1992). The oil produced by a two-phase system has higher phenolic compounds content (Montedoro et al. 1992), stronger antioxidant activity (2-fold greater) and higher resistance to oxidation than that obtained by a three-phase system due to the higher amount of hydroxytyrosol, as an orthodiphenol compound (Galli and Visioli 1999; C. Manna et al. 1999).
2.3.3.6 Filtration
It is the final step in olive oil processing and can be carried out with fibrous materials and starch in combination with the filtration hardware to improve performance (Lozano-Sánchez, Segura-Carretero, and Fernández-Gutiérrez 2011). This process eliminates remaining solid particles that may reduce the shelf life and nutritive quality of olive, and removes humidity. The remaining paste (pomace) still contains a small quantity (about 5–10%) of oil that cannot be extracted by further pressing, but only with chemical solvents. This is done in specialized chemical plants, not in the oil mills. The resulting oil is not "virgin" but "pomace oil", as discussed following.
2.3.4 Classification
The grades of oil extracted from the fruit can be classified as:
EVOO: Comes from virgin oil production only, and is of higher quality. It contains no more than 0.8% free acidity (see below), and is judged to have a superior taste, having some fruitiness and no defined sensory defects. EVOO accounts for less than 10% of oil in
38
many producing countries, with a higher percentage in the Mediterranean countries (Greece: 80%, Italy: 65%, Spain 30%);
VOO: Comes from virgin oil production only, but is of slightly lower quality, with free acidity of up to 1.5%, and is judged to have a good taste;
ROO: It is obtained by refining virgin olive oils with a high acidity level and/or organoleptic defects that are eliminated after refining, without alterations in the initial glyceridic structure. It has a free acidity, expressed as oleic acid, of not more than 0.3%. It is extracted by using charcoal and other chemical and physical filters. Oils labeled as pure olive oil or olive oil are primarily refined olive oil, with a small addition of virgin-production to give taste;
POO: It is refined pomace olive oil often blended with some virgin oil. It has a more neutral flavor than pure or virgin olive oil and the same fat composition as regular olive oil, giving it the same health benefits. It also has a high smoke point, and thus is widely used in restaurants as well as home cooking in some countries.
The analytical parameters of olive oil merchandise classification according to 1989/03 UE Regulation are reported in table 5.
In Italy exists 40 types of olive oil whose 38 qualitatively branded as PDO and 2 as PGI. The production rules for the brands of PDO and PGI often involve the use of traditional techniques and restrictive rules with the aim of ensuring a higher quality products, and with particular reference to the traditional varieties used, which must be native.
Extra Virgin Olive Oil Virgin Olive Oil Ordinary Virgin Olive Oil
Acidity (%) ≤ 0,8 ≤ 2,0 >2
Peroxide Value (meq O2/Kg ) ≤ 30 ≤ 20 -
Waxes (mg/Kg) ≤ 250 ≤ 250 ≤ 300
Saturated fatty acids in position 2 of the triglyceride (%)
≤ 1,5 ≤ 1,5 ≤ 1,5
Stigmastadiene mg/kg ≤ 0,15 ≤ 0,15 ≤ 0,50
ECN42 HPLC and ECN42 Difference: theoretic calculation
≤ 0,2 ≤ 0,2 ≤ 0,3
K232 ≤ 2,50 ≤ 2,60 _
39
ΔK ≤ 0,01 ≤ 0,01 _
Organoleptic evaluation: median value of the defect (Md)
Md = 0 Md ≤ 2,5 Md > 2,5
Organoleptic evaluation: median value of the "fruity" (Mf)
Mf > 0 0 Mf > 0 _ Acidic composition (%) Miristic (%) Linolenic (%) Arachidic (%) Eicosanoic (%) Behenic (%) Lignoceric (%)
Trans-linolenic isomers sum (%) Sterols composition (%) Cholesterol (%) Brassicasterol (%) Campesterol (%) Stigmasterol (%) β-sitosterol (%) Δ -7-stigmastenol (%) Total sterols (%) Eritrodiol and uvaol (%)
0,05 ≤ 1,0 ≤ 0,6 ≤ 0,4 ≤ 0,2 ≤ 0,2 ≤ 0,05 ≤ 0,5 ≤ 0,1 ≤ 4,0 < camp _ ≥ 93,0 ≤ 0,5 ≤ 0,5 ≥ 1000 ≤ 4,5 ≤ 0,05 ≤ 1,0 ≤ 0,6 ≤ 0,4 ≤ 0,2 ≤ 0,2 ≤ 0,05 ≤ 0,5 ≤ 0,1 ≤ 4,0 < camp ≥ 93,0 ≤ 0,5 ≤ 0,5 ≥ 1000 ≤ 4,5 ≤ 0,05 ≤ 1,0 ≤ 0,6 ≤ 0,4 ≤ 0,2 ≤ 0,2 ≤ 0,05 ≤ 0,5 ≤ 0,1 ≤ 4,0 - ≥ 93,0 ≤ 0,5 ≤ 0,5 ≥ 1000 ≤ 4,5
Table 5: Analytical parameters of olive oil merchandise classification according to 1989/03 UE Regulation that modifies the 2568/91 UE Regulation. Modified from Servili et al. (Servili et al. 2010).
2.3.5 Chemical composition: the phenolic compounds
From a chemical point of view, olive oil can be divided into two fractions, saponifiable and unsaponifiable, depending on their behavior in presence of a strong alkaline solution (NaOH or KOH) and heating. Saponifiable (98% to 99% of total weight), able to form soaps in the mentioned conditions, include free fatty acids or esterified fatty acids with glycerol to form triglycerides, diglycerides and monoglycerides. It contains 75% to 85% of unsaturated fatty
40
acids (mainly oleic and linoleic acids) and 15% to 25% of saturated fatty acids (palmitic andstearic acids). The unsaponifiable (1-2%), formed by microcomponents that do not form soaps, is present in small quantities and contains mostly sterols, fat-soluble vitamins, waxes, aliphatic alcohols, aromatic compounds and polyphenols (Fig. 19). This fraction is very important from a nutritional and analytical point of view, to check the authenticity of the oil and its stability. For instance, the sterol profile is species-specific, so adulterations of the product with other oils are easily detectable (“Olive Oil Reference Book”).
Figure 19: Chemical composition of unsaponifiable and saponifiable fractions of olive oil. Updated from (“Olive Oil Reference Book”).
As mentioned previously, Spain and Italy are the major extra-virgin olive oils producer countries. The fatty acid composition of their oils is reported in table 6. Regarding Italy, the Calabria region produce and olive oil with a high content of palmitic acid (Table 7).
Origin area Oleic acid (%) Linoleic acid (%)
Palmitoleic acid (%)
Palmitic acid (%) Stearic acid (%)
Italy 64.1 – 85.0 1.0 – 15.0 0.2 – 5.5 7.1 – 17.5 0.3 – 3.4 Spain 65.3 – 79. 6 5.1 – 19.8 - - -