Altered Kv2.1 functioning promotes increased
excitability in hippocampal neurons of an Alzheimer
’s
disease mouse model
V Frazzini1,2, S Guarnieri2,3, M Bomba1,2, R Navarra2, C Morabito2,3, MA Mariggiò2,3and SL Sensi*,1,2,4
Altered neuronal excitability is emerging as an important feature in Alzheimer’s disease (AD). Kv2.1 potassium channels are important modulators of neuronal excitability and synaptic activity. We investigated Kv2.1 currents and its relation to the intrinsic synaptic activity of hippocampal neurons from 3xTg-AD (triple transgenic mouse model of Alzheimer's disease) mice, a widely employed preclinical AD model. Synaptic activity was also investigated by analyzing spontaneous [Ca2+]ispikes. Compared with
wild-type (Non-Tg (non-transgenic mouse model)) cultures, 3xTg-AD neurons showed enhanced spike frequency and decreased intensity. Compared with Non-Tg cultures, 3xTg-AD hippocampal neurons revealed reduced Kv2.1-dependent Ikcurrent densities
as well as normalized conductances. 3xTg-AD cultures also exhibited an overall decrease in the number of functional Kv2.1 channels. Immunofluorescence assay revealed an increase in Kv2.1 channel oligomerization, a condition associated with blockade of channel function. In Non-Tg neurons, pharmacological blockade of Kv2.1 channels reproduced the altered pattern found in the 3xTg-AD cultures. Moreover, compared with untreated sister cultures, pharmacological inhibition of Kv2.1 in 3xTg-AD neurons did not produce any significant modification in Ikcurrent densities. Reactive oxygen species (ROS) promote Kv2.1 oligomerization,
thereby acting as negative modulator of the channel activity. Glutamate receptor activation produced higher ROS levels in hippocampal 3xTg-AD cultures compared with Non-Tg neurons. Antioxidant treatment with N-Acetyl-Cysteine was found to rescue Kv2.1-dependent currents and decreased spontaneous hyperexcitability in 3xTg-AD neurons. Analogous results regarding spontaneous synaptic activity were observed in neuronal cultures treated with the antioxidant 6-hydroxy-2,5,7,8-tetramethylchro-man-2-carboxylic acid (Trolox). Our study indicates that AD-related mutations may promote enhanced ROS generation, oxidative-dependent oligomerization, and loss of function of Kv2.1 channels. These processes can be part on the increased neuronal excitability of these neurons. These steps may set a deleterious vicious circle that eventually helps to promote excitotoxic damage found in the AD brain.
Cell Death and Disease (2016) 7, e2100; doi:10.1038/cddis.2016.18; published online 18 February 2016
Alzheimer’s disease (AD) is the most common cause of dementia in the elderly. Among other mechanisms, dementia of AD type can result from progressive functional and structural derangement of synapses, dendrites, brain circuits, nodes and networks.1,2
According to recent findings, the AD-related deregulation of brain activity encompasses the simultaneous presence of hyperactive and hypoactive neurons that reorganize their activity in functional clusters.3This reorganization ultimately contributes to the production of network hyperexcitability and instability, hypersynchrony, epileptiform spiking as well as the activation of compensatory circuit remodeling.4,5
At the neuronal level, the homeostatic regulation of excitability and plasticity relies on the coordinated functioning of a wide array of ionic channels.6 In that context, delayed
rectifier K+currents (IK) have a major role in modulating cellular
excitability. Kv2.1 channels are one of the most widely expressed Kv channels in the brain and considered the main determinants ofIKcurrents in hippocampal neurons.7,8Kv2.1
channels control excitability but also have an important role in neuronal apoptosis.9,10 Kv2.1 channels show very slow activation kinetics and deactivation dynamics, preventing complete channel deactivation upon sustained neuronal activity.
Oxidative stress has been shown to act as negative modulator of Kv2.1-dependent K+currents,11,12an intriguing
finding considering the crucial role had by oxidative stress in the early stages of AD.13,14
Considering the AD-related hyperexcitability and oxidative stress, it is possible that the Kv2.1 channel oxidation that may
1Molecular Neurology Unit, Center of Excellence on Aging and Translational Medicine (CeSI-MeT), University“G. d’Annunzio”, Chieti-Pescara, Chieti, Italy;2Department of
Neuroscience and Clinical Sciences, University“G. d’Annunzio”, Chieti, Italy;3Cellular Physiology Unit, CeSI-MeT, University“G. d’Annunzio”, Chieti-Pescara, Chieti, Italy and4Departments of Neurology and Pharmacology, Institute for Memory Impairments and Neurological Disorders, University of California-Irvine, Irvine, CA, USA *Corresponding author: Professor SL Sensi, Molecular Neurology Unit, Center of Excellence on Aging, (CeSI),“G. d'Annunzio” University, Via Luigi Polacchi 11, 66100 Chieti, Italy. Tel: 0871 541544; Fax: 0871 541542; E-mail: [email protected]
Received 14.9.15; revised 28.12.15; accepted 03.1.16; Edited by A Verkhratsky
Abbreviations: AD, Alzheimer disease; Aβ, β-Amyloid; CNQX, 6-cyano-7-nitroquinoxaline-2,3-dione; DIV, days in vitro; GxTx, Guangxitotoxin; HEt, Hydroethidine; IK, Delayed Rectifier K+Currents; MAP-2, microtubule-associated protein 2; NAC, N-acetyl-cysteine; NMDA, N-methyl-D-aspartate; PBS, phosphate-buffered saline;
ROS, reactive oxygen species; Trolox, 6-hydroxy-2,5,7,8-tetramethylchroman-2-carboxylic acid; TTX, tetrodotoxin; 3xTg-AD, triple transgenic mouse model of Alzheimer's disease; Non-Tg, non-transgenic mouse model
occur early on in the disease can promote unbalanced neuronal excitability and activity-dependent regulation as well as network instability and dysfunction. With this conceptual framework as reference, we studied the potential relationship occurring between changes in the levels of oxidative stress, alterations of Kv2.1-dependent K+currents, and variations in neuronal intrinsic activity in hippocampal neurons obtained from 3xTg-AD (triple transgenic mouse model of Alzheimer's disease) mice. The 3xTg-AD mouse, a widely investigated preclinical model of AD, has the benefit of exhibiting an age-related development of β-Amyloid (Aβ)- and tau-dependent pathology as well as AD-related synaptic dysfunction and cognitive impairment.15
Results
3xTg-AD hippocampal neurons show increased [Ca2+]i
spike frequency. Spontaneous activity is an important determinant of information processing in neuronal circuits and in the brain.5,16–18 Neurons develop spontaneous rhythmic and bursting activity at the end of the first week in culture,19,20a property that has been exploited to investigate
basic aspects of network functioningin vitro.
[Ca2+]i transients are considered an indirect index of the
action potential firing status.21,22 With real-time microfluori-metry, we evaluated spontaneous [Ca2+]itransients occurring
in soma of 3xTg-AD or Non-Tg (non-transgenic mouse model) hippocampal neurons. Hippocampal neurons were loaded with the high affinity Ca2+ sensitive probe Fluo-4 AM and transients assessed in terms of number of spikes for minute (Figure 1a and b). In Non-Tg neurons, the pattern of spontaneous activity was found to be remarkably homoge-nous among different clusters (average spike frequency values were 1.958± 0.073 (S.E.M.) in 321 neurons from 15 dishes; Figures 1b and d). Compared with Non-Tg cells, 3xTg-AD neurons showed higher spike frequency (average spike frequency values were 6.312± 0.1965 (S.E.M.) in 322 neurons from 14 cultures; Po0.001; Figure 1b and d). In 3xTg-AD neurons, increased Ca2+ spike frequency was associated with lower average spike intensity (average fluorescence values were 85.71± 3.165 (S.E.M.) 321 neurons from 14 cultures; Figure 1c) compared with Non-Tg (mean fluorescence values: 131.4± 4.986 (S.E.M.) from 321 neurons from 15 cultures; Po0.001; Figure 1c). Treatment with the sodium channel blocker, tetrodotoxin (TTX), completely blocked [Ca2+]itransients, thereby indicating that the observed
oscillations were dependent on action potential firing. Moreover, transients were also completely abolished by the application of the ionotropic glutamate receptor blockers CNQX (6-cyano-7-nitroquinoxaline-2,3-dione; 10μM) and MK-801 (10μM), thereby demonstrating that increased [Ca2+]ispike frequencies depend on enhanced spontaneous
synaptic activity mediated by glutamate release and receptor activation (Figure 1e).
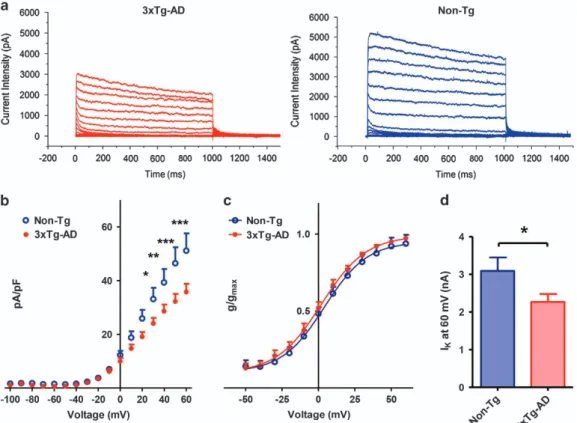
3xTg-AD mice show decreased delayed rectifier current density. In hippocampal neurons, Kv2.1 channels are the main driver for delayed rectifier K+ currents (Ik).7,23 The
channels negatively modulate neuronal activity during
repetitive spiking and promote neuronal integration by suppressing hyperexcitability when repetitive signals approach the soma. Kv2.1 channels undergo an oxidative-dependent loss of function, a phenomenon that may promote the increased spontaneous activity that we have observed in 3xTg-AD neurons. Thus, employing patch-clamp whole-cell recordings, we investigated Kv2.1-dependent currents in our 3xTg-AD and Non-Tg hippocampal neurons.
At first, we assessed if this baseline shift of membrane potential was present in our Tg-AD cultures and found no statistical significant differences in resting membrane
poten-tials values between 3xTg-AD and Non-Tg neurons
(Supplementary Figure 1A).
Kv2.1-dependent current density values were instead found to be significantly lower in 3xTg-AD neurons (average current density values (pA/pF) recorded from 17 neurons were 24.066± 2.061 (S.E.M.) at +30 mV, 28.632 ± 2.48 (S.E.M.) at +40 mV, 32.258± 2.774 at +50 mVand 35.770 ± 3.064 (S.E.M.) +60 mV; Figure 2a and b) compared with Non-Tg cells (average
pA/pF values in 10 neurons were 33.147± 4.171
(S.E.M.) at +30 mV (Po0.05), 39.331 ± 5.008 (S.E.M.) at +40 mV (Po0.01), 46.503 ± 5.961 at +50 mV (Po0.001) and 51.151± 6.448 at +60 mV (Po0.001); Figure 2a and b). Moreover, 3xTg-AD neurons displayed lower peaks of current intensities recorded at +60 mV (average current intensity (nA) values: 2.266± 0.2114 (S.E.M.) from 17 neurons; Figure 2d) compared with Non-Tg (average nA values: 3.090± 0.358 (S.E.M.) from 10 neurons (Po0.05); Figure 2d). Analysis of current activation kinetics did not show differences between the two strains (Figure 2c).
Taken together, these findings indicate that 3xTg-AD neurons express a lower number of fully functional Kv2.1 channels on their plasma membranes. No biophysical differences were found in the residual channel population between Non-Tg and 3xTg-AD neurons.
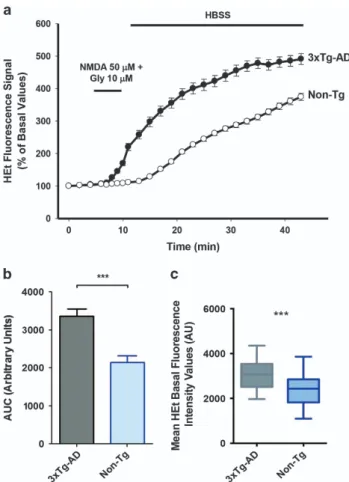
3xTg-AD hippocampal neurons show increased ROS production triggered by NMDA receptor activation. Mod-erate levels of ROS production have been shown to be important modulators of neuronal signaling.24,25 ROS overproduction promotes damage by acting on multiple intracellular targets. To determine whether the reduction in macroscopic currents that we have observed in 3xTg-AD cultures is linked to increased ROS production and subse-quent ROS-dependent loss of function of Kv2.1 channels, we examined cytosolic ROS levels evoked by a mild excitotoxic challenge obtained with exposure to N-methyl-D-aspartate (NMDA). To that aim, hydroethidine (HEt)-loaded neurons were challenged for 5 min with NMDA (50μM, in presence of 10μM of the receptor co-activator glycine; Figure 3a). Compared twith Non-Tg cultures (where average fluores-cence values were 2146± 173.6 (S.E.M.) in 108 neurons from 5 cultures; Figure 3b), 3xTg-AD neurons showed higher ROS production (average fluorescence values: 3366± 188.4
(S.E.M.) in 145 neurons from 5 cultures; Po0.001;
Figure 3b). These data indicate that, upon mild excitotoxic conditions, 3xTg-AD neuronal cultures may be more prone to ROS production. To evaluate baseline levels of oxidative stress occurring in 3xTg-AD and Non-Tg neurons, we then analyzed the culture basal ROS levels by assessing
3xTg-AD mice and hyperexcitability V Frazziniet al
differences in HEt fluorescence values. With this approach, changes in baseline fluorescence values are representative of the undergoing cumulative variations in ROS production. Results of this set of experiments indicate that 3xTg-AD neurons show statistically significant (Po0.001, Figure 3c) higher ROS levels at baseline (average fluorescence values: 3080± 42,28, (S.E.M.) in 291 neurons from 5 cultures; Figure 3c) compared with Non-Tg neurons (average fluores-cence values: 2389± 48,17 (S.E.M.) in 295 neurons from 5 cultures).
3xTg-AD hippocampal neurons display increased
expression and clusterization of Kv2.1 channels on somato-dendritic membranes. Oxidized Kv2.1 channels assemble in oligomers that are held together by disulfide bridges involving Cys-73.12 The oligomerization process has been shown to lead to progressive accumulation
of dysfunctional aggregates on neuronal plasma
membranes.11,12 To evaluate whether chronic oxidative stress induces Kv2.1 channel oligomerization in our AD model, hippocampal neurons were fixed and stained with a Kv2.1 antibody and clustering analysis performed. As expected, Kv2.1 channel expression was found to be strongly restricted to neuronal soma and proximal dendrites. When compared with Non-Tg cultures, 3xTg-AD neurons showed an overall increase in channel localization on neuronal membranes (Figure 4a and b). For each neuron, we measured the surface area occupied by Kv2.1 clusters within a defined somatic region, thereby obtaining a parametric ‘clusterization’ index. Thus, the index represents the fraction of the total plasma membrane area that is occupied by, immunohistochemically identified, Kv2.1 channels. 3xTg-AD neurons showed higher clusterization (average clusterization area in % was 28.58± 2.963 (S.E.M.) in 26 neurons)
Figure 1 3xTg-AD hippocampal neurons show increased [Ca2+]
ispike frequency compared with Non-Tg cultures. (a) Representative spontaneous Ca2+spike activity
occurring in 3xTg-AD cultured hippocampal neurons. Left panel shows pseudocolor images of Fluo-4-loaded cultures. Right panel shows time courses of Ca2+transients
occurring in neurons identified by the circle on the left panel. (b) Representative time course traces of spontaneous spike activity occurring in 3xTg-AD and Non-Tg cultures. (c) Plot graph depicts averaged Ca2+spike amplitudes in 3xTg-AD (average values of 321 neurons from 14 independent experiments) and Non-Tg cultures (average values of 321 neurons from 15 independent experiments; Po0.001; unpaired t-test). (d) Dot plot shows averaged spike frequencies in 3xTg-AD (322 neurons from 14 independent experiments) and Non-Tg cultures (321 neurons from 15 independent experiments). Note the reduced frequency in the 3xTg-AD population (Po0.001; unpaired t-test). (e) Representative time course of spike activity occurring in 3xTg-AD cultures treated with TTX (1μM) or glutamate receptor antagonists (MK-801 (10 μM) and CNQX (10 μM)). Note that both treatments produced strong inhibition of spontaneous synaptic activity
compared with Non-Tg neurons (average clusterization area in % was 18.82± 2.061 (S.E.M.) in 36 neurons; Po0.01). A previousin vivo study has shown that Aβ oligomers can modify Kv2.1 expression and promote increased channel synthesis.26 Moreover, increased expression has also been shown to enhance channel clusterization.27 To assess whether the
increased Kv2.1 clusterization that we found in our AD model is dependent on higher levels of channel conglomeration but not synthesis, we performed a Kv2.1 western blot analysis in the two strains. WB results indicated overlapping amounts of Kv2.1 channels in the two cultures (Figure 4c).
Interestingly, 3xTg-AD hippocampal neurons exposed to an excitotoxic-like condition showed Kv.2.1 de-clustering. This finding suggests that, upon prolonged glutamatergic stimula-tion, 3xTg-AD neurons are, most likely, employing homeo-static mechanisms to regain basal levels of Kv2.1-mediated excitability (Supplementary Figure 1B and C).
In summary, our Ca2+ imaging and electrophysiological experiments support the idea that 3xTg-AD neurons may develop a progressive accumulation of conglomerates of dysfunctional channels on their neuronal surfaces.
Pharmacological blockade of Kv2.1 channels promotes Ik
decrease and [Ca2+]i spike frequency enhancement in
Non-Tg neurons and has no effect in 3xTg-AD neurons. To evaluate whether the loss of function of Kv2.1 channels
that we have found in the 3xTg-AD cultures is functionally related to the observed increased excitability, we performed complementary pharmacological manipulations on Non-Tg neurons in order to induce and mimic the behavior showed by 3xTg-AD neurons. To that aim, Non-Tg cultures were treated with the Kv2.1 channel blocker Guangxitoxin (GxTx) and whole-cellIkcurrents recorded. GxTx is a gating modifier of
Kv2.1 channels (with a IC50of 1 nM for Kv2.1, 3 nM for Kv2.2
and 50 nM for Kv4.3 and no significant effects on other voltage gated ion channels). Non-Tg neurons were treated with GxTx (100 nM) throughout the recordings. GxTx-treated neurons showed Ik currents that were decreased (average
pA/pF values recorded from 6 neurons were 21.216± 2.569 (S.E.M.) at +30 mV; 26.256± 3.241 (S.E.M.) at +40 mV; 30.315± 4.330 (S.E.M.) at +50 mV and 32.117 ± 5.314 (S.E. M.) at +60 mV; Figure 5a and b) compared with untreated sister cultures (average pA/pF values recorded from 10 neurons were 36.227± 3.403 (S.E.M.) at +30 mV, (Po0.05); 42.990± 4.200 (S.E.M.) at +40 mV, (Po0.001); 50.489 ± 4.936 (S.E.M.) at +50 mV, (Po0.001) and 55.194 ± 5.296 (S.E.M.) at +60 mV, (Po0.001); Figure 5a and b). GxTx effects were also evaluated on spontaneous [Ca2+]i spikes of Non-Tg
neurons. GxTx, applied throughout the whole imaging experi-ment, induced a significant increase in spike frequency (average spike frequency values: 4.361± 0.1653 (S.E.M.) in 56 neurons from 3 dishes;Po0.001; Figure 5c and d) when
Figure 2 3xTg-AD mice show decreased delayed rectifier current density. (a) Representative Ikcurrents recorded from 3xTg-AD (left traces) and Non-Tg neurons (right
traces). (b) I/V plot of Ikcurrents in 3xTg-AD and Non-Tg cultures. Graph shows normalized current intensities from 3xTg-AD (n= 17) and Non-Tg neurons (n = 10). Note that,
compared with Non-Tg, 3xTg-AD neurons show decreased Kv2.1-dependent current densities (*Po0.05; **Po0.01; ***Po0.001; two-way ANOVA). (c) Plot shows activation curves from 3xTg-AD and Non-Tg neurons. Note that the residual channel population is not significantly different in the two strains. (d) Bar graph depicts averaged peak current intensity values of 17 3xTg-AD and 10 Non-Tg neurons. Note that, compared with Non-Tg, 3xTg-AD cells displayed lower peak current intensities at +60 mV (Po0.05; unpaired t-test)
3xTg-AD mice and hyperexcitability V Frazziniet al
compared with pre-drug basal values (average spike frequency values: 2.506± 0.1400 (S.E.M.) in 59 neurons from three dishes; Figure 5c and d). Moreover, GxTx application also produced decreases in [Ca2+]iamplitudes that resembled those
observed in 3xTg-AD neurons (average fluorescence values in Non-Tg before GxTx challenge were 118.6± 7.104 (S.E.M.) in 59 neurons from three cultures; average fluorescence values in Non-Tg after the GxTx challenge were 58.03± 3.771 (S.E. M.) in 59 neurons from three cultures;Po0.001; Figure 5e). We also replicated Figure 5 experiments on 3xTg-AD neurons. GxTx-treated 3xTg-AD neurons (five neurons from three different cultures) did not show anyIk currents modifications
when compared with untreated 3xTg-AD cells (17 neurons from three different cultures;P40.05; Figure 6a). Moreover, no
differences were found when GxTx-treated 3xTg-AD
neurons were compared with GxTx-treated Non-Tg neurons (six neurons from three different cultures; P40.05 for all
voltage membrane tests; Figure 6a). Spontaneous [Ca2+] i
spike frequency in 3xTg-AD neurons was also similar before (average spike frequency value: 12.03± 0.1424 (S.E.M.) in 113 neurons from three cultures) and after application of GxTx (100 nM) (spike frequency value: 12.70± 0.3494 (S.E.M.) in 113 neurons from the same three cultures;P40,05; Figure 6b and c). The finding that GxTx application does not modify what is naturally occurring in 3xTg-AD neurons corroborates the hypothesis that most of the neuron hyperexcitability is the results of dysfunctional Kv2.1 activity. However, analysis of amplitudes of spontaneous [Ca2+]i spikes in GxTx-treated
3xTg-AD neurons revealed small but statistically significant increased values (average amplitude value: 119.5± 4.207 (S.E.M.) in 113 neurons from three cultures) compared with those obtained in the same neurons before treatment (average fluorescence value was 105.0± 3.380 (S.E.M.) from the same 113 neurons;Po0,01; Figure 6d).
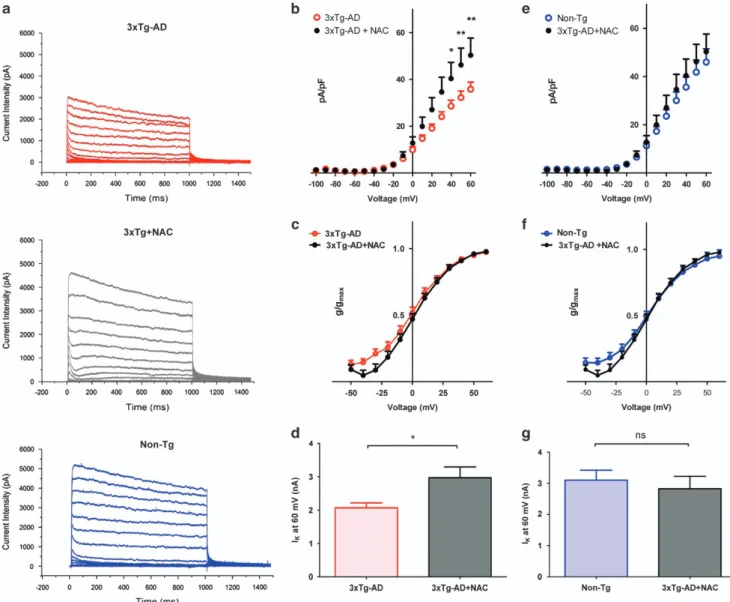
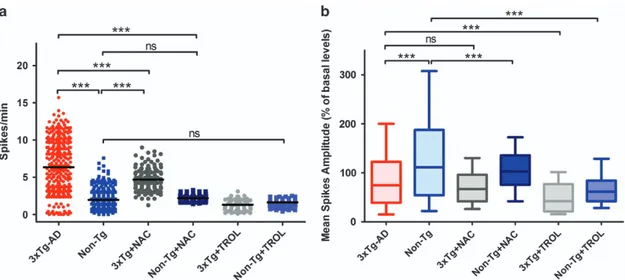
Antioxidant treatment decreases spontaneous synaptic activity in 3xTg-AD mice. In order to dissect the role of ROS in the modulation of Kv2.1-dependent currents in 3xTg-AD, we preincubated for 48 h 3xTg-AD neurons with
the antioxidant compound, N-acetyl-cysteine (NAC),
and assessed Ik currents. Compared with untreated
cultures [average pA/pF values recorded from 17 neurons: 28.632± 2.486 (S.E.M.) at +40 mV; 32.258 ± 2.774 (S.E.M.) at +50 mV; 35.770± 3.064 (S.E.M.) at +60 mV Figure 7a and b), NAC-treated cells displayed a significant rescue of Kv2.1-dependent current densities (average pA/pF values recorded from 12 neurons were 40.355± 6.866 (S.E.M.) at +40 mV, Po0.05; at +50 mV: 46.195 ± 7.192 (S.E.M.), Po0.01; at +60 mV: 50.334 ± 7.354 (S.E.M.), Po0.01; Figure 7a and b) as well as of peak current values (mean nA values at +60 mV: 2.071± 0.1457 (S.E.M.) from 15 3xTg-AD neurons; 2.970± 0.3230 (S.E.M.) from 12 NAC-treated 3xTg-AD neurons; Po 0.05; Figure 7d). Analysis of current activation kinetics did not indicate differences between the two conditions (Figure 7c). Interestingly, Ik current density,
activation kinetics, and peak currents were largely over-lapping with those found in Non-Tg cultures (Figure 7a and e–g). To further dissect the ROS role in the modulation of 3xTg-AD spontaneous synaptic activity, we investigated changes in [Ca2+]i transients in neurons preincubated with
NAC (1 mM) for 48 h. NAC-treated 3xTg-AD neurons displayed significant decreases in [Ca2+]i oscillations
[average spike frequency: 4.682± 0.123 (S.E.M.) obtained in 143 neurons from 7 cultures; Figure 8a] when compared with untreated 3xTg-AD cultures (average spike frequency values: 6.312± 0.1965 (S.E.M.) obtained in 322 neurons from 14 cultures; Po0.001; Figure 8a). NAC treatment did not reduce mean spike frequencies in 3xTg-AD to values observed in Non-Tg neurons (average spike frequency values were 1.958± 0.073 (S.E.M.) in 321 neurons from 15 dishes; Figure 8a). No differences were observed in spike amplitudes between 3xTg-AD (average fluorescence values: 85.71± 3.165 (S.E.M.) in 321 neurons from 14 cultures) and 3xTg-AD+NAC (average fluorescence values: 69.04± 2.663 (S.E.M.) in 143 neurons from 7 cultures; Figure 8b). Inter-estingly, NAC pre-treatment had no effects on [Ca2+]i
oscillations in Non-Tg neurons (average spike frequency
Figure 3 3xTg-AD hippocampal neurons show increased ROS production upon NMDA exposure. (a) Traces show representative HEt fluorescence changes over time in neurons from 3xTg-AD (black circles) or Non-Tg (white circles) neurons exposed for 5 min to NMDA (50μM)+glycine (10 μM). (b) Bar graph shows average cumulative changes in HEt fluorescence expressed as area under the curve (AUC) in Non-Tg (108 neurons from five independent experiments) and 3xTg-AD cultures (145 neurons from five independent experiments). Note that, compared with Non-Tg cultures, 3xTg-AD neurons show higher ROS production upon NMDA exposure (Po0.001; unpaired t-test). (c) Plot graph depicts average basal fluorescence values detected in 3xTg-AD neurons (291 cells from five experiments) and Non-Tg neurons (295 neurons from five experiments). Compared with Non-Tg, 3xTg-AD neurons show higher baseline Het fluorescence values (***Po0.001, unpaired t-test)
values: 2.189± 0.033 (S.E.M.) obtained in 159 neurons from 7 cultures; Figure 8a), thereby further substantiating a selective role of oxidative stress in the modulation of 3xTg-AD neuron activity.
As previous studies have suggested that NAC may also act independently of its antioxidant properties,28 we tested our experimental paradigm with an additional antioxidant molecule. 3xTg-AD and Non-Tg neuronal cultures were therefore incubated for 24 h with the ROS scavenger, Trolox (6-hydroxy-2,5,7,8-tetramethylchroman-2-carboxylic acid), and spontaneous synaptic activity evaluated. Similarly to NAC, Trolox significantly decreased 3xTg-AD neuronal hyper-excitability, thereby supporting the role of oxidative stress as critical mediator of the phenomenon. Compared with untreated 3xTg-AD neurons, Trolox-treated cultures showed a significant decrease in spiking activity (average spike frequency: 1.304± 0.8711 (S.E.M.) obtained in 74 neurons from three cultures;Po0.001; Figure 8a). Trolox treatment did not modify spike frequency in Non-Tg neurons (average spike frequency in Trolox-treated Non-Tg cultures: 1.620± 0.0871 (S.E.M.)
obtained in 127 neurons from four cultures). When considering Trolox effects in Ca2+ spike amplitudes we found that,
analogously to what observed in NAC-treated cultures, the molecule did not modify spike amplitudes in 3xTg-AD neurons (Figure 8b). However, compared with untreated Non-Tg cultures, NAC- and Trolox-treated Non-Tg neurons showed decreased spike amplitudes (average fluorescence values in NAC-treated neurons: 105± 3.284 (S.E.M.) in 159 cells from seven cultures; and in Trolox-treated neurons: 66.32± 2.781 (S.E.M.) in 127 neurons from four cultures; Po0.001, Figure 8b).
Discussion
Our study supports the idea of a causative link between the development of hyperexcitability, increased spontaneous synaptic activity, and the ROS-dependent appearance of conglomerates of dysfunctional Kv2.1 channels. These results are in line with accumulating evidence indicating that AD is characterized by the development of aberrant network
Figure 4 3xTg-AD hippocampal neurons display increased expression of Kv2.1 channels. (a) Representative confocal images of hippocampal neurons from 3xTg-AD (left panels) and Non-Tg cultures (right panels) stained with anti-Kv2.1 (red, top panels) or anti-Kv2.1 and anti-MAP-2 (red and blue; lower panels) antibodies. (b) Magnification of neuronal somata from the confocal images shown in the upper panels of a. (c) Bar graph depicts quantification of the cluster area (expressed as % of somatic areas occupied by the Kv2.1 clusters) in 3xTg-AD (n= 26) and Non-Tg (n = 36) neurons. Note the statistically significant higher clusterization of 3xTg-AD cultures (Po0.01; unpaired t-test). (d) Kv2.1 immunoblotting indicates no differences in channel expression in the two strains
3xTg-AD mice and hyperexcitability V Frazziniet al
activity,2,29hypersynchrony, epileptiform spiking and compen-satory circuit remodeling.4,30,31
Analysis of spontaneous synaptic activity in our model confirms that 3xTg-AD neurons show a pattern of high [Ca2+] i
spike frequency that is associated with reduced amplitudes, two phenomena indicative of hyperexcitability.
KV2.1 conglomeration and activation: the oxidative link. Suggesting a causative role for Kv2.1 channels in the hyperexcitability that we have observed in 3xTg-AD neurons, we found significant changes in channel activity of our AD model. The result can be explained by the high levels of oxidative stress that these neurons are known to face throughout development.13,14 In AD, oxidative stress is a detrimental feature that has been suggested to occur
even before the appearance of significant levels of plaque formation, neuropathological alterations or cognitive decline.29,32 Oxidative stress is also strongly enhanced in the brain of preclinical AD models including the 3xTg-AD mouse.33,34 In our experiments, compared with Non-Tg cultures, 3xTg-AD hippocampal neurons were found to be more prone to ROS overproduction in conditions of NMDA receptor activation (Figure 3a and b). ROS are instrumental in promoting Kv2.1 channels oligomerization, a process that favors the formation of conglomerates of dysfunctional channels that, through this step, become resistant to proteolytic cleavage, internalization or endocytosis.12These mechanisms lead to increased Kv2.1 surface expression without a matching increase in channel-mediated whole-cell K+currents. Recent data indicate that when channel density
Figure 5 Pharmacological blockade of Kv2.1 decreases IKand enhances [Ca2+]ispike frequency in Non-Tg neurons. (a) Representative traces of Ikcurrent density in
untreated (upper trace) and GxTx-treated (100 nM) Non-Tg neurons (lower trace). (b) I/V plot of Ikcurrents in treated and untreated Non-Tg cultures. Graph shows normalized
current intensities from 10 untreated and 6 treated Non-Tg neurons. Note that GxTx-treated neurons show a decrement in Ikcurrents when compared with untreated sister
cultures (***Po0.001; **Po0.01; *Po0.05; two-way ANOVA). (c) Representative traces of spontaneous [Ca2+]ispike activity in Non-Tg neurons before and after application of
(100 nM) GxTx. (d) Dot plot graph depicts quantification of spike frequencies found in Non-Tg cultures before and after GxTx application (59 neurons from three dishes). Note the increased spike frequency occurring after GxTx exposure (Po0.001; unpaired t-test). (e) Plot graph depicts averaged spike amplitudes in Non-Tg neurons before (mean fluorescence values: 118.6± 7.104 (S.E.M.) from 59 neurons of three cultures) and after GxTx application (average fluorescence values: 58.03 ± 3.771 (S.E.M.) from the same 59 neurons; Po0.001; unpaired t-test)
increases on the plasma membrane, non-clustered channels cease to conduct.35In agreement with this model, we found
that 3xTg-AD neurons showed increased Kv2.1 oligomeriza-tion that pairs with decreased channel conductances (Figures 2 and 4).
These findings are confirmed by a set of complementary results in which we found that, in Non-Tg cultures, GxTx treatment produces an enhanced spontaneous [Ca2+]ispike
frequency that overlaps with the one observed in 3xTg-AD neurons (Figure 5c and e). In Non-Tg neurons, the same treatment induced a decrease inIkcurrents that is similar to
the one observed in 3xTg-AD neurons (Figure 5b). Moreover, GxTx treatment in 3xTg-AD neurons failed to promote any significant modification inIkcurrent densities as well as [Ca2+]i
spike frequency, thereby suggesting that the Kv2.1 channel population present in 3xTg-AD neurons is largely compro-mised and not susceptible to further pharmacological modula-tion (Figure 6a and c). The slight increase in [Ca2+]i spike
amplitudes observed in GxTx-treated 3xTg-AD neurons (Figure 6d) may be the result of compensatory activity of
other [Ca2+]i regulating systems triggered by the sudden
drug-mediated inhibition of residual populations of Kv2.1 channels.
The relationship between high levels of oxidative stress and the appearance of Kv2.1 loss of function is further indicated by the NAC experiments. NAC pre-treatment rescued neuronal activity, decreased [Ca2+]ioscillations, and increased
normal-izedIkcurrents, (Figures 7 and 8). Trolox treatment was also
able to decrease spontaneous [Ca2+]
ioscillations (Figure 8).
All these findings support a causative role for oxidative stress in setting the stage for Kv2.1-dependent neuronal hyperactiv-ity. We, therefore, propose a sequence of pathogenic events that is centered on ROS-dependent modulation of the plasma membrane distribution of Kv2.1 channels. Lending support to this hypothesis, Kv2.1 immunostaining showed higher levels of plasma membrane appearance and clusterization of the channels (Figure 3). Our immunostaining data show that Kv2.1 are highly restricted on 3xTg-AD somatic and proximal dendritic membranes 36,37 where appear in large clusters (Figure 4), results that are in line with previous studies.11,12
Figure 6 Pharmacological blockade of Kv2.1 does not affect Ikcurrents and [Ca2+]ispike frequency in 3xTg-AD neurons. (a) I/V plot of Ikcurrents in untreated and
GxTx-treated (100 nM) AD neurons and from unGxTx-treated Non-Tg cultures. Graph shows normalized current intensities from 17 unGxTx-treated AD neurons, 5 GxTx-GxTx-treated 3xTg-AD neurons and 10 untreated Non-Tg neurons. Note that GxTx-treated neurons did not show any Ikcurrent modifications when compared with untreated sister cultures (P40.05;
two-way ANOVA). (b) Representative traces of spontaneous [Ca2+]ispike activity in 3xTg-AD neurons before and after application of (100 nM) GxTx. (c) Dot plot graph depicts
quantification of spike frequencies found in 3xTg-AD cultures before and after GxTx application (113 neurons from three dishes). Note the absence of spike frequency modification that occurs after GxTx exposure (P40.05; unpaired t-test). (d) Plot graph depicts average spike amplitudes in Non-Tg neurons before (average fluorescence values: 105.0± 3.380 (S.E.M.) from 113 neurons from 3 cultures) and after GxTx application (average fluorescence values: 119.5 ± 4.207 (S.E.M.) from the same 113 neurons; Po0.01; unpaired t-test)
3xTg-AD mice and hyperexcitability V Frazziniet al
Astrocyte–neuron interactions are central in the modulation of neuronal and synaptic physiology. Kv2.1 channels are located on the soma and principal dendrites of both pyramidal and inhibitory neurons. Furthermore, the channels are strategically present at sites in the close proximity of astrocytic processes. This intercellular distribution promotes a rapid removal of the neuronal K+ that is released into the extracellular space upon intense channel activation.38 The possibility that such sophisticated regulatory mechanism may be altered in 3xTg-AD neurons represents an intriguing hypothesis that warrants future investigation.
Another important issue concerns the possibility that ROS may affect Kv2.1 activity by employing mechanisms that go beyond channel oxidation. In that respect, previous studies have shown that activity- and calcineurin-dependent Kv2.1
dephosphorylation induces hyperpolarizing shifts. Further-more, experimental evidence have indicated 16 different Kv2.1 phosphorylation sites, only seven of which are dephosphory-lated by calcineurin, thereby indicating multiple mechanisms regulating the channel biophysical properties.39
Conclusions
Our study indicates a scenario where AD-related mutations may promote enhanced ROS generation thereby leading to oxidative-dependent oligomerization and loss of function of Kv2.1 channels, and, ultimately, hyperexcitability. Our model also suggests that interruption of this cycle may offer promising novel therapeutic approaches for AD.
Figure 7 NAC treatment increases Kv2.1-dependent current densities in 3xTg-AD neurons. (a) Representative traces of Ikcurrent density recorded from 3xTg-AD cultures
(upper traces), 3xTg-AD cultures treated with NAC (1 mM; middle traces), and Non-Tg cultures (lower traces). (b) I/V plot of Ikcurrents. Graph depicts normalized current
intensities of 17 untreated or 13 NAC-treated 3xTg-AD neurons (**Po0.01, *Po0.05; two-way ANOVA). (c) Plot shows activation curves from the same set of neurons shown in b. (d) Bar graph shows averaged peak currents values from the experiments shown in b. (e) I/V plot of Ikcurrents of 10 Non-Tg and 13 3xTg-AD+NAC neurons. Note that the
trace shows non-statistically significant differences. (f) Plot shows activation curves from the same set of neurons shown in e. (g) Bar graph shows averaged peak current values from the experiments shown in e
Materials and methods
Chemicals and reagents. Fluo-4 AM, HEt and pluronic acid were purchased from Molecular Probe (Invitrogen, Milan, Italy). TTX, NMDA, Glycine, MK-801, CNQX, NAC and Trolox were obtained from Sigma-Aldrich (Milan, Italy). GxTx was purchased from Alomone Lab (Jerusalem, Israel). Tissue culture media and sera were from Gibco (Invitrogen, Milan, Italy). Alexa 488 conjugated anti mouse secondary antibodies and Alexa 546 conjugated anti-rabbit secondary antibodies were from Life Technologies. All other chemicals and reagents were obtained from common commercial sources.
Animal handling and tissue preparation. All the procedures involving animals were approved by the institutional Ethics Committee (47/2011/CEISA/COM) and performed in accordance with institutional guidelines and national (D.L. n. 116, G.U., suppl. 40, 18 February 1992) and international laws and policies. Groups of 3–4 female mice were housed in colorless cages while male mice were single-housed. Mice were kept on a 12/12 light/dark cycle and had ad libitum access to food and water. All efforts to minimize mice suffering were adopted. Murine hippocampal cultures were prepared from embryonic mice (E16–18). Briefly, hippocampal tissues were dissected in ice-cold, Ca2+free dissecting medium and subsequently minced with forceps. Hippocampal tissue containing medium was then transferred in a 0.25% trypsin solution for 10 min at 37 °C. Hippocampal tissue was then centrifuged at 1300 r.p.m., 4 °C for 5 min. After supernatant removal, pellet was dissociated with a fire-polished glass pipette. Dissociated hippocampal neurons were then re-suspended in Neurobasal medium supplemented with 1 × B27, 5% horse serum, 5% fetal bovine serum, 0.5 mML-glutamine and 0.2% penicillin/ streptomycin. Neurons were then plated on culture plates or dishes previously treated laminin/poly-DL-lysine. A total of 5μM of cytosine arabinofuranoside was added to the growth medium at 3 to 5 days in vitro (DIV) to arrest and inhibit excessive glial proliferation. Media changes were performed by replacing, every three days, 25% of the medium with fresh Neurobasal (a medium that does not contain FBS, HS or B27). Experiments were performed on cultures between 14 and 19 DIV. As far as the cellular composition of our cultures, it should be underlined that the cytostatic treatment was able to halt most of the glial cell replication. However, when we assayed, with anti-GFAP (to detect glial cells) and anti-MAP-2 (microtubule-associated protein 2; to detect neuronal structures) antibodies, the presence of astrocytes in our cultures, a significant amount (around 30%) of these cells was found. Thus, our cultures represent a viable mixture of neurons and
supporting glial cells, a physiological setting that allows full interaction between neurons and astrocytes.
Neuronal culture immunofluorescence. Hippocampal neuronal cultures were fixed for 20 min with ice-cold 4% paraformaldehyde, permeabilized in 0.1% Triton X-100, blocked in 10% of goat serum in phosphate-buffered saline (PBS) and incubated overnight at +4° with anti-Kv2.1 antibody (clone K89/34, dil: 1:200, Neuromab, UC Davis, Davis, CA, USA) together with anti MAP-2 antibody (1:100) in the same blocking solution. Cultures were then stained with species-specific Alexa-conjugated secondary antibodies for 1 h at room temperature in the dark and then mounted on Zeiss Meta confocal microscope. For Kv2.1 clusterization analysis, each neuron was analyzed by evaluating the surface areas occupied by the soma and by Kv2.1 clusters. The two values were then used to obtain a parametric ‘clusterization’ index expressed as % value.
Ca2+ imaging and spontaneous [Ca2+]i spikes analysis.
Sponta-neous [Ca2+]
ispikes were recorded from homogenous neuronal clusters composed
of at least 15–25 cells. Neurons were loaded at least 30 min in the dark with the high affinity Ca2+sensitive probe Fluo-4 AM at final concentration of 5μM plus 0.1% Pluronic F-127 in a HEPES-buffered saline solution (HBSS) composed of (in mM): 20 HEPES, 15 glucose, 120 NaCl, 5.4 KCl, 1.8 CaCl2, 0.8 MgCl2, 10 NaOH
and pH7.4. After loading cells were washed, and incubated in the dark for further 30 min in HCSS. All loading procedures and recordings were carried out at room temperature. No detectable differences in intracellular distribution of dye loading were observed between 3xTg-AD and Non-Tg neurons. Pharmacological stimulations were applied at the time points indicated in text or figures. Drugs were washed out employing a perfusion system synchronized to image acquisition (RSC-200, Bio-logic Science Instrument, Claix, France). Analysis was performed only on neuronal clusters displaying spontaneous synaptic activity within the first minute of the experimental session. Region of interests were manually selected and placed on neuronal somata. Images were obtained using a 16 bit digital EMCCD camera (PhotoEvolve 512; Photometrics, Tucson, AZ, USA) attached to an AxioExaminer upright microscope (Zeiss, Oberkochen, Germany) equipped with a 40 × (NA:1.0) epifluorescence water immersion objective. Light source was provided by a monochromator equipped with a 75 W Xenon lamp (Cairn Instruments, Faversham, UK; excitation, 490 nm; emission, 530 nm). Images acquisition and off-line analysis were performed with Metafluor 7.7 (Molecular Device, Sunnyvale, CA, USA). 16 bit, 515x512 fluorescence images were acquired
Figure 8 NAC and Trolox treatment decreases spontaneous synaptic activity in 3xTg-AD mice. (a) Dot plot graph depicts quantification of spike frequencies in untreated 3xTg-AD and NAC- or Trolox-treated 3xTg-AD neurons (321 untreated 3xTg-AD cells from 14 cultures; 143 NAC-treated cells from 7 cultures; 74 Trolox-treated cells from 3 cultures) along with untreated and NAC- or Trolox-treated Non-Tg neurons (231 untreated Non-Tg cells from 15 cultures; 231 NAC-treated cells from 7 cultures; 127 Trolox-treated cells from 4 cultures). Note that NAC treatment induced significant changes (***Po0.001; ANOVA and post hoc Bonferroni) only in 3xTg-AD cells whereas no effects were seen in Non-Tg cultures, thereby suggesting a selective role of oxidative stress in the modulation of 3xTg-AD neuronal activity. Similar effects are observed in Trolox-treated cultures. Trolox induced significant changes (***Po0.001; ANOVA and post hoc Bonferroni) in 3xTg-AD spiking activity while no effects are seen in Non-Tg cells. (b) Plot graph depicts averaged Ca2+spike amplitudes relative to the same six experimental conditions shown in a. Note that NAC or Trolox does not induce significant changes in 3xTg-AD cells
whereas the two molecules have significant effects in Non-Tg neurons (***Po0.001; ANOVA and post hoc Bonferroni) 3xTg-AD mice and hyperexcitability
V Frazziniet al
every 1 s throughout experimental sessions, with the exception of GxTx treatments where images were acquired every 500 ms in order to identify also subtle changes in [Ca2+]ispikes frequency after pharmacological challenge. Raw fluorescence
values of spontaneous [Ca2+]
i spikes were normalized and expressed as
percentage of baseline fluorescence (% of basal fluorescence). Using a custom made MATLAB code, we calculated the number of peaks (P) and mean amplitudes of [Ca2+]ispikes. In the final analysis, we took in account only fluorescence values
that were 25% larger than baseline.
ROS measurement. Oxygen radical production was monitored using the oxidation sensitive dye HEt (Exλ: 530 ± 15 nm, Em λ: 575–610 nm). Stock HEt (1 mg/ml) was prepared as previously described40in dry DMSO and stored in frozen aliquots for use within eight weeks. Cultures were loaded in the dark with 5μM HEt in HCSS (45 min, 25 °C). After loading, cultures were washed three times in HCSS and mounted on microscope stage in a static bath of HCSS containing 5μM HEt. HEt was dissolved in all the solution throughout all the experimental session in order to maintain dye equilibration. Images were acquired by the same imaging setup previously described (see Ca2+Imaging and spontaneous [Ca2+] i
spikes analysis section). Cells were excited at 530 nm and emission was monitored at4590 nm. To prevent the antioxidant activity of B27, at DIV 5 neuronal cultures were switched to a B27-free Neurobasal medium.
Electrophysiology. Ikcurrent recordings were obtained with the whole-cell
voltage-clamp configuration.41 Cells were mounted on an AxioExaminer
microscope, patch pipettes pulled from borosilicate glass tubing (Science Product GmBh, Hofheim, Germany) and heat-polished at the tip to give a resistance of 3–6 MΩ. Electrodes were filled with a intracellular solution composed by (in mM): 10 NaCl, 117 KCl, 2 MgCl2, 11 HEPES, 11 ethylene glycol-bis-(β-aminoethyl ether)-N,
N,N′,N′-tetraacetic acid (EGTA), and 1 CaCl2, at pH 7.2. Bath solution contained
(in mM): 135 NaCl, 5 KCl, 1.2 MgCl2, 5 HEPES, 2.5 CaCl2, and 10D-glucose, at pH
7.4. 0.3μM TTX was continuously applied. All recordings were performed at room temperature (23–25 °C). Holding potential was clamped at − 60 mV to reduce the contribution of A-type currents, from this holding value the following voltage protocol was used: 1 s test pulses from− 100 to +60 mV in 10 mV steps, followed by a 500 ms tail pulse to− 30 mV. Resting membrane potential was recorded using the above mentioned solutions in absence of TTX. Immediately after whole-cell access amplifier was switch from Voltage Clamp to I= 0 and traces acquired for 10 s in gap-free mode.
A sampling interval of 25μs/point was used and currents filtered at 5 kHz. Linear components of leak and capacitive currents were canceled using the P/N method. The Nernst K equilibrium potential EKwas calculated as—79.4 mV. The normalized
conductance was plotted against the test potential (V) and fitted to a single Boltzmann equation G= Gmax/(1exp[–(V–G1/2)/k ]). Here, Gmaxis the maximum conductance,
G1/2 is the test potential at which the IKchannels have a half-maximal conductance, and k
represents the activation curve slope. In the off-line data analysis, Ikcurrents were
evaluated at the steady-state amplitude selecting the last 500 ms of the 1 s test pulse. Stimulation, acquisition, and data analysis were performed with pCLAMP 10.0 and Clampfit software and Axopatch 200B amplifier (Molecular Device).
Western blot analysis. Proteins were extracted from 18 DIV hippocampal cultures. Cultures were washed three times in PBS, scraped and then homogenized in ice-cold lysis buffer (made of 100 mM NaCl, 50 mM Tris–HCl, 40 mM β-glycerophosphate, 200 μM sodium orthovanadate, 50 mM NaF, 100 μg/ml phenylmethylsulfonyl fluoride, 10μg/ml leupeptin, 5 μg/ml pepstatin A, 10 μg/ml benzamidine, 5 mM EDTA, 1% Triton X-100; at pH 7.4). To remove cellular debris, homogenates were centrifuged at 1000 × g at 4 °C. Supernatants were then collected and protein concentrations determined by Bio-Rad protein assay (Bio-Rad Laboratories Srl, Segrate, Milan, Italy). Protein containing samples were suspended in Laemmli buffer (containing 8% (w/v) SDS, 10% (v/v) glycerol, 5% (v/v) β-mercaptoethanol, 25 mM Tris–HCl, pH 6.5, and 0.003% (w/v) bromophenol blue), boiled for 5 min, and separated by SDS-PAGE on a 10% (w/v) homogeneous slab gel. A total amount of 40μg of protein, for each sample, were electroblotted onto a nitrocellulose membrane (Amersham Hybond-ECL; GE Healthcare, Milan, Italy). Membranes were then blocked in TBS-T (Tris-buffered saline with 0.1% (v/v) Tween 20) containing 5% (w/v) fat-free milk and incubated overnight with the primary anti-Kv2.1 antibody (clone K39/25 dilution 1:500, NeuroMab, UC Davis). Membranes were then incubated with horseradish peroxidase-conjugated anti-IgG. Signal was detected by chemiluminescence (Pierce ECL Plus; Thermo Scientific, Rockford, USA). Blots were then stripped with 2% (w/v) SDS, 1% (v/v)β-mercaptoethanol, in
60 mM Tris–HCl (pH 6.8) for 30 min at 50 °C. Stripped blots were then washed and re-probed with an anti-GAPDH antibody (Millipore, Vimodrone (MI), Italy; dilution 1:5000). Signal was revealed by horseradish-peroxidase-conjugated antibody. Chemiluminescence was recorded using an image acquisition system from Uvitec (Cambridge, UK). All of the antibodies were diluted in TBS-T.
Statistical analysis. Statistical differences were determined with Student's t-test for unpaired data. Statistical significance of I–V traces was calculated using the Friedman test applied to non-linear regressions. Mann–Whitney test was employed for statistical analysis of immunohistochemistry data. All data are expressed as mean± S.E.M. For multiple comparisons, ANOVA and post hoc Bonferroni were used to analyse statistical differences as far as spike frequency and signal amplitude.
Conflict of Interest
The authors declare no conflict of interest.
Acknowledgements. This work was supported by the Italian Department of Education (PRIN 2010) (PRIN2010#2010M2JARJ_005).
1. DeKosky ST, Scheff SW. Synapse loss in frontal cortex biopsies in Alzheimer's disease: correlation with cognitive severity. Ann Neurol 1990; 27: 457–464.
2. Palop JJ, Mucke L. Amyloid-beta-induced neuronal dysfunction in Alzheimer's disease: from synapses toward neural networks. Nat Neurosci 2010; 13: 812–818.
3. Palop JJ, Mucke L. Synaptic depression and aberrant excitatory network activity in Alzheimer's disease: two faces of the same coin? Neuromolecular Med 2009; 12: 48–55. 4. Palop JJ, Chin J, Roberson ED, Wang J, Thwin MT, Bien-Ly N et al. Aberrant excitatory
neuronal activity and compensatory remodeling of inhibitory hippocampal circuits in mouse models of Alzheimer's disease. Neuron 2007; 55: 697–711.
5. Busche MA, Chen X, Henning HA, Reichwald J, Staufenbiel M, Sakmann B et al. Critical role of soluble amyloid-beta for early hippocampal hyperactivity in a mouse model of Alzheimer's disease. Proc Natl Acad Sci USA 2012; 109: 8740–8745.
6. Toledo-Rodriguez M, El Manira A, Wallen P, Svirskis G, Hounsgaard J. Cellular signalling properties in microcircuits. Trends Neurosci 2005; 28: 534–540.
7. Murakoshi H, Trimmer JS. Identification of the Kv2.1K+ channel as a major component of the delayed rectifier K+ current in rat hippocampal neurons. J Neurosci 1999; 19: 1728–1735. 8. Mohapatra DP, Misonou H, Pan SJ, Held JE, Surmeier DJ, Trimmer JS. Regulation of intrinsic excitability in hippocampal neurons by activity-dependent modulation of the KV2.1 potassium channel. Channels (Austin) 2009; 3: 46–56.
9. Pal S, Hartnett KA, Nerbonne JM, Levitan ES, Aizenman E. Mediation of neuronal apoptosis by Kv2.1-encoded potassium channels. J Neurosci 2003; 23: 4798–4802.
10. Shah NH, Schulien AJ, Clemens K, Aizenman TD, Hageman TM, Wills ZP et al. Cyclin e1 regulates Kv2.1 channel phosphorylation and localization in neuronal ischemia. J Neurosci 2014; 34: 4326–4331.
11. Cotella D, Hernandez-Enriquez B, Wu X, Li R, Pan Z, Leveille J et al. Toxic role of K+ channel oxidation in mammalian brain. J Neurosci 2012; 32: 4133–4144.
12. Wu X, Hernandez-Enriquez B, Banas M, Xu R, Sesti F. Molecular mechanisms underlying the apoptotic effect of KCNB1K+ channel oxidation. J Biol Chem 2013; 288: 4128–4134. 13. Good PF, Werner P, Hsu A, Olanow CW, Perl DP. Evidence of neuronal oxidative damage in
Alzheimer's disease. Am J Pathol 1996; 149: 21–28.
14. Torres LL, Quaglio NB, de Souza GT, Garcia RT, Dati LM, Moreira WL et al. Peripheral oxidative stress biomarkers in mild cognitive impairment and Alzheimer's disease. J Alzheimers Dis 2011; 26: 59–68.
15. Oddo S, Caccamo A, Shepherd JD, Murphy MP, Golde TE, Kayed R et al. Triple-transgenic model of Alzheimer's disease with plaques and tangles: intracellular Abeta and synaptic dysfunction. Neuron 2003; 39: 409–421.
16. Busche MA, Eichhoff G, Adelsberger H, Abramowski D, Wiederhold KH, Haass C et al. Clusters of hyperactive neurons near amyloid plaques in a mouse model of Alzheimer's disease. Science 2008; 321: 1686–1689.
17. Arieli A, Sterkin A, Grinvald A, Aertsen A. Dynamics of ongoing activity: explanation of the large variability in evoked cortical responses. Science 1996; 273: 1868–1871. 18. Ji D, Wilson MA. Coordinated memory replay in the visual cortex and hippocampus
during sleep. Nat Neurosci 2007; 10: 100–107.
19. Maeda E, Robinson HP, Kawana A. The mechanisms of generation and propagation of synchronized bursting in developing networks of cortical neurons. J Neurosci 1995; 15: 6834–6845.
20. Gritsun T, le Feber J, Stegenga J, Rutten WL. Experimental analysis and computational modeling of interburst intervals in spontaneous activity of cortical neuronal culture. Biol Cybern 2011; 105: 197–210.
21. Kerr JN, Greenberg D, Helmchen F. Imaging input and output of neocortical networks in vivo. Proc Natl Acad Sci USA 2005; 102: 14063–14068.
22. Sato TR, Gray NW, Mainen ZF, Svoboda K. The functional microarchitecture of the mouse barrel cortex. PLoS Biol 2007; 5: e189.
23. Du J, Haak LL, Phillips-Tansey E, Russell JT, McBain CJ. Frequency-dependent regulation of rat hippocampal somato-dendritic excitability by the K+ channel subunit Kv2.1. J Physiol 2000; 522: 19–31.
24. Valko M, Leibfritz D, Moncol J, Cronin MT, Mazur M, Telser J. Free radicals and antioxidants in normal physiological functions and human disease. Int J Biochem Cell Biol 2007; 39: 44–84.
25. Massaad CA, Klann E. Reactive oxygen species in the regulation of synaptic plasticity and memory. Antioxid Redox Signal 2010; 14: 2013–2054.
26. Pan Y, Xu X, Tong X, Wang X. Messenger RNA and protein expression analysis of voltage-gated potassium channels in the brain of Abeta(25-35)-treated rats. J Neurosci Res 2004; 77: 94–99. 27. Antonucci DE, Lim ST, Vassanelli S, Trimmer JS. Dynamic localization and clustering of dendritic Kv2.1 voltage-dependent potassium channels in developing hippocampal neurons. Neuroscience 2001; 108: 69–81.
28. Halasi M, Wang M, Chavan TS, Gaponenko V, Hay N, Gartel AL. ROS inhibitor N-acetyl-L-cysteine antagonizes the activity of proteasome inhibitors. Biochem J 2013; 454: 201–208. 29. Noebels J. A perfect storm: converging paths of epilepsy and Alzheimer's dementia intersect
in the hippocampal formation. Epilepsia 2011; 52: 39–46.
30. Minkeviciene R, Rheims S, Dobszay MB, Zilberter M, Hartikainen J, Fulop L et al. Amyloid beta-induced neuronal hyperexcitability triggers progressive epilepsy. J Neurosci 2009; 29: 3453–3462.
31. Verret L, Mann EO, Hang GB, Barth AM, Cobos I, Ho K et al. Inhibitory interneuron deficit links altered network activity and cognitive dysfunction in Alzheimer model. Cell 2012; 149: 708–721.
32. Cabrejo L, Guyant-Marechal L, Laquerriere A, Vercelletto M, De la Fourniere F, Thomas-Anterion C et al. Phenotype associated with APP duplication in five families. Brain 2006; 129: 2966–2976.
33. Smith IF, Hitt B, Green KN, Oddo S, LaFerla FM. Enhanced caffeine-induced Ca2+ release in the 3xTg-AD mouse model of Alzheimer's disease. J Neurochem 2005; 94: 1711–1718. 34. McManus MJ, Murphy MP, Franklin JL. The mitochondria-targeted antioxidant MitoQ prevents loss of spatial memory retention and early neuropathology in a transgenic mouse model of Alzheimer's disease. J Neurosci 2011; 31: 15703–15715.
35. Fox PD, Loftus RJ, Tamkun MM. Regulation of Kv2.1 K(+) conductance by cell surface channel density. J Neurosci 2013; 33: 1259–1270.
36. Trimmer JS. Expression of Kv2.1 delayed rectifier K+ channel isoforms in the developing rat brain. FEBS Lett 1993; 324: 205–210.
37. Misonou H, Thompson SM, Cai X. Dynamic regulation of the Kv2.1 voltage-gated potassium channel during brain ischemia through neuroglial interaction. J Neurosci 2008; 28: 8529–8538.
38. Du J, Tao-Cheng JH, Zerfas P, McBain CJ. The K+ channel, Kv2.1, is apposed to astrocytic processes and is associated with inhibitory postsynaptic membranes in hippocampal and cortical principal neurons and inhibitory interneurons. Neuroscience 1998; 84: 37–48.
39. Park KS, Mohapatra DP, Misonou H, Trimmer JS. Graded regulation of the Kv2.1 potassium channel by variable phosphorylation. Science 2006; 313: 976–979.
40. Sensi SL, Yin HZ, Carriedo SG, Rao SS, Weiss JH. Preferential Zn2+ influx through Ca2 +-permeable AMPA/kainate channels triggers prolonged mitochondrial superoxide produc-tion. Proc Natl Acad Sci USA 1999; 96: 2414–2419.
41. McCrossan ZA, Roepke TK, Lewis A, Panaghie G, Abbott GW. Regulation of the Kv2.1 potassium channel by MinK and MiRP1. J Membr Biol 2009; 228: 1–14.
Cell Death and Disease is an open-access journal published by Nature Publishing Group. This work is licensed under a Creative Commons Attribution 4.0 International License. The images or other third party material in this article are included in the article’s Creative Commons license, unless indicated otherwise in the credit line; if the material is not included under the Creative Commons license, users will need to obtain permission from the license holder to reproduce the material. To view a copy of this license, visit http://creativecommons.org/licenses/by/4.0/
Supplementary Information accompanies this paper on Cell Death and Disease website (http://www.nature.com/cddis)
3xTg-AD mice and hyperexcitability V Frazziniet al
![Figure 1 3xTg-AD hippocampal neurons show increased [Ca 2+ ]](https://thumb-eu.123doks.com/thumbv2/123dokorg/5016600.55201/3.892.76.817.115.667/figure-xtg-ad-hippocampal-neurons-increased-ca.webp)

![Figure 5 Pharmacological blockade of Kv2.1 decreases I K and enhances [Ca 2+ ] i spike frequency in Non-Tg neurons](https://thumb-eu.123doks.com/thumbv2/123dokorg/5016600.55201/7.892.74.813.115.689/figure-pharmacological-blockade-decreases-enhances-spike-frequency-neurons.webp)
![Figure 6 Pharmacological blockade of Kv2.1 does not affect I k currents and [Ca 2+ ] i spike frequency in 3xTg-AD neurons](https://thumb-eu.123doks.com/thumbv2/123dokorg/5016600.55201/8.892.158.745.117.620/figure-pharmacological-blockade-affect-currents-spike-frequency-neurons.webp)