Atmos. Chem. Phys., 13, 6239–6261, 2013 www.atmos-chem-phys.net/13/6239/2013/ doi:10.5194/acp-13-6239-2013
© Author(s) 2013. CC Attribution 3.0 License.
EGU Journal Logos (RGB)
Advances in
Geosciences
Open Access
Natural Hazards
and Earth System
Sciences
Open AccessAnnales
Geophysicae
Open AccessNonlinear Processes
in Geophysics
Open AccessAtmospheric
Chemistry
and Physics
Open AccessAtmospheric
Chemistry
and Physics
Open Access DiscussionsAtmospheric
Measurement
Techniques
Open AccessAtmospheric
Measurement
Techniques
Open Access DiscussionsBiogeosciences
Open Access Open Access
Biogeosciences
DiscussionsClimate
of the Past
Open Access Open Access
Climate
of the Past
Discussions
Earth System
Dynamics
Open Access Open Access
Earth System
Dynamics
DiscussionsGeoscientific
Instrumentation
Methods and
Data Systems
Open Access
Geoscientific
Instrumentation
Methods and
Data Systems
Open Access DiscussionsGeoscientific
Model Development
Open Access Open Access
Geoscientific
Model Development
DiscussionsHydrology and
Earth System
Sciences
Open AccessHydrology and
Earth System
Sciences
Open Access DiscussionsOcean Science
Open Access Open Access
Ocean Science
Discussions
Solid Earth
Open Access Open Access
Solid Earth
DiscussionsOpen Access Open Access
The Cryosphere
Natural Hazards
and Earth System
Sciences
Open Access
Discussions
Quantifying the impact of BOReal forest fires on Tropospheric
oxidants over the Atlantic using Aircraft and Satellites (BORTAS)
experiment: design, execution and science overview
P. I. Palmer1, M. Parrington1, J. D. Lee2, A. C. Lewis2, A. R. Rickard3,*, P. F. Bernath2,**, T. J. Duck4, D. L. Waugh5, D. W. Tarasick6, S. Andrews7, E. Aruffo8,9, L. J. Bailey4, E. Barrett1, S. J.-B. Bauguitte10, K. R. Curry4, P. Di Carlo8,9, L. Chisholm5, L. Dan11, G. Forster12, J. E. Franklin4, M. D. Gibson13, D. Griffin11, D. Helmig14, J. R. Hopkins2, J. T. Hopper4, M. E. Jenkin15, D. Kindred16, J. Kliever11, M. Le Breton17, S. Matthiesen1, M. Maurice11, S. Moller2, D. P. Moore18, D. E. Oram12, S. J. O’Shea17, R. C. Owen19, C. M. L. S. Pagniello4, S. Pawson18, C. J. Percival17, J. R. Pierce4, S. Punjabi7, R. M. Purvis2, J. J. Remedios18, K. M. Rotermund4, K. M. Sakamoto4, A. M. da Silva20, K. B. Strawbridge6, K. Strong11, J. Taylor17, R. Trigwell1, K. A. Tereszchuk7, K. A. Walker11, D. Weaver11, C. Whaley11, and J. C. Young3
1School of GeoSciences, University of Edinburgh, Edinburgh, UK
2National Centre for Atmospheric Science (NCAS), Department of Chemistry, University of York, York, UK 3National Centre for Atmospheric Science (NCAS), School of Chemistry, University of Leeds, Leeds, UK 4Department of Physics and Atmospheric Science, Dalhousie University, Halifax, Nova Scotia, Canada 5Meteorological Service of Canada, Dartmouth, Nova Scotia, Canada
6Environment Canada, Toronto, Ontario, Canada 7Department of Chemistry, University of York, York, UK
8Center of Excellence CETEMPS, University of L’Aquila, L’Aquila, Italy
9Department of Physical and Chemical Sciences, University of L’Aquila, L’Aquila, Italy 10Facility for Airborne Atmospheric Measurements, Bedford, UK
11Department of Physics, University of Toronto, Toronto, Ontario, Canada
12National Centre for Atmospheric Science (NCAS), School of Environmental Sciences, University of East Anglia, Norwich,
UK
13Department of Process Engineering and Applied Science, Dalhousie University, Halifax, Nova Scotia, Canada 14Institute of Arctic and Alpine Research, University of Colorado, Boulder CO, USA
15Atmospheric Chemistry Services, Okehampton, Devon, UK 16UK Meteorological Office, Exeter, UK
17School of Earth, Atmospheric and Environmental Sciences, University of Manchester, Manchester, UK 18Department of Physics and Astronomy, University of Leicester, Leicester, UK
19Department of Geological and Mining Engineering Sciences, Michigan Technological University, Houghton, MI, USA 20Global Modeling and Assimilation Office, NASA Goddard Space Flight Center, Greenbelt, MD, USA
*now at: National Centre for Atmospheric Science (NCAS), Department of Chemistry, University of York, York, UK **now at: Department of Chemistry & Biochemistry, Old Dominion University, Norfolk VA, USA
Correspondence to: P. I. Palmer ([email protected])
Received: 12 December 2012 – Published in Atmos. Chem. Phys. Discuss.: 14 February 2013 Revised: 24 May 2013 – Accepted: 26 May 2013 – Published: 1 July 2013
Abstract. We describe the design and execution of the
BOR-TAS (Quantifying the impact of BOReal forest fires on Tro-pospheric oxidants over the Atlantic using Aircraft and Satel-lites) experiment, which has the overarching objective of un-derstanding the chemical aging of air masses that contain the
emission products from seasonal boreal wildfires and how these air masses subsequently impact downwind atmospheric composition. The central focus of the experiment was a two-week deployment of the UK BAe-146-301 Atmospheric Re-search Aircraft (ARA) over eastern Canada, based out of
Halifax, Nova Scotia. Atmospheric ground-based and sonde measurements over Canada and the Azores associated with the planned July 2010 deployment of the ARA, which was postponed by 12 months due to UK-based flights related to the dispersal of material emitted by the Eyjafjallaj¨okull volcano, went ahead and constituted phase A of the experi-ment. Phase B of BORTAS in July 2011 involved the same atmospheric measurements, but included the ARA, special satellite observations and a more comprehensive ground-based measurement suite. The high-frequency aircraft data provided a comprehensive chemical snapshot of pyrogenic plumes from wildfires, corresponding to photochemical (and physical) ages ranging from < 1 day to& 10 days, largely by virtue of widespread fires over Northwestern Ontario. Airborne measurements reported a large number of emitted gases including semi-volatile species, some of which have not been been previously reported in pyrogenic plumes, with the corresponding emission ratios agreeing with previous work for common gases. Analysis of the NOy data shows
evidence of net ozone production in pyrogenic plumes, con-trolled by aerosol abundance, which increases as a function of photochemical age. The coordinated ground-based and sonde data provided detailed but spatially limited informa-tion that put the aircraft data into context of the longer burn-ing season in the boundary layer. Ground-based measure-ments of particulate matter smaller than 2.5 µm (PM2.5) over
Halifax show that forest fires can on an episodic basis repre-sent a substantial contribution to total surface PM2.5.
1 Introduction
The Quantifying the impact of BOReal forest fires on Tropo-spheric oxidants over the Atlantic using Aircraft and Satel-lites (BORTAS) experiment was conducted during July– August 2010 and 2011 (phases A and B, respectively), and was funded by the UK Natural Environmental Research Council, with meteorological field support from the UK Me-teorological Office and Environment Canada. The overar-ching objective of BORTAS was to better understand the chemical evolution of plumes emitted from the burning of biomass, with a particular emphasis on the net production of tropospheric ozone (O3) and downwind impacts on air
qual-ity. Our sub-objectives include (i) sampling biomass burning outflow from boreal North America over the western bound-ary of the North Atlantic during summer 2011 using the UK BAe-146-301 Atmospheric Research Aircraft; (ii) describ-ing observed chemistry within plumes by usdescrib-ing the measure-ments to constrain a near-explicit chemical mechanism, with particular attention to the NOy and organic chemistry; (iii)
deriving a reduced chemical mechanism suitable for a global chemistry transport model (CTM) that accurately describes chemistry within the plumes; (iv) quantifying the impact of boreal forest fires on oxidant chemistry over the temperate
and subtropical Atlantic using a nested 3-D CTM, driven by a reduced version of the near-explicit chemical mecha-nism and by assimilated field measurements; and (v) detect-ing, validating and quantifying the impact of boreal biomass burning on global tropospheric composition using data from space-borne sensors. To address these objectives, BORTAS integrated a number of concurrent activities: (1) airborne in situ measurements; (2) space-borne measurements; (3) bal-loon, ground-based in situ and remote-sensed measurements in Canada and the Azores; (4) near-explicit tropospheric chemical modelling; (5) regional and global chemistry trans-port models; and (6) inverse models. This paper provides an overview of BORTAS-B with an emphasis on the summer measurement campaign; BORTAS-A was described by Par-rington et al. (2012).
Over the past 20 yr (1990–2011), Canadian forest fires have burned a median of 1.7 million hectares yr−1, ranging
from 626 000 hectares in 2001 to over 7 million hectares in 1995 (data from Natural Resources Canada), with a year-to-year variability partly explained by large-scale changes in climate (e.g. the El Ni˜no–Southern Oscillation). Although this is a small fraction of the forested land (0.1–1.8 %), it represents a substantial input of carbonaceous material and trace gases released to the atmosphere. The predominant tree species (by volume) include coniferous spruce (53 %), pine (9 %), and broadleaf poplar (12 %), which determine the distribution of natural emission of biogenic volatile organic compounds but also the release of volatiles as part of pyrol-ysis associated with forest fire (Drysdale, 2008).
Tropospheric O3 is a regulated secondary air pollutant
because at elevated concentrations it is linked with human respiratory illness and damage to vascular plants with im-plications for food production and biogeochemical cycling. A considerable body of work has shown that long-range transport of O3and its photochemical precursors can
repre-sent a significant contribution to background O3over
down-wind continents and in some circumstances result in an in-creased number of days that exceed the regulated threshold concentration. The role of seasonal wildfires on this long-range transport of pollution remains unclear, partly because of its large year-to-year variability and partly because there remains substantial uncertainty in our understanding of the chemistry within these plumes. The primary focus of BOR-TAS is to understand the production and loss of O3within
plumes emitted from boreal forest fires as they are trans-ported across the North Atlantic towards Europe.
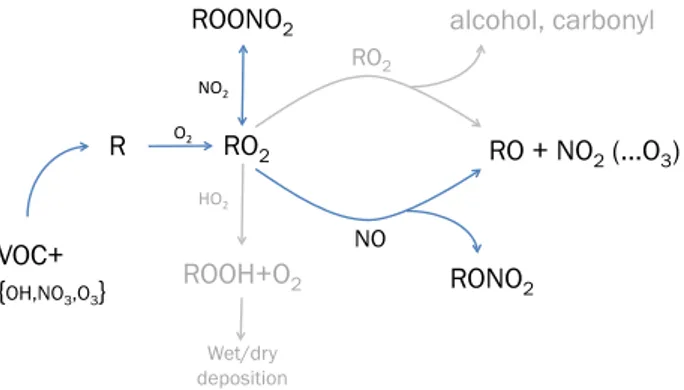
Figure 1 shows a simplified schematic of the general at-mospheric chemical system (Atkinson and Arey, 2003) that is the focus of BORTAS. We start on the left-hand side with an emitted volatile organic compound (VOC) being oxidized by a common atmospheric oxidant OH, NO3 or O3,
result-ing in the production of an alkyl radical R that rapidly reacts with molecular oxygen to form peroxy radicals (HO2, RO2).
The fate of peroxy radicals depends on the photochemical environment. In a pyrogenic environment, where levels of
RO2 ROOH+O2 Wet/dry deposition ROONO2 R !"# $!"# %!"# VOC+ {OH,NO3,O3} RONO2 RO + NO2 (...O3) alcohol, carbonyl RO2 NO
Fig. 1. A schematic of the atmospheric chemical system studied within BORTAS (Atkinson and Arey, 2003).
nitrogen oxides (NO + NO2= NOx) are significantly elevated
above ambient concentrations, RO2 typically proceeds via
the RO2+NO and RO2+NO2routes. RO2+NO proceeds
via two channels resulting in the production of alkyl nitrates (RONO2) and/or the production of RO and NO2, which can
lead to the formation of O3via NO2photolysis. RO2+NO2
can also lead to the formation of ROONO2. Here, we focus
on the peroxy acyl nitrates, where RO2is R0C(O)OO. Peroxy
acyl nitrates are thermally stable at temperatures lower than
<263 K, typical of the free and upper troposphere, resulting in an atmospheric lifetime of months so that it can be trans-ported over long distances; in contrast, their lifetime in the lower troposphere (> 287 K) is minutes to hours. The most abundant peroxy acyl nitrates in the troposphere are peroxy-acetyl nitrate (PAN, CH3C(O)O2NO2) and peroxypropionyl
nitrate (PPN, CH3CH2(O)O2NO2), with PAN representing
75–90 % of the total PAN concentration. PAN is effectively a thermally controlled reservoir for reactive nitrogen, delay-ing subsequent chemistry. Previous studies have shown that RO2+HO2is still a significant sink of RO2in a pyrogenic
environment, producing peroxides (H2O2 and
hydroperox-ides, ROOH), with H2O2readily removed by wet deposition.
ROOH, which is much less soluble than H2O2, has an
atmo-spheric lifetime of 2–3 days and can produce alkoxy radicals (via photolysis) and aldehydes and recycle RO2via OH
ox-idation. A recent review of chemistry measurements of py-rogenic plumes highlights that, based on the enhancement ratio of 1O3/1CO (a common, brute-force metric for
char-acterizing O3production), there is no canonical theory of O3
chemistry within plumes (Jaffe and Wigder, 2012, and refer-ences therein; Monks et al., 2009, and referrefer-ences therein). This is not surprising given the combined effects of large variations in, for example, fuel type/loading, combustion ef-ficiency (and subsequent emitted VOC amounts), meteoro-logical and photochemical environments (e.g. convective en-ergy, and aerosol and cloud characteristics), and the age of the measured plumes on the chemical system.
The impetus for BORTAS was a small number of py-rogenic air masses originating from Northern Canada and Alaska that were intercepted during the 2004 UK Inter-national Transport of Ozone and Precursors (ITOP) mea-surement campaign, which was part of the larger Interna-tional Consortium for Atmospheric Research on Transport and Transportation (ICARTT). The main focus of ICARTT was to characterize the air quality over the North Atlantic, with an emphasis on long-range transport of anthropogenic pollution. The pyrogenic air masses were identified by a dis-tinct distribution of primary chemical markers (CO, ethene, acetlyene, and benzene), accompanied by elevated concen-trations of PAN (Lewis et al., 2007). Analysis of these air masses revealed no robust relationship between CO and O3.
In a case study, one pyrogenic plume, sampled at three differ-ent locations as it travelled across the North Atlantic, showed a net increase (17 ppb) in O3and a concurrent decrease in CO
over the five-day period. A Lagrangian model, used to under-stand the responsible chemical processes as the plume trav-elled over the North Atlantic, highlighted the role of aerosol in slowing both the production and loss of O3, but found the
plume remained chemically active, mainly driven by the ther-mal decomposition of PAN as it descended through the free troposphere (Real et al., 2007). Real et al. (2007) also found that the model reproduced the change in 1O3/1CO
(nega-tive to posi(nega-tive) over the North Atlantic, confirming that the change in O3was due to photochemistry rather than dilution.
The BAe-146 aircraft payload during BORTAS, described below, included instruments to better speciate the NOy
bud-get and characterize aerosols, including semi-volatiles. The NASA Arctic Research of the Composition of the Tro-posphere from Aircraft and Satellites (ARCTAS) 2008 cam-paign included a scientific objective on quantifying emis-sions from boreal forest fires and the near-field chemical evo-lution of the fire plumes (Jacob et al., 2010; Singh et al., 2010). During the spring (April) phase over Alaska, ARC-TAS investigators intercepted Alaskan air masses (3–8 days old) and found evidence of O3 production, but during the
summer phase (June–July) over Western Canada they sam-pled mainly young, near-field plumes (< 1 day) and evidence supporting net O3production was inconclusive. During the
summer phase they showed that 40 % of the NOxwas
con-verted to PAN within a few hours of emission, thereby lim-iting the immediate reactivity within the plume (Alvarado et al., 2010). Model analyses of these data concluded that forest fire plumes have little impact on the median O3profile
over Canada (Alvarado et al., 2010). During BORTAS, ow-ing to large-scale fires in Northwest Ontario, we were able to sample pyrogenic plumes with a range of photochemical ages, providing us with an excellent opportunity to better understand the photochemical aging processes within these plumes.
This paper describes the experimental design of the BORTAS-B airborne campaign, which was conducted dur-ing 12 July–3 August 2011. This includes an overview of
BORTAS-B, incorporating a description of the fire activity and meteorology (Sect. 2) for the time period; a detailed de-scription of the ground-based, airborne, and space-borne in-struments that supported the BORTAS-B campaign (Sect. 3); and a description of first results (Sect. 4) from individual re-search groups from the BORTAS-B science team, including descriptions of the modelling strategies that are the subjects of individual papers. We conclude in Sect. 5.
2 Campaign overview
To determine the optimal time and location of the mea-surement campaign, we used the GEOS-Chem atmospheric chemistry transport model driven by NASA GEOS-5 re-analysis meteorology (Sect. 3.5) to study the atmospheric transport of year-specific biomass burning emissions over Canada, acknowledging substantial year-to-year variations in the emissions and transport pathways. Based on that anal-ysis we identified late July as the period that would give us the largest probability of intercepting near-field (within Canada) and far-field (e.g. from boreal Asia) plumes. We also identified Halifax, Nova Scotia, as the optimal locus for our base of operations for the BAe-146 ARA, giving us access to long-range transported plumes at high latitudes and near-field plumes that tend to remain close to the latitude of emis-sion. As we discuss below, choosing Halifax also provided us with an opportunity to work with the ground-based mea-surement community, which greatly enhanced the originally planned science.
BORTAS has four major elements: the Canadian ground-based network, the BAe-146 Atmospheric Research Aircraft (ARA), satellite observations, and the computer modelling of atmospheric chemistry and transport, all of which contribute to the scientific objectives of the campaign and are discussed in detail below.
BORTAS was originally planned for summer 2010, but the BAe-146 ARA was grounded for civil contingency fly-ing associated with the dispersal of volcanic aerosol from the eruption of Eyjafjallaj¨okull (Dacre et al., 2012). We de-cided to run the campaign as planned (12 July–3 August 2010) but without the ARA, providing an important dry-run for the modelling and ground-based measurement teams; we hereinafter refer to this as Phase A of the campaign (BORTAS-A). Deployment of the ARA in 2011 during 12 July–3 August is Phase B of BORTAS (BORTAS-B) and is the main subject of this paper.
2.1 Fire activity
Figure 2 shows the time and location of active fires over the Northern Hemisphere during Phases A and B of BORTAS. In many respects, the number and distribution of July fires over high northern latitudes during 2010 were closer to cli-matological values than 2011, with the exception of fire
ac-tivity over Russia. During 2011 there was substantially less burning over the Chukotka and Kamchatka federal subjects of Russia. Fires over Canada during BORTAS-B were com-paratively early, with large wildfires near Richardson Back-country and Slave Lake, Alberta, starting in May, which re-moved some of the combustible material in that area that would have typically burned later in the summer (see 2010 vs. 2011). BORTAS-B was largely characterized by a small number of large near-field fires over Northwestern Ontario which started and completed during the campaign and sub-stantial far-field fires from boreal Asia. Tree species over this region include pine (Pinus banksiana, Pinus resinosa,
Pi-nus strobus), spruce (Picea glauca, Picea mariana), poplar
(Populus basalmifera), aspen (Populus grandidentata,
Popu-lus tremuloides), maple (Acer rubrum), fir (Abies balsamea),
birch (Betula papyrifera), ash (Fraxinus nigra), and tamarack (Larix laricina).
2.2 Meteorological overview for BORTAS-A and BORTAS-B
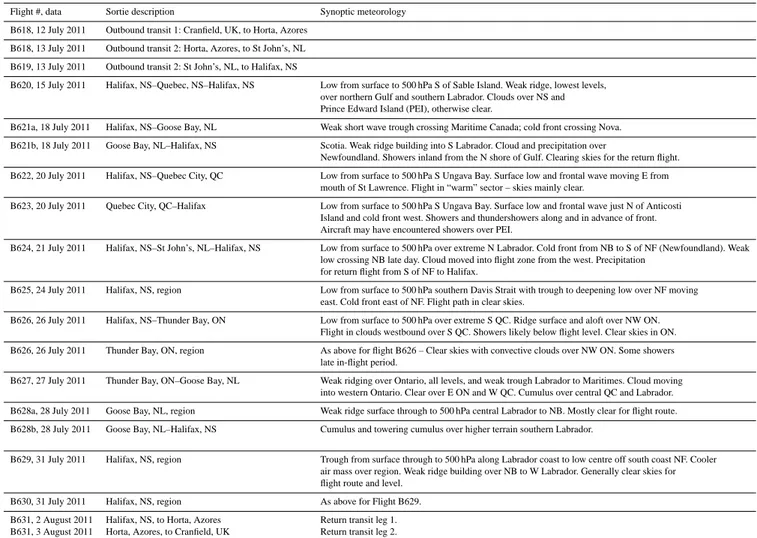
Figure 3 shows the climatological mean (15 July–3 August, 1981–2010) vector winds in the free troposphere (500 hPa) over North America and those fields corresponding to the BORTAS-A and BORTAS-B period, suggesting that pollu-tants will generally follow a west to east flow pattern, with a strong flow from NW Ontario often increasing in forward speed as the vector winds depart the east coast of North America and head toward the European continent. This fea-ture of transport over the North Atlantic is regulated by the location and strength of the polar vortex and the mid-North Atlantic subtropical high.
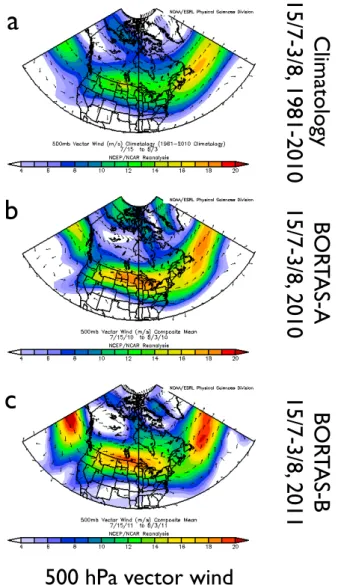
Figure 4 shows that the mean daily accumulated precip-itation during BORTAS-A was close to climatological val-ues over Maritime Canada but drier than climatology across central Quebec and Ontario. During BORTAS-B precipi-tation was generally drier than climatology over Maritime Canada and across Western Canada. An example of the role of precipitation in the transport of pyrogenic aerosol during BORTAS-B is reported by Griffin et al. (2013) and Franklin et al. (2013).
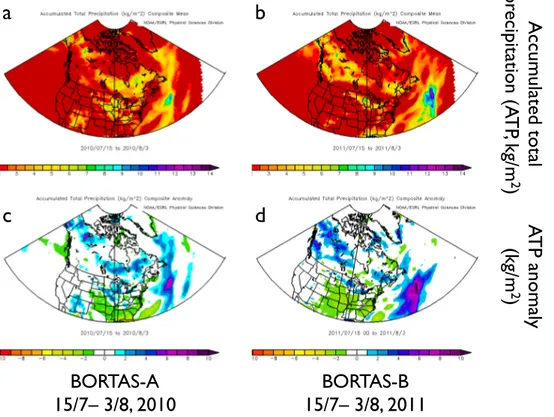
Below, we present synoptic meteorological fields, inter-preting them in terms of atmospheric flow, that occurred during the BORTAS-B field measurement intensive and dis-cuss them in context with BORTAS-A and the climatological mean for the same period. Table 1 provides a brief descrip-tion of the meteorology associated with each BORTAS-B flight.
2.2.1 Mid-troposphere
Figure 5a shows the climatological (1981–2010) mid-tropospheric flow (500 hPa) for North America for the pe-riod 15 July–3 August, which is similar to the first two weeks of July and shows a trough over Hudson Bay across
Table 1. Synoptic meteorology and weather associated with BORTAS flights over Canada. Flight #, data Sortie description Synoptic meteorology
B618, 12 July 2011 Outbound transit 1: Cranfield, UK, to Horta, Azores B618, 13 July 2011 Outbound transit 2: Horta, Azores, to St John’s, NL B619, 13 July 2011 Outbound transit 2: St John’s, NL, to Halifax, NS
B620, 15 July 2011 Halifax, NS–Quebec, NS–Halifax, NS Low from surface to 500 hPa S of Sable Island. Weak ridge, lowest levels, over northern Gulf and southern Labrador. Clouds over NS and Prince Edward Island (PEI), otherwise clear.
B621a, 18 July 2011 Halifax, NS–Goose Bay, NL Weak short wave trough crossing Maritime Canada; cold front crossing Nova. B621b, 18 July 2011 Goose Bay, NL–Halifax, NS Scotia. Weak ridge building into S Labrador. Cloud and precipitation over
Newfoundland. Showers inland from the N shore of Gulf. Clearing skies for the return flight. B622, 20 July 2011 Halifax, NS–Quebec City, QC Low from surface to 500 hPa S Ungava Bay. Surface low and frontal wave moving E from
mouth of St Lawrence. Flight in “warm” sector – skies mainly clear.
B623, 20 July 2011 Quebec City, QC–Halifax Low from surface to 500 hPa S Ungava Bay. Surface low and frontal wave just N of Anticosti Island and cold front west. Showers and thundershowers along and in advance of front. Aircraft may have encountered showers over PEI.
B624, 21 July 2011 Halifax, NS–St John’s, NL–Halifax, NS Low from surface to 500 hPa over extreme N Labrador. Cold front from NB to S of NF (Newfoundland). Weak low crossing NB late day. Cloud moved into flight zone from the west. Precipitation
for return flight from S of NF to Halifax.
B625, 24 July 2011 Halifax, NS, region Low from surface to 500 hPa southern Davis Strait with trough to deepening low over NF moving east. Cold front east of NF. Flight path in clear skies.
B626, 26 July 2011 Halifax, NS–Thunder Bay, ON Low from surface to 500 hPa over extreme S QC. Ridge surface and aloft over NW ON. Flight in clouds westbound over S QC. Showers likely below flight level. Clear skies in ON. B626, 26 July 2011 Thunder Bay, ON, region As above for flight B626 – Clear skies with convective clouds over NW ON. Some showers
late in-flight period.
B627, 27 July 2011 Thunder Bay, ON–Goose Bay, NL Weak ridging over Ontario, all levels, and weak trough Labrador to Maritimes. Cloud moving into western Ontario. Clear over E ON and W QC. Cumulus over central QC and Labrador. B628a, 28 July 2011 Goose Bay, NL, region Weak ridge surface through to 500 hPa central Labrador to NB. Mostly clear for flight route. B628b, 28 July 2011 Goose Bay, NL–Halifax, NS Cumulus and towering cumulus over higher terrain southern Labrador.
B629, 31 July 2011 Halifax, NS, region Trough from surface through to 500 hPa along Labrador coast to low centre off south coast NF. Cooler air mass over region. Weak ridge building over NB to W Labrador. Generally clear skies for flight route and level.
B630, 31 July 2011 Halifax, NS, region As above for Flight B629. B631, 2 August 2011 Halifax, NS, to Horta, Azores Return transit leg 1. B631, 3 August 2011 Horta, Azores, to Cranfield, UK Return transit leg 2.
12 19 26 34 Day starting July 12th 2010 2011 a b 12 19 26 34 Day starting July 12th 2010 2011 a b
Fig. 2. Time and location of active fires during 12 July–3 August 2010 (a) and 2011 (b), informed by the ATSR radiance measure-ments (Mota et al., 2006). The colour denotes the day number, start-ing on 12 July. ATSR fire count data are from ATSR-WFA, from the Data User Element of the European Space Agency.
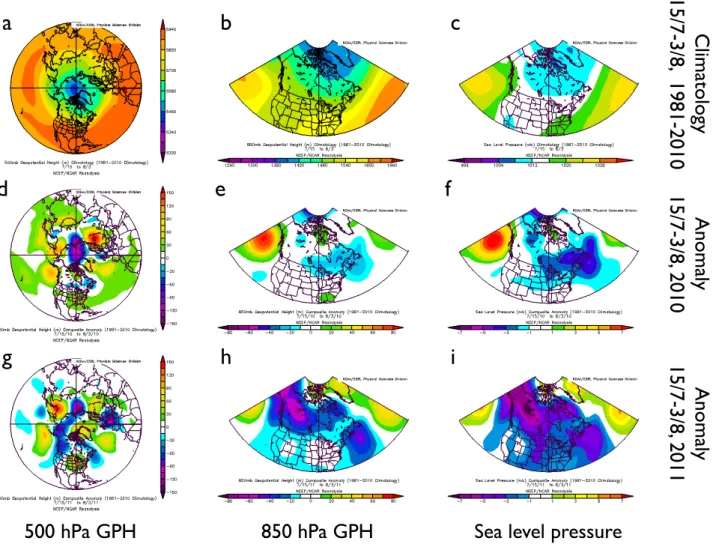
Quebec to Greenland and Iceland. Figure 5d shows that the 2010 flow was similar to the climatological pattern with only weak positive anomalies in height over North America and stronger positive anomalies with ridging off the west coast of Canada and over European Russia and far eastern Siberia and Kamchatka. This is in contrast to the BORTAS-B period in Fig. 5g, with strong positive anomalies in geopotential height over the upper Mississippi, the North Pacific and a dra-matic positive height anomaly over eastern Siberia. A pos-itive anomaly also lies over the mid-North Atlantic, cover-ing all of Greenland, possibly resultcover-ing in a more northerly route for the North Atlantic transport to the European con-tinent. Labrador and Maritime Canada had negative anoma-lies along with Alaska and British Columbia. The Maritime Canada negative anomaly is indicative of the cooler and cloudy weather that occurred during BORTAS-B.
Cl
ima
to
lo
gy
15/
7-3/
8,
1981-2010
!
BO
RT
AS-A
15/
7-3/
8,
2010
!
BO
RT
AS-B
15/
7-3/
8,
2011
!
500 hPa vector wind!
a!
b!
c!
Fig. 3. Climatological mean 500 hPa wind vector (m s−1) over North America for 15 July–3 August for the period 1981-2010 (a), and the corresponding departure of those means for 15 July–3 Au-gust 2010 (b) and for 15 July–3 AuAu-gust 2011 (c). Image provided by the NOAA/ESRL Physical Science Division, Boulder, Colorado (http://www.esrl.noaa.gov/psd/data/composites/day).
2.2.2 Lower troposphere
Figure 5b shows the climatological mean 850 hPa surface during the BORTAS period. The pattern maintains ridging over the NE Pacific, the subtropical anticyclone over the mid-North Atlantic, with a minor trough from a low in the northern Davis Strait to the northern Labrador Sea. Figure 5e shows that the anomaly for 2010 has a strong positive varia-tion over the NE Pacific and a weak negative variavaria-tion over central Quebec with an extension to Northwestern Ontario and just south of Newfoundland and east of Nova Scotia. Figure 5h shows that for 2011 there are stronger negative anomalies to the southeast of Nova Scotia, south of Sable
Island with a trough to Hudson Bay then extending west to northern Saskatchewan to the upper Mackenzie Valley and Yukon. A slight positive anomaly lay to the south of the Great Lakes, again indicative of the surface and upper ridging that favoured the development of forest fires in Northwestern On-tario.
2.2.3 Surface
Figure 5c shows the climatological mean sea level pattern over North America for the BORTAS period, which shows a weak pressure pattern with a few isobars due to continued ridging associated with the subtropical anticyclone off the western North Atlantic and the ridge over the northeast Pa-cific, and a low over Baffin Island with a weak trough to the central and western US. Figure 5f shows that the anomaly pattern for 2010 has a strong high over the northeast Pacific off British Columbia and a low pressure area south of New-foundland with a trough to Northwestern Ontario and then along the tree line to Great Slave Lake, Northwest Territo-ries. Figure 5i shows a more dramatic anomaly pattern in 2011 with lower pressure south of Newfoundland and east of Nova Scotia, a low on southern Baffin Island and a signifi-cant negative anomaly over Yukon and Northwest Territories to Northwestern Ontario. A potential result of the pattern for 2011 is that more synoptic low pressure systems transited from west to east than is the norm. In summary, the surface synoptic pattern for 2011 commenced with an area of high pressure in the earlier portion of the study, then quickly gave way to the intrusion of frontal troughs, weak low pressure systems and shifts of wind from the southwest to the west and northwest. A respite from this dynamic pattern occurred on 29 July as a short-lived ridge moved across Atlantic Canada.
3 BORTAS-B measurements
3.1 BAe-146 aircraft payload and deployment
The BAe-146 aircraft has an endurance of approximately 5.5 h with a full science payload (4.2 tons) and has a science speed of 200 knots calibrated airspeed (103 m s−1CAS), re-sulting in a standard air range of approximately 2000 km at sea level, increasing to 3300 km at a typical maximum work-ing standard pressure altitude (sHp) of 30 000 ft (9.1 km); for A-to-A flights with varying altitudes and time on station, this typically gave a working radius of about 900 km, and for A-to-B science flights a range of about 1800 km. Table 2 shows the BAe-146 instrument payload during BORTAS-B, including the averaging times for each instrument. The pay-load reflects the core science objectives of characterizing the chemical processing of pyrogenic air masses with measure-ments of total alkyl nitrates, total peroxy nitrates, total NOy,
NO, NO2, and PAN.
Before entering the BORTAS in-theatre domain, the air-craft transited from Cranfield UK (where it is based) to
BORTAS-A
15/7– 3/8, 2010!
15/7– 3/8, 2011!
BORTAS-B
Accum
ul
ated
to
ta
l
pr
eci
pi
ta
tio
n
(A
TP
, kg
/m
2)!
ATP
ano
ma
ly
(kg
/m
2)!
a!
b!
c!
d!
Fig. 4. Daily mean accumulated precipitation (kg m−2) over North America for 15 July–3 August, 2010 (a) and 2011 (b), and the associated anomalies for 2010 (c) and 2011 (d) with respect to the 1981-2010 climatological mean. Image provided by the NOAA/ESRL Physical Science Division, Boulder, Colorado (http://www.esrl.noaa.gov/psd/data/composites/day).
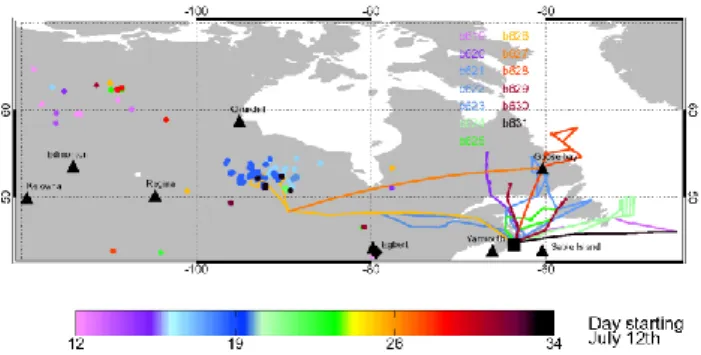
Horta, Azores, on 12 July 2011; from Horta, Azores, to St John’s, Newfoundland, on 13 July 2011; and from St John’s, Newfoundland, to Halifax on 13 July 2011. Figure 6 shows the 13 non-transit BORTAS-B flights and the location of active ozonesonde launch sites (Table 3) and Along-Track Scanning Radiometer (ATSR) fire counts. With the excep-tion of flight B624 when there was no Thermal Dissocia-tion Laser Induced Fluorescence (TD-LIF) NOydata, all
in-struments were operational and reported data for all flights shown. Table 1 summarizes each BORTAS-B flight, includ-ing outbound and inbound transit legs; a total of 77 h, 28 min, and 33 s. The BAe-146 spent most of the time sampling in the free troposphere, with more than a third of the time between 6 and 9 km.
3.2 Dalhousie Ground Station (DGS) and additional Canadian sites
Wherever possible we coordinated surface measurements with the BORTAS-B aircraft deployment to improve under-standing of the transport of pyrogenic plumes as they trav-elled over Canada. The DGS represents a coordinated mea-surement activity conducted at a height of 65 m above mean sea level on the roof of the Sir James Dunn building at Dal-housie University (44.64◦N, 63.59◦W), including investiga-tors from Dalhousie University, Environment Canada,
Uni-versity of Toronto, and UniUni-versity of Sherbrooke. Table 4 summarizes the individual instruments that participated in the DGS activity during BORTAS-B. BORTAS flight B623 explicitly included profile measurements around the DGS. Some of the DGS scientific activities are briefly discussed below.
The University of Toronto Atmospheric Observatory (TAO), located at 43.66◦N, 79.40◦W and 174 m a.s.l. on the 16th floor of the Burton Tower of the McLennan Phys-ical Laboratories in downtown Toronto, included in particu-lar an ABB Bomem DA8 FTIR Spectrometer (Wiacek et al., 2007) similar to the instrument housed at Dalhousie Univer-sity. Work within BORTAS-B led by DGS investigators has found instances where pyrogenic plume pass over both the TAO and DGS, providing an opportunity to study the chem-ical evolution of a plume (Griffin et al., 2013; Franklin et al., 2013).
Coordinated additional launches of ozonesondes, in col-laboration with Environment Canada, were used to help char-acterize the vertical distribution of O3 associated with
py-rogenic plumes. Table 3 shows the key launch sites during BORTAS-B; for interest, Table 3 also shows the correspond-ing launches for 2010 which were supportcorrespond-ing another mea-surement intensive to understand stratosphere–troposphere exchange (Bourqui et al., 2012). The 2010 ozonesonde data
a!
b!
c!
d!
e!
f!
g!
h!
i!
500 hPa GPH!
850 hPa GPH!
Sea level pressure!
Cl
ima
to
lo
gy
15/
7-3/
8,
1981-2010
!
Ano
ma
ly
15/
7-3/
8,
2010
!
Ano
ma
ly
15/
7-3/
8,
2011
!
Fig. 5. Climatological mean 500 hPa (a) and 850 hPa (b) geopotential heights (GPH, expressed in metres, m) and sea level pressure (mb) (c) for 15 July–3 August for the period 1979–1995, and the corresponding departures from those means for 15 July–3 August 2010 (d–f) and for 15 July–3 August 2011 (g–i). Image provided by the NOAA/ESRL Physical Science Division, Boulder, Colorado (http://www.esrl.noaa. gov/psd/data/composites/day).
were used to help evaluate the GEOS-Chem atmospheric chemistry transport model (Parrington et al., 2012) as part of modelling activities supporting BORTAS-B.
BORTAS investigators also used data from the Canadian Operational Research Aerosol LiDAR Network (CORAL-Net) led by Environment Canada (Strawbridge, 2013), with sites at Egbert (Ontario), Sherbrooke (Quebec) and Acadia (Nova Scotia). These sites were chosen to monitor transport events as well as to investigate regional air quality issues. For further information about the LiDAR technology, the reader is referred to Strawbridge (2013).
3.3 Pico Mountain Atmospheric Research Observatory
The Pico Mountain Atmospheric Research Observatory (also known as PICO-NARE) is located in the Azores, Portu-gal (38◦28.22600N, 28◦24.23500W, 2225 m a.s.l.). Its geo-graphical location makes it ideal to study the long-range
free-tropospheric transport of pyrogenic plumes from boreal North America (Honrath et al., 2004), and provides us with an opportunity to study aged plumes after they have travelled partway across the North Atlantic. Table 5 shows the mea-surements taken during BORTAS phases A and B. As part of the outbound and inbound transit flights, the BAe-146 ARA encircled PICO-NARE in an attempt to cross-calibrate sim-ilar measurements. During July 2011 the atmospheric flow over the North Atlantic downwind of the BORTAS-B mea-surements was such that variations of CO at Pico from Cana-dian pyrogenic sources were not as prominent as in recent previous years.
3.4 Satellite observations
Validating space-borne observations associated with wild-fires was a core scientific objective of BORTAS-B, allowing us to relate the relatively small-scale data from the BAe-146
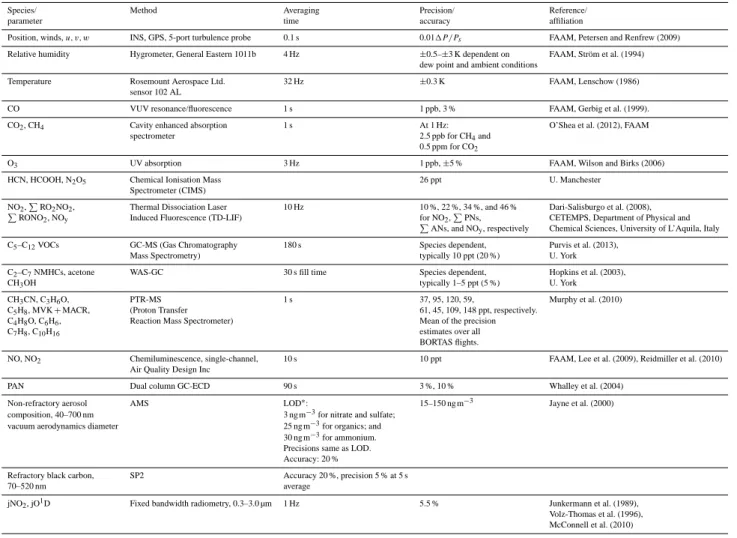
Table 2. BAe-146 payload during BORTAS.
Species/ Method Averaging Precision/ Reference/
parameter time accuracy affiliation
Position, winds, u, v, w INS, GPS, 5-port turbulence probe 0.1 s 0.011P /Ps FAAM, Petersen and Renfrew (2009)
Relative humidity Hygrometer, General Eastern 1011b 4 Hz ±0.5–±3 K dependent on FAAM, Str¨om et al. (1994)
dew point and ambient conditions
Temperature Rosemount Aerospace Ltd. 32 Hz ±0.3 K FAAM, Lenschow (1986)
sensor 102 AL
CO VUV resonance/fluorescence 1 s 1 ppb, 3 % FAAM, Gerbig et al. (1999).
CO2, CH4 Cavity enhanced absorption 1 s At 1 Hz: O’Shea et al. (2012), FAAM
spectrometer 2.5 ppb for CH4and
0.5 ppm for CO2
O3 UV absorption 3 Hz 1 ppb, ±5 % FAAM, Wilson and Birks (2006)
HCN, HCOOH, N2O5 Chemical Ionisation Mass 26 ppt U. Manchester
Spectrometer (CIMS)
NO2,P RO2NO2, Thermal Dissociation Laser 10 Hz 10 %, 22 %, 34 %, and 46 % Dari-Salisburgo et al. (2008),
P RONO2, NOy Induced Fluorescence (TD-LIF) for NO2,P PNs, CETEMPS, Department of Physical and
P ANs, and NOy, respectively Chemical Sciences, University of L’Aquila, Italy
C5–C12VOCs GC-MS (Gas Chromatography 180 s Species dependent, Purvis et al. (2013),
Mass Spectrometry) typically 10 ppt (20 %) U. York
C2–C7NMHCs, acetone WAS-GC 30 s fill time Species dependent, Hopkins et al. (2003),
CH3OH typically 1–5 ppt (5 %) U. York
CH3CN, C3H6O, PTR-MS 1 s 37, 95, 120, 59, Murphy et al. (2010)
C5H8, MVK + MACR, (Proton Transfer 61, 45, 109, 148 ppt, respectively.
C4H8O, C6H6, Reaction Mass Spectrometer) Mean of the precision
C7H8, C10H16 estimates over all
BORTAS flights.
NO, NO2 Chemiluminescence, single-channel, 10 s 10 ppt FAAM, Lee et al. (2009), Reidmiller et al. (2010)
Air Quality Design Inc
PAN Dual column GC-ECD 90 s 3 %, 10 % Whalley et al. (2004)
Non-refractory aerosol AMS LOD∗: 15–150 ng m−3 Jayne et al. (2000)
composition, 40–700 nm 3 ng m−3for nitrate and sulfate;
vacuum aerodynamics diameter 25 ng m−3for organics; and
30 ng m−3for ammonium.
Precisions same as LOD. Accuracy: 20 %
Refractory black carbon, SP2 Accuracy 20 %, precision 5 % at 5 s
70–520 nm average
jNO2, jO1D Fixed bandwidth radiometry, 0.3–3.0 µm 1 Hz 5.5 % Junkermann et al. (1989),
Volz-Thomas et al. (1996), McConnell et al. (2010)
∗Limit of detection (LOD) is based on a 30 s average, assuming a collection efficiency of 0.5.
Table 3. Environment Canada ozonesonde launch sites during BORTAS phases A (2010) and B (2011).
Site BORTAS-A launches1 BORTAS-B launches2
Alert, Nunavut (82◦N, 62◦W) 1 1
Bratt’s Lake, Saskatchewan (50◦N, 105◦W) 18 20
Churchill, Manitoba (59◦N, 94◦W) 1 –
Egbert, Ontario (44◦N, 80◦W) 16 15
Eureka, Nunavut (80◦N, 86◦W) 2 2
Goose Bay, Newfoundland (53◦N, 60◦W) 20 20
Kelowna, British Columbia (50◦N, 119◦W) 2 2
Montreal, Quebec (45◦N, 73◦W) 19 –
Resolute, Nunavut (75◦N, 95◦W) 2 1
Sable Island, Nova Scotia (44◦N, 60◦W) 19 19
Stony Plain (Edmonton), Alberta (54◦N, 114◦W) 2 2
Walsingham, Ontario (43◦N, 81◦W) 14 –
Yarmouth, Nova Scotia (44◦N, 66◦W) 19 20
112 July–3 August 2010. 212 July–3 August 2011.
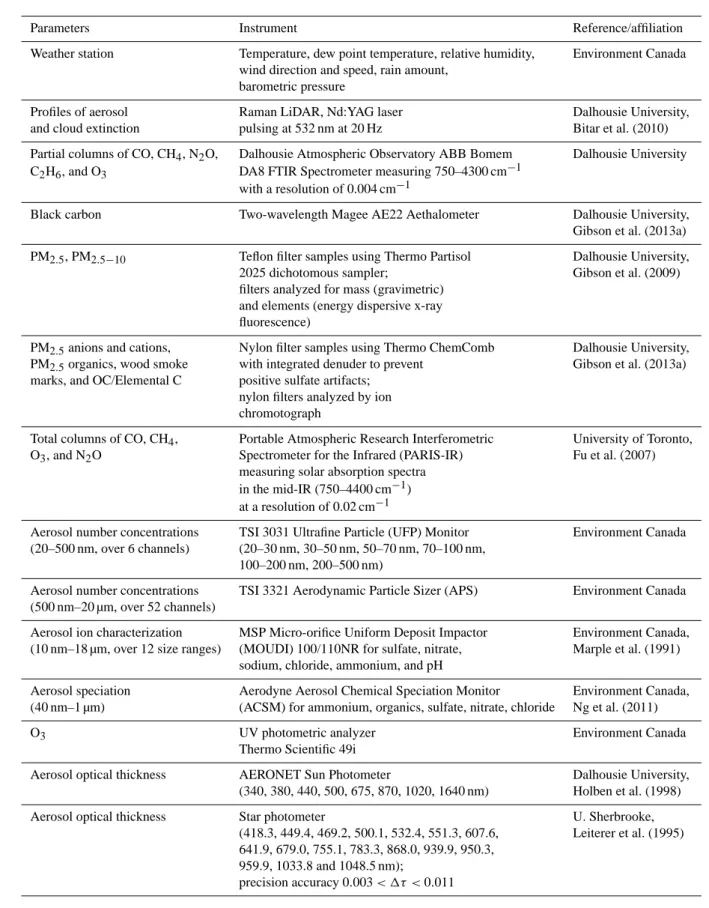
Table 4. Ground-based measurements at the Dalhousie Ground Station during BORTAS.
Parameters Instrument Reference/affiliation
Weather station Temperature, dew point temperature, relative humidity, Environment Canada wind direction and speed, rain amount,
barometric pressure
Profiles of aerosol Raman LiDAR, Nd:YAG laser Dalhousie University,
and cloud extinction pulsing at 532 nm at 20 Hz Bitar et al. (2010)
Partial columns of CO, CH4, N2O, Dalhousie Atmospheric Observatory ABB Bomem Dalhousie University
C2H6, and O3 DA8 FTIR Spectrometer measuring 750–4300 cm−1
with a resolution of 0.004 cm−1
Black carbon Two-wavelength Magee AE22 Aethalometer Dalhousie University, Gibson et al. (2013a)
PM2.5, PM2.5−10 Teflon filter samples using Thermo Partisol Dalhousie University,
2025 dichotomous sampler; Gibson et al. (2009)
filters analyzed for mass (gravimetric) and elements (energy dispersive x-ray fluorescence)
PM2.5anions and cations, Nylon filter samples using Thermo ChemComb Dalhousie University,
PM2.5organics, wood smoke with integrated denuder to prevent Gibson et al. (2013a) marks, and OC/Elemental C positive sulfate artifacts;
nylon filters analyzed by ion chromotograph
Total columns of CO, CH4, Portable Atmospheric Research Interferometric University of Toronto,
O3, and N2O Spectrometer for the Infrared (PARIS-IR) Fu et al. (2007)
measuring solar absorption spectra in the mid-IR (750–4400 cm−1) at a resolution of 0.02 cm−1
Aerosol number concentrations TSI 3031 Ultrafine Particle (UFP) Monitor Environment Canada (20–500 nm, over 6 channels) (20–30 nm, 30–50 nm, 50–70 nm, 70–100 nm,
100–200 nm, 200–500 nm)
Aerosol number concentrations TSI 3321 Aerodynamic Particle Sizer (APS) Environment Canada (500 nm–20 µm, over 52 channels)
Aerosol ion characterization MSP Micro-orifice Uniform Deposit Impactor Environment Canada, (10 nm–18 µm, over 12 size ranges) (MOUDI) 100/110NR for sulfate, nitrate, Marple et al. (1991)
sodium, chloride, ammonium, and pH
Aerosol speciation Aerodyne Aerosol Chemical Speciation Monitor Environment Canada, (40 nm–1 µm) (ACSM) for ammonium, organics, sulfate, nitrate, chloride Ng et al. (2011)
O3 UV photometric analyzer Environment Canada
Thermo Scientific 49i
Aerosol optical thickness AERONET Sun Photometer Dalhousie University,
(340, 380, 440, 500, 675, 870, 1020, 1640 nm) Holben et al. (1998)
Aerosol optical thickness Star photometer U. Sherbrooke,
(418.3, 449.4, 469.2, 500.1, 532.4, 551.3, 607.6, Leiterer et al. (1995) 641.9, 679.0, 755.1, 783.3, 868.0, 939.9, 950.3,
959.9, 1033.8 and 1048.5 nm);
Table 5. Chemical and physical atmospheric observations at the Pico Mountain Atmospheric Research Observatory during BORTAS phases A and B.
Measurement Method/instrumentation
Meteorological variables Commercial sensors for temperature, relative humidity, wind speed and direction
O3 UV absorption, Thermoenvironmental Corp. Model 49C
CO NDIR, Thermo Environmental, Inc., Model 48C-TL
NO, NO2, NOy∗ Custom-built chemiluminescence instrument
NMHCs Custom-built preconcentration system with GC-FID
(Gas Chromatography with Flame Ionization Detector) Black carbon Aethalometer, Magee Scientific Model AE31
Particle size Intracavity Optical Particle Sizer/PMS LAS-X CH4, N2O, SF6, CO, CO2, Whole air sample collection into glass flask
NMHC, CO2and CH4stable isotopes samples with subsequent analysis at NOAA-GMD, USA
∗Not available in 2011.
Fig. 6. Flight tracks for BORTAS, excluding inbound/outbound transit flights. Solid upward triangles denote ozonesonde launch sites, and the solid square denotes the Dalhousie ground station. The colour circles denote active burning throughout the BORTAS period. The flights and burning areas use a common colour scale that denotes the day number starting on 12 July 2011.
aircraft to larger spatial scales and longer temporal scales. During the campaign near-real-time satellite data were used to inform deployment of the BAe-146 aircraft. We used data from the Michelson Interferometer for Passive Atmospheric Sounding (MIPAS), the Atmospheric Chemistry Experiment (ACE), the Infrared Atmospheric Sounding Interferometer (IASI), and the Tropospheric Emission Spectrometer (TES). We used near-real-time measurements from MIPAS (Fis-cher et al., 2008) aboard the Envisat satellite and IASI (Cler-baux et al., 2009) aboard the MetOp satellite to help us inter-cept pyrogenic plumes with the aircraft during BORTAS-B. MIPAS measures atmospheric limb emission spectra 14.5– 4.1 µm at a spectral resolution of 0.0625 cm−1since January 2005 over a tangent altitude range 6–68 km, and is in a polar
sun-synchronous orbit with a local solar time of 10:00 and a 35-day repeat cycle. MIPAS observations were specially planned to coincide with BORTAS-B flights. IASI uses an infrared Fourier transform (FTIR) spectrometer to measure spectra 15.5–3.62 µm at a spectral resolution of 0.5 cm−1, and is in a polar sun-synchronous orbit with a local solar time of 09:30 and a 29-day repeat cycle.
We also used data from ACE (Bernath et al., 2005; Tereszchuk et al., 2011, 2013), which is a high-resolution FTIR spectrometer that measures spectra 750 to 4400 cm−1 with a resolution of 0.02 cm−1. ACE aboard SCISAT-1, which is in a 74◦inclination circular orbit, can measure up to 30 sunrise and sunset occultations per day with a ver-tical resolution of 2–3 km from 150–5 km in cloud-free scenes. A number of trace gases are retrieved from the ACE spectra that are elevated in wildfires, e.g. CO, acetonitrile, formic acid, formaldehyde, acetylene, ethane, and methanol (Tereszchuk et al., 2011, 2012).
In collaboration with colleagues at the NASA Jet Propul-sion Laboratory, we requested special “step-and-stare” ob-servations from TES (Beer et al., 2001) aboard the Aura spacecraft with a repeat cycle of 16 days. TES is a high-resolution imaging FTIR spectrometer that observes spec-tral radiance in the range 650–3050 cm−1 at a resolution of
0.1 cm−1. It has an instrument field-of-view at the surface of 8 km × 5 km. Data from this instrument has been used pre-viously to study boreal wildfires over Sibera (Verma et al., 2009) and Canada (Alvarado et al., 2010). The BORTAS-B step-and-stare TES observations effectively increased the spatial density of measurements over eastern Canada during BORTAS-B and subsequently increased the number of coin-cident profile measurements.
3.5 Model and data forecast products
The main forecasting products for BORTAS-B included (1) NASA GEOS-5 (Global Earth Observing System) forecasts of carbon monoxide emitted by boreal biomass burning (lati-tudes > 50◦), in collaboration with the Global Modeling and Assimilation Office at NASA Goddard; and (2) Environment Canada meteorological forecasts together with operational output from the air quality model GEM-MACH (Global En-vironmental Multi-scale-Modelling Air quality and CHem-istry). We also used forecasts from the UK Meteorological Office and the European Centre for Medium-range Weather Forecasts, and used the HYbrid Single-Particle Lagrangian Integrated Trajectory (HYSPLIT) model (Draxler, 1999) to locate the origin of plumes observed by the aircraft.
As part of the deployment planning, we used near-real-time fire data from: (1) Natural Resources Canada http://cwfis.cfs.nrcan.gc.ca/en CA/fwmaps/fdr; (2) emission data from the Fire Locating And Monitoring of Burn-ing Emissions (FLAMBE), which incorporates fire data from geostationary and polar-orbiting satellites (Reid et al., 2009); and (3) fire products from the NASA Moderate-Resolution Imaging Spectroradiometer (MODIS) instru-ments from the Fire Information for Resource Management System (FIRMS) via the NASA Earth Observing System Data and Information Service. This information is indepen-dent of the Quick Fire Emission Dataset (QFED) developed by NASA and used by the GEOS-5 CO forecasts (Rienecker et al., 2008; Ott et al., 2011). CO total column and profile data from IASI (described above), available < 3 h after mea-surements, was also used for plume tracking and flight plan-ning during BORTAS.
4 First results and science overview
The BORTAS-B airborne campaign delivered a rich dataset to better understand chemistry in biomass burning plumes, partly serendipitously because of the timing and location of fires over Northwestern Ontario during our Halifax-based de-ployment (Fig. 6). Here, we briefly describe analysed results and refer the reader to dedicated papers. We discuss ongoing work and future perspectives in Sect. 5.
4.1 Intercepting pyrogenic plumes
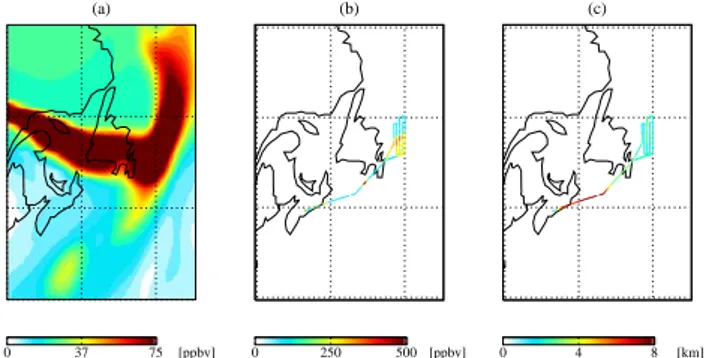
Intercepting pyrogenic plumes is non-trivial, but we found that GEOS-5 CO fields reliably forecasted the general spa-tial distribution of the plumes, allowing us to accordingly deploy the BAe-146. Figure 7 shows the GEOS-5 CO fore-cast for B624 on 21 July 2011, which showed pyrogenic plumes in the mid-lower troposphere over Newfoundland Is-land and the Gulf of St. Lawrence. The flight pattern was designed to maximize time within the plume and explore the vertical dimension. These aircraft observations serve to il-lustrate the rapid horizontal and vertical gradients associated
(a) 0 37 75 [ppbv] (b) 0 250 500 [ppbv] (c) 0 4 8 [km]
Fig. 7. (a) GEOS-5 model CO concentration (ppb) forecast for 1930Z at 750 hPa (initialized at 00Z on the same day), (b) BAe-146 aircraft CO measurements (ppb) and (c) altitude (km) for flight B624, 21 July 2011.
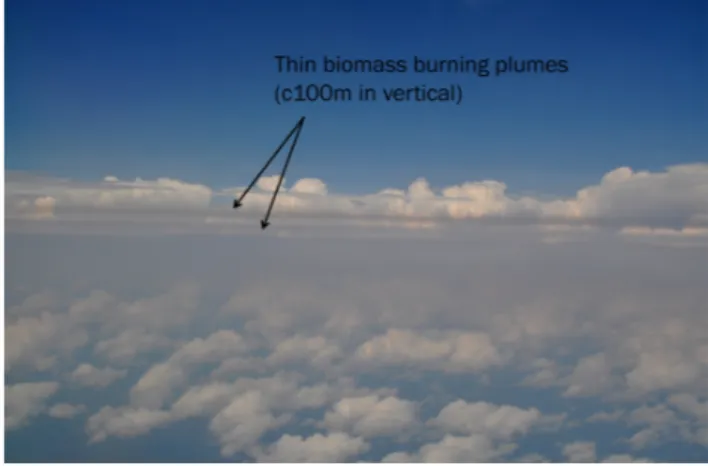
with the plume. Figure 8 shows that these plumes indeed travel as thin, coherent filaments with a vertical dimension of the order of 100 m, in agreement with previous studies, re-flecting possibly vertical wind shear where the material was first lofted into the atmosphere or buoyancy-driven spread-ing after an air mass reaches its level of neutral buoyancy (Hogg et al., 2013). During flights, guided by forecast prod-ucts (described above), we identified plumes primarily by el-evated CO concentrations but also changes in uncalibrated mass to charge (m/z) counts associated with CH3CN from
the PTR-MS. Once we intercepted a plume, based on the chemical criteria, we typically focused on constant altitude runs within the plume, with limited vertical and horizontal sampling to explore the plume dimension and the associated chemical gradients. As part of BORTAS we parameterized time-dependent forecast skill of the GEOS-5 CO fields using optical flow methods (Keil and Craig, 2009), which is the subject of an upcoming paper (Matthiesen et al., 2013). As-sociated with these filamental structures were rapid gradients in O3 across the plume boundaries, in agreement with
pre-vious studies of near-field power plant plumes that showed a non-linear response to levels of NOx(Ryerson et al., 2001).
For BORTAS scientific studies we have chosen to use CO, together with biomass burning tracers acetonitrile (CH3CN)
and hydrogen cyanide (HCN), to identify biomass-burning plumes. By virtue of the primary scientific objective of BOR-TAS, the resulting airborne data are biased to biomass burn-ing plumes so that we cannot use the mean statistics of these data to identify plumes, an approach adopted by other cam-paigns. Instead, we have used measurements from a sin-gle flight (B625, 24 July 2011, Fig. 6) during which we sampled almost exclusively concentrations representative of the background atmosphere; mean and median values were lower than those derived from all the data, and there was no significant statistical relationship between CO and CH3CN.
Even in the background atmosphere, we expect a distribu-tion of trace gas concentradistribu-tions. Here, we define a plume that has a value greater than the 99th percentile (' mean ±3
Fig. 8. A photograph (c/o Steve Andrews) from the BAe-146 at ca. 7 km altitude during BORTAS-B (flight B624, 21 July 2011) illus-trating the thin filaments of pyrogenic outflow.
standard deviations) of the B625 data. For CO, CH3CN,
and HCN these 99th percentile threshold values are 148 ppb (n = 237), 150 ppt (n = 236), and 122 ppt (n = 118), respec-tively. These stringent constraints necessarily remove a sub-stantial amount of data that varies with the tracer: 85 % for CO and 60 % for HCN and CH3CN. This admittedly crude
statistical analysis helps to justify our method of plume iden-tification and provides a definition for all subsequent BOR-TAS scientific studies. Most scientific studies have used the HCN and CH3CN criteria to retain data.
Figure 9 shows significant contributions of total CO from biomass burning regions during the BORTAS-B period, as depicted by the tagged version of the GEOS-Chem global 3-D model (Parrington et al., 2012). The model is driven by uncorrected FLAMBE biomass burning emission estimates, which are known to have a positive bias. At the surface over eastern Canada, where BORTAS-B took place, the largest contribution to CO is from Siberia (as it is indeed for the rest of the Northern Hemisphere), with substantial contributions from Eastern and Western Canada and the Southwestern and Eastern United States. In the free troposphere, where the air-craft spent most of its time, the background is dominated by Siberian burning with near-field variations also from East-ern and WestEast-ern Canada. Particularly strong Siberian burning episodes were observed on 28 July using IASI CO data, al-though enhanced CO amounts were detected over this region throughout the BORTAS-B period. A more detailed treat-ment of the emission and transport of biomass burning emis-sion will the subject of ongoing work.
4.2 Emission ratios for organic compounds
Direct emissions from open biomass burning (i.e. incomplete combustion) are largely composed of CO2and H2O but also
include CO and a suite of organic compounds. The relative abundance of these organic species depends on the phase of
Fig. 9. Monthly mean GEOS-Chem global 3-D chemistry model output for July 2011 that describes pyrogenic contributions to total CO (ppb) from Western Canada, Eastern Canada, Siberia, south-western contiguous US and eastern contiguous US. The upper (lower) panel shows CO concentration at the surface (6 km).
the fire (flaming or smouldering). The co-emission of these organic compounds along with CO has been reported exten-sively, and the correlation of these with CO and with dry mass of biomass burnt has been used to derive emission ra-tios (ERs) and emission factors (EFs) (see for example (An-dreae and Merlet, 2001)). During BORTAS-B we determined a wide range of emission ratios for organic compounds (ex-pressed as ppt[NMHC] per ppb[CO]) using data from whole air samples analysed on the ground using GC-FID and in-flight for selected species using PTR-MS. Derived ER values during BORTAS-B (Lewis et al., 2013) agreed very well for many species with earlier experiments over a similar geo-graphic region (Simpson et al., 2011), providing confidence in subsequent analysis involving the scaling-up of these mea-surements using CO fire emission estimates and a global 3-D chemistry transport model. In particular, the BORTAS-B ERs
have been used to determine the extent to which biomass burning contributes to the global distribution of species such as benzene, ethene, propene and toluene, which are tradition-ally thought of as mainly anthropogenic tracers whose regu-lation has seen a continued decline in developed countries. Analysis using the GEOS-Chem chemistry transport model shows that in many remote locations biomass burning can be the dominant hydrocarbon source (Lewis et al., 2013).
There is widespread evidence of pyrogenic emission of many simple non-methane hydrocarbons (NMHCs) and small oxygenated compounds such as methanol and ace-tone, but emission of larger polar and semi-volatile species are less well characterized. These species have lower vapour pressures than simple non-methane hydrocarbons, so that if they are transported under cool free-troposphere conditions they can partition into the aerosol phase. Laboratory studies (e.g. Christian et al., 2004) and near-field measurements (e.g. Yokelson et al., 2008) of forest burning biomass show that a range of higher carbonyl compounds are released, and there is some evidence of enhanced emissions of monoterpenes and longer chain aliphatic compounds. However, detection of these compounds in the field, and in particular in plumes un-dergoing long-range transport, is analytically difficult. They are often not amenable to sampling and storage in whole air sampling canisters because of wall and O3 losses, and the
complexity of isomers makes PTR-MS an unsuitable tech-nique for individual speciation. BORTAS-B provided the first flight opportunities for a fast response in-flight GC-MS de-signed specifically for C5–C12VOCs including oxygenated
compounds and monoterpenes. Intercepted boreal biomass burning plumes in the mid-troposphere showed that species such as furfural, benzaldehyde, benzonitrile, acetophenone and benzoic acid were present in significant abundances, and that downwind fire plumes also showed elevated higher hy-drocarbons such as naphthalene and monoterpenes, includ-ing alpha pinene, camphene, beta-pinene, 3-carene limonene and eucalyptol. ERs for these species from aged plumes have been determined, and their phase partitioning estimated for a range of plume temperatures. The addition of an in-flight GC-MS to BORTAS-B also provided additional discrimi-nation to PTR-MS data, in particular providing a quantita-tive measurement of the relaquantita-tive abundance of furan and iso-prene species that give a combined response by PTR-MS, and which vary greatly as forest-influenced air masses from burnt and unburnt regions are encountered. These data are reported in greater detail by Purvis et al. (2013).
4.3 Ozone photochemistry in pyrogenic plumes
Ozone photochemistry in boreal biomass burning plumes was evaluated using measurements of NMHCs and NOy
species made from the BAe-146 with different instruments. The observed O3 distribution in pyrogenic outflow,
iden-tified using tracers such as CO and CH3CN, during the
campaign showed no distinguishable difference to the
ob-served distribution in clean air. At the highest values of CO (> 300 ppb), O3 mixing ratios were observed in a
rela-tively narrow range between approximately 40 and 60 ppb. Parrington et al. (2013) show that the enhancement ratio
1O3/1CO, crudely characterizing O3 production, is
gen-erally positive and increases with photochemical age (de-scribed below) from 0.020 ± 0.009 ppbv ppbv−1at ages less that 2 days to 0.75 ± 0.41 ppbv ppbv−1for ages greater than 5 days. The increase in ratio is due largely to an increase in
1O3rather than the smaller decrease in 1CO with age.
Photochemical processes influencing the O3 distribution
in boreal biomass burning plumes were evaluated through (1) photochemical age calculations, using ratios of differ-ent alkanes assuming a common sink of oxidation by OH (Parrish et al., 2007); and (2) comparison of the observed O3 distribution relative to total alkyl nitrates and the
sur-rogate species NOz (= NOy minus NOx, the sum of NOx
oxidation products) (Olszyna et al., 1994; Rickard et al., 2002), representing the conversion of NOxinto O3
(Parring-ton et al., 2013). Photochemical ages, calculated relative to initial mixing ratios derived from research flight B626 over Northwestern Ontario, produced values of between 2–3 days aging for the strongest plumes (CO > 300 ppb) encountered in the lower troposphere earlier in the campaign (i.e. flights B622–B624) and > 5 days for plume air that was encoun-tered at higher altitudes later in the campaign (i.e. flights B628—B630); Table 6 reports the range of photochemical ages of pyrogenic plumes for each flight. Graphical com-parison of the O3 distribution to that of the alkyl nitrates
and NOzrevealed clear “L-shape” patterns (not shown) with
higher values of alkyl nitrates/NOz at lower values of O3,
and lower values of alkyl nitrates/NOzat higher O3. The two
branches of these “L-shape” patterns revealed a clear distinc-tion between measurements with different characteristics: (1) high measurements of alkyl nitrates/NOzand lower O3were
typically made at lower altitudes (below 5 km), with higher values of black carbon mass concentration (> 0.1 µg cm−3) and at higher relative humidity (greater than 80 %); and (2) low alkyl nitrates/NOzand high O3measurements were
typ-ically made at higher altitudes, with lower black carbon mass concentration (<0.1 µg cm−3), and low relative humidity (< 80 %). Further comparison of the O3production efficiency,
calculated from the ratio of O3:NOz, to measured NOx
mix-ing ratios indicated that BORTAS measurements were made under different chemical regimes. Lower values of O3
pro-duction efficiency (less that 150 ppb O3ppb−1NOz) show
a larger range of NOxmixing ratios (0.05–1.0 ppb),
indica-tive of a VOC-limited regime, and higher values (greater than 150 ppb O3ppb−1NOz) show a narrower range of NOx
mix-ing ratios (0.0–0.2 ppb), indicative of a NOx-limited regime.
Fig. 10. Brightness temperature difference (BTD, K) detection of (a) CO and (b) formic acid (HCOOH) enhancements from a single IASI data granule for 19 July 2011. MODIS fire count data are shown as triangles according to detection certainty: high (red), nominal (yellow), and low (blue) confidence. (c) The corresponding scatter plot of CO and HCOOH with the Pearson correlation coefficient r shown inset.
Fig. 11. Left: IASI total column CO (molec cm−2) for 2 August 2011. The black diamond superimposed denotes the position of occultation ss42910 from the ACE space-borne sensor. Right: vertical profiles of HCN (ppb) and PAN (ppb) from ACE during occultation ss42910 (45.13◦N, −81.99◦W).
Table 6. Range of photochemical ages of air masses, identified as being of pyrogenic origin using CO, CH3CN and HCN
concentra-tions, intercepted during non-transit BORTAS-B flights, 15 July–31 July 2011.
Flight # Photochemical age (days)
B620 –
B621 Typically 3–4, few older
B622 Typically 1–5, few younger and older B623 Typically 2–4, few older
B624 Typically 2–4, few younger and older
B625 –
B626 ≥5 earlier in flight, 1–2 later in flight
B627 –
B628 Typically 8–11 B629 Typically 5–8 B630 Typically 5–9
4.4 Using data to test chemical mechanisms
Describing the observed photochemistry using a hierarchy of chemical mechanisms, a core objective of BORTAS, allows us to investigate the uncertainties in our understanding of O3production and loss within the biomass burning outflow
and to quantify the resulting perturbation to tropospheric chemistry over the western boundary of the North Atlantic. Here, we used v3.2 of the Master Chemical Mechanism (MCM; http://mcm.leeds.ac.uk/MCM), a near-explicit chem-ical mechanism describing the detailed gas-phase degrada-tion of a series of primary emitted VOCs (Saunders et al., 2003), which contains 143 primary emitted VOCs and 6700 species involved in 17 000 reactions. We also used a reduced chemical mechanism, the “common representative interme-diates” (CRIv2 mechanism) (Jenkin et al., 2008), which is benchmarked against the more comprehensive MCM. The CRI mechanism provides an economical alternative to the MCM that can be applied to global 3-D CTMs such as GEOS-Chem whilst retaining much of the fidelity of the more detailed mechanism. The CRI mechanism contains a series of generic intermediate radicals and products (based
on the O3creation potential for a given VOC), each of which
is able to represent a larger set of species in the MCM. These generic intermediates mediate the breakdown of larger VOCs into smaller fragments, the chemistry of which is treated explicitly. The latest version of the CRI mechanism (v2) contains 442 species and 1191 reactions (7 % of the full MCM). These mechanisms will be compared against the GEOS-Chem mechanism that is much less detailed than the CRI mechanism. We have used photochemical models, incorporating MCMv3.2 and CRIv2 mechanisms, and con-strained them with BORTAS aircraft observations to (1) in-vestigate the chemistry controlling O3formation and loss and
NOy speciation along each BORTAS flight track, (2)
eval-uate the CRI mechanism, and subsequent reduced versions (following Watson et al., 2008), and the GEOS-Chem mech-anism against the benchmark MCM, and (3) evaluate the ini-tialization and speciation methodologies applied during the bottom-up model studies (Hays et al., 2002; Simpson et al., 2011). We find that the CRI mechanism typically reproduces oxidant concentrations from the benchmark MCM calcula-tions over 5–10 days, with most of the photochemical O3
formed within the first 12–15 h of daylight after emission, and captures most of the variation in the aircraft observa-tions. This work is described by Young et al. (2013).
4.5 Observing pyrogenic plumes from space
We used MIPAS products (described in Sect. 3.4) developed by the University of Leicester, including CO, PAN, acety-lene, formic acid, ethane, and acetone (Moore and Reme-dios, 2010; Parker et al., 2010; Moore et al., 2012; Illing-worth et al., 2011), which have been shown previously to be markers of wildfires (Alvarado et al., 2010). The IASI near-real-time CO data product was provided by C. Cler-baux (CNRS/INSU, LATMOS-IPSL, Paris, France) and P.-F. Coheur (Universit´e Libre de Bruxelles, Brussels, Belgium) (Clerbaux et al., 2009; George et al., 2009). We also used IASI products developed by the University of Leicester, in-cluding CO, formic acid, and acetylene, with detection prod-ucts for these compounds and also ethene, ammonia, and HCN. Figure 10 shows an example of how these detection products were used in BORTAS-B to understand the spa-tial extent of biomass burning plumes. The data show a dis-tinct CO plume over eastern Canada on 19 July 2011, derived from the difference in brightness temperature between 5 µm and 10 µm, which also corresponds to elevated concentra-tions of formic acid. Figure 11 shows IASI total column CO for 2 August 2011, with a black symbol superimposed denot-ing the location of an ACE occultation profile from which we show a profile of HCN and PAN down to 7 km. Both PAN and HCN show elevated concentrations suggesting this en-hancement is due to the biomass burning outflow shown by IASI.
Figure 12 shows a comparison between an O3profile
mea-sured from the BAe-146 during its descent into Thunder Bay
Airport, Ontario, on 26 July 2011 and a colocated O3
pro-file retrieved by TES on the same date separated by approx-imately 30 km and 4 h. Figure 12a shows the raw 1 s aircraft O3measurement, the TES retrieval and its prior, and the
air-craft profile smoothed by the TES averaging kernels. The prior for the TES O3retrieval has been scaled to the aircraft
profile, and the retrieved O3profile has been adjusted to this
scaled prior, following Kulawik et al. (2008) and Rodgers and Connor (2003). The aircraft profile was smoothed with the TES averaging kernels by (i) removing repeat measure-ments at the same vertical level, (ii) appending the scaled prior to extend it into the stratosphere, and (iii) interpolat-ing it to the TES vertical pressure grid. Figure 12b shows the averaging kernels for the retrieved O3 profile. The O3
profile measured from the BAe-146 showed relatively low (20–40 ppb) mixing ratios between the surface and 750 hPa, with a relatively thick layer of enhanced O3extending from
700 to 400 hPa with mixing ratios of 50–80 ppb. The prior profile used in the TES retrieval was scaled to match the O3 mixing ratio measured from the aircraft at the highest
pressure level (approximately 350 hPa). Between the surface and this pressure level, the scaled prior is representative of background tropospheric O3 mixing ratios (red dotted line
in Fig. 12a). The TES O3profile (red solid line in Fig. 12a)
showed a similar vertical distribution to the aircraft profile with mixing ratios of 20–40 ppb below 750 hPa, similar to the prior, increasing to approximately 60 ppb at 400 hPa. The averaging kernels in Fig. 12b indicate that this retrieval was not sensitive to O3at the lowest pressure levels of the
pro-file but was sensitive to the pressure levels with the observed O3enhancement. At higher pressure levels (lower altitudes),
the TES profile showed good agreement with the raw air-craft measurements. Comparison against the airair-craft profile smoothed with the TES averaging kernels, however, indi-cated that the TES retrieval overestimated the O3 profile in
the middle troposphere by up to 20 ppb. This simple-minded comparison serves to illustrate the challenges associated with extracting information from space-borne instruments about atmospheric processes that have vertical structures that are generally finer than the vertical resolution of the instruments without using more sophisticated analyses that account for instrument error characteristics.
4.6 Source attribution of surface PM2.5
Source attribution of observed variations in PM2.5 (Table 4)
at the DGS was achieved using a combination of statistical data analysis of the measurements and atmospheric transport modelling. During the BORTAS-B period, 45 consecutive days of filter samples were collected at the DGS, the analysis from which was combined with continuous measurements of black carbon (BC) and organic carbon (OC) (Table 4).
Gibson et al. (2013a) use the US EPA Positive Matrix Fac-torization v3.0 (PMF) receptor model (Paatero and Trapper, 1994) to determine the source contribution of boreal forest