http://dx.doi.org/10.22161/ijeab/2.4.48 ISSN: 2456-1878
Removal from wastewater and recycling of azo
textile dyes by alginate-chitosan beads
Paola Semeraro
1, Paola Fini
2, Marinella D’Addabbo
1, Vito Rizzi
1, Pinalysa Cosma
1, 2, *1Department of Chemistry, University of Bari “Aldo Moro”, Via Orabona, 4 - 70126 Bari, Italy
2Department of Chemistry, National Research Council CNR-IPCF, UOS Bari, Via Orabona, 4 - 70126 Bari, Italy
Abstract—Alginate-chitosan beads were used as adsorbent to remove two azo anionic textile dyes, Direct Blue 78 and Direct Yellow 106, from aqueous solutions. Batch mode experiments of dyes adsorption were performed and the effects of various parameters such as contact time, adsorbent dosage, initial dye concentration, pH and temperature were examined.
Successively, the dyes have been desorbed from the adsorbent and were recycled to dye a cotton fabric. The maximum efficiencies in dye removal, performed at pH 6, 298 K and with 0.5 g of adsorbent, were found to be about 97% for Direct Blue 78 and about 86% for Direct Yellow 106, respectively. The adsorption isotherms fitted the Freundlich’s model, the adsorption kinetics followed the pseudo-second order model and experimental data indicated an exothermic adsorption process. Moreover, the dyes desorption experiments from the alginate-chitosan beads demonstrated that about 50% of dyes were released in distilled water at high temperature (368 K) and the colored solutions obtained were so reused in dyeing tests.
The results demonstrated that the alginate-chitosan beads are very efficient systems able not only to remove dyes from wastewater, but also to recycle and reuse them in further dyeing processes.
Keywords—Adsorption, Alginate-chitosan beads, Desorption, Textile dye removal, Thermal analysis.
I. INTRODUCTION
Several industrial sectors, such as paper, leather tanning, plastic, cosmetic, rubber, and textile productions, discharge great amounts of dyes into wastewater. These complex organic molecules cause an important source of pollution in hydrosphere, dyeing visibly the effluent waters [1].
Color is usually the first contaminant to be recognized in wastewater being highly visible to human eye even in presence of very small amount of synthetic dyes (less than 1 ppm) [2]. Colored water not only causes an objectionable aesthetic aspect, but also reduces sunlight penetration retarding the photosynthetic activity of aquatic species and inhibiting their growth. In addition, dyes are toxic, carcinogenic, mutagenic, or teratogenic
both to aquatic species and to human beings due to the presence of metals, aromatic and azo groups in their molecular structures [3, 4].
Although dyes exhibit a considerable number of chemical structures, it is well-known that the azo dyes are one of the most widely used and represent approximately 65– 70% of the total dye production [5, 6]. Azo dyes are toxic and potentially carcinogenic for the reduction of the azo groups with the consequent formation of aromatic amines in the wastewater [7]. Therefore, the dye removal from industrial effluents is a fundamental issue and appropriate wastewater treatments should be done to decrease the environmental impact, even though it is very difficult to realize because of the recalcitrant nature of azo dyes. Indeed, these molecules are resistant to aerobic digestion and are highly stable to light, heat and oxidizing agents [8]. In the last years, several physical, chemical and biological methods, such as adsorption, membrane-filtration, coagulation, flocculation, flotation, precipitation, oxidation, aerobic and anaerobic microbial degradation processes, have been developed for the removal of dyes from industrial effluents [9]. Some of these approaches are expensive, with a very low efficiency or are impracticable because of toxic by-products formation [10]. On the contrary, it has been proved that adsorption is one of the most effective and cheap methods which industries employ to reduce hazardous pollutants present in the effluent [11, 12]. Consequently, a lot of non-conventional and low-cost adsorbents, e.g. natural materials, biosorbents and by-products of industry and agriculture have been proposed by researchers [13-15]. Recently, it has been also demonstrated that the adsorption of dyes by means of natural and biodegradable polymers is one of the emerging methods for dye removal. Indeed, numerous studies based on the use of biopolymers, such as alginate [16, 17] and chitosan [18-20], have established that these biosorbents have a very high affinity for many classes of dyes. Sodium alginate (AL), the sodium salt of alginic acid, is a linear biopolymer extracted from brown algae containing β(1→4)-D-mannuronic acid (M) and α(1→4)-L-guluronic acid (G) residues. It has the properties to form stable three-dimensional hydrogel in presence of
http://dx.doi.org/10.22161/ijeab/2.4.48 ISSN: 2456-1878
bivalent cations in aqueous media, such as Ca2+ ions. The
bivalent ions induce cross-linking of adjacent biopolymer chains, mainly at guluronic sequence (G-G) of polymer, following the so-called ‘egg box model’ [21, 22]. Several studies have showed that this polymer has been used for the removal of basic and disperse dyes [13, 16, 17]. The binding of these cationic dyes to anionic polymers can take place either by electrostatic or by other aggregation interactions, such as hydrogen bond and/or hydrophobic interactions [23]. Chitosan (CH) is a polysaccharide commercially produced by alkaline N-deacetylation of chitin, a N-acetyl-β-D-glucosamine polymer, the principal constituent of exoskeleton of crustaceans, insects, and arachnids. The chitosan polycationic structure allows to form a strong interaction with alginate negative charges based on electrostatic interaction between alginate carboxylic groups and chitosan amine groups [24]. Therefore, in this study, alginate-chitosan-based adsorbents were used to reduce the dye amounts present in industrial effluents. Despite the large number of papers dedicated to the removal of dyes by means of these materials, in the present work, not only the adsorption performance and its mechanism were evaluated, but also the dye recycling was demonstrated. Indeed, after dyes adsorption on the adsorbent material, the same dyes have been desorbed and reused for fabric dyeing tests.
In detail, beads with a solid core of alginate gel (AL beads) and alginate beads successively coated with a chitosan membrane (AL-CH beads) were prepared and used as adsorbent for the removal of two anionic azo dyes from aqueous solutions, Direct Blue 78 (DB78) and Direct Yellow 106 (DY106).
The chitosan coating not only reinforces the AL-beads, reducing their disintegration, but also endows beads with a positive surface charge, enhancing their ability to adsorb anionic dyes [25]. Indeed, several studies have demonstrated that the strong interactions between the amino groups present on chitosan chains and anionic dyes can be used to explain the adsorption mechanism [26, 27]. The DB78 and DY106 adsorption on AL-CH beads was performed and the effect of different variables, such as contact time, adsorbent dosage, initial dye concentration, initial solution pH and temperature were considered and discussed. The Langmuir and Freundlich equations were used to fit the equilibrium isotherms and the adsorption kinetics were determined by the pseudo first-order and second-order models.
FTIR-ATR measurements and thermal analysis, such as differential scanning calorimetry (DSC) and thermogravimetric analysis (TGA), were also utilized to understand the dye/AL-CH beads interactions.
II. MATERIALSANDMETHODS
2.1 Materials. Alginic acid sodium salt (AL) from brown
algae (medium viscosity), calcium chloride (CaCl2),
Chitosan (CH) from crab shells (high viscosity, deacetylation degree ≥ 75%), acetic acid (99.9%) and sodium sulfate anhydrous (99.0%) were purchased from Sigma-Aldrich.
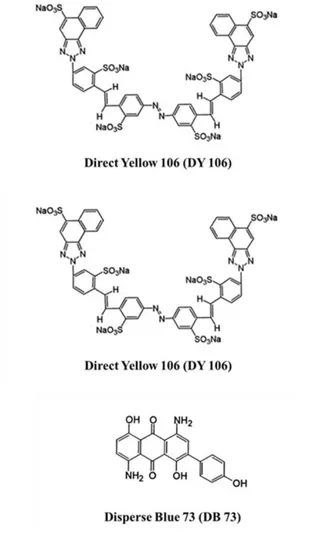
Different commercially available textile dyes, Direct Blue 78 (DB78), Direct Yellow 106 (DY106) and Disperse Blue 73 (DB73) were obtained by Colorprint Fashion S.L., a Spanish textile industry. Their chemical structures and characteristics are reported in Fig. 1 and Table 1, respectively.
Fig. 1: Chemical structures of dyes. Table 1: Chemical characteristics of dyes.
Molecular Formula Molecul ar Weight Molecular structure λmax (n m) DB7 8 C42H25N7Na4O 13S4 1055.91 Tri-azo 601 DY1 06 C48H26N8Na6O 18S6 1333.10 Mono-azo 418 DB7 3 C20H14N2O5 362.34 Anthraquin one 530
http://dx.doi.org/10.22161/ijeab/2.4.48 ISSN: 2456-1878
DB78 and DY106 are direct dyes, a class of dyestuffs applied directly to the substrate in a neutral or alkaline bath and are defined as anionic dyes. DB78 and DY106 are tri-azo and mono-azo compounds and their chemical structures present four and six sulfonate groups respectively.
DB73, classified as a disperse dye, is a non-ionic molecule with an anthraquinone molecular structure which present a scarce solubility in water.
To prepare dyes stock solutions, calculate amount of dye were dissolved in double distilled water and successive dilutions were carried out to obtain solutions at desired concentrations. The pH of aqueous solutions was adjusted to the required value by adding either HCl or NaOH. AL (1% W/V) and CaCl2 (2.5% W/V) solutions were
prepared dissolving the required quantity of samples in double distilled water. Chitosan powder was added into an aqueous acetic acid solution (0.8% V/V) to obtain CH solution (0.1% W/V). All chemicals and solvents were used as received without further purification.
2.2 Instruments. UV-Vis absorption spectra were
recorded using a Varian CARY 5000 UV-Vis-NIR spectrophotometer (Varian Inc. now Agilent Technologies Inc.).
A FEI Quanta FEG 250 scanning electron microscopy (SEM) was used to investigate the surface morphology of AL-CH beads placing the samples on an aluminum stub. FTIR-ATR spectra were recorded by means of the Fourier Transform Infrared spectrometer 670-IR (Varian Inc. now Agilent Technologies Inc.) using the attenuated total reflection (ATR) method. Samples were scanned from 600 to 2000 cm−1 at a resolution of 4 cm−1 and 32 scans were summed for each acquisition.
The thermal analysis of AL and AL-CH beads along with DB78 and DY106 loaded AL-CH beads were performed with differential scanning calorimetry (DSC) and thermogravimetric analysis (TGA). The experiments were carried out using Q200 TA Instruments and Pyris 1 TGA Perkin Elmer, respectively, under N2 atmosphere with
heating rate of 20°C/min.
2.3 Preparation of alginate and alginate-chitosan beads. Alginate beads were prepared using the method of
external gelification. AL solution was extruded dropwise through a needle, with a diameter of 0.8 mm, into calcium chloride solution and the system was maintained under continuous magnetic stirring. The needle was placed at the output tube of a peristaltic pump and a constant flow rate (2 mL/min) was used. This procedure allows to obtain AL beads with approximately the same diameter, since the mean dimension of beads depend on several variable, such as the diameter of the needle used, the distance between the needle and the surface of calcium solution, the flow rate of dropping and the alginate and
salt concentrations. AL beads were left in calcium solution for 30 minutes to complete the cross-linker process and to harden them. Then they were collected, repeatedly washed with double distilled water and dried in an oven at 60°C for about 5 hours.
To prepare AL-CH alginate beads, the wet alginate beads were further immersed into chitosan solution for 60 minutes and maintained under continuous stirring. Next, the produced AL-CH beads were collected, washed, and dried in an oven at 60°C.
2.4 Batch adsorption experiments. Dye adsorption
processes were performed by batch mode experiments adding specific amounts of adsorbent to a fixed volume of dye solutions in controlling condition of agitation rate (150 rpm), pH and temperature. Every 10 minutes, the residual concentration of dye present in the aqueous solutions was determined by means of UV-Vis spectrophotometry at the maximum absorption wavelength (λmax). Influence of different variables,
including contact time, adsorbent dosage, initial dye concentration, pH and temperature were analyzed. These experiments were performed by varying the parameter under evaluation while all other parameters were maintained constant.
The values of dye removal (%) and amount of dye adsorbed onto beads, qt (mg/g), at time t were
respectively calculated using the following equations:
% = (Ci− Ct)
Ci · 100 Equation (1)
qt =
(Ci− Ct)·V
m Equation (2)
where Ci and Ct (mg/L) are the liquid phase concentration
of dye at initial and t adsorption time; V (L) is the initial volume of dye solution and m (g) is the mass of adsorbent.
All tests were performed in triplicate to insure the reproducibility of the results and the mean values were reported.
2.5 Adsorption equilibrium isotherms. The adsorption
isotherms allow to understand how the adsorbate interact with the adsorbent putting in relation the concentration of dye in the bulk and that adsorbed on the adsorbent surface when the adsorption process reaches an equilibrium state [28]. So, accurate mathematical models of adsorption isotherms are indispensable to evaluate the adsorption behavior and to describe the equilibrium adsorption of substances from solutions. Although several isotherm models have been developed, in this study, the more common Langmuir and Freundlich models were used. Evaluation of the adsorption isotherms of dyes onto AL-CH beads were performed by adding various quantities of adsorbent to dye solutions. The systems were maintained
http://dx.doi.org/10.22161/ijeab/2.4.48 ISSN: 2456-1878
at constant temperature of 298 K under continuous stirring until the equilibrium time. Measurements of dye concentration were conducted before and after the adsorption processes and the obtained experimental data were fitted with Langmuir and Freundlich models. The values of the linear regression correlation coefficient R2 give information about the best-fit model. In Table 2
are summarized the Langmuir and Freundlich values.
2.5.1 Langmuir adsorption isotherm. The Langmuir
adsorption isotherm model assumes that adsorption takes place on homogeneous sites of adsorbent surface forming a saturated monolayer phase of adsorbate on the outer surface of adsorbent without interaction between adsorbed molecules [29, 30]. The Langmuir model is expressed by equation (3):
qe =
qm·KL·Ce
(1+KL·Ce) Equation (3)
where qe is the amount of adsorbed dye per unit mass of
adsorbent at equilibrium (mg/g); Ce is the dye
concentration in solution at equilibrium (mg/L); qm is the
maximum amount of the dye per unit mass of adsorbent (mg/g) to form a complete monolayer on surface and KL
is the Langmuir isotherm constant (L/mg) related to the affinity of the binding sites.
High value of KL suggests much stronger affinity of dye
adsorption. The equation (3) can be written in the following linearised form:
1 qe = 1 qm+ 1 KL·qm· 1 Ce Equation (4)
The intercept and slope of the plot between 1/qe versus
1/Ce give the values qm and KL, respectively (Fig. 7).
2.5.2 Freundlich adsorption isotherm. The Freundlich
adsorption isotherm is an empirical equation which describes heterogeneous systems that have unequal available sites on adsorbent surface with different adsorption energies. The Freundlich model can be represented by the equation (5) [31]:
qe= KF· Ce
1
n Equation (5)
The linearised form of Freundlich equation is:
lnqe = lnKF+ 1
n· lnCe Equation (6)
where qe is the amount of dye adsorbed at equilibrium
(mg/g); Ce is the concentration of dye in solution at
equilibrium (mg/L); KF is the Freundlich constant related
to the maximum adsorption capacity of adsorbent (L/g) and n is the intensity of adsorption factor related to surface heterogeneity (dimensionless). The magnitude of n gives an indication of the adsorption favorability: values of n > 1 represent favorable adsorption condition [28]. A linear regression plot of ln qe versus ln Ce (Fig. 7) allows
to calculate the values of KF and n respectively by the
intercept and slope.
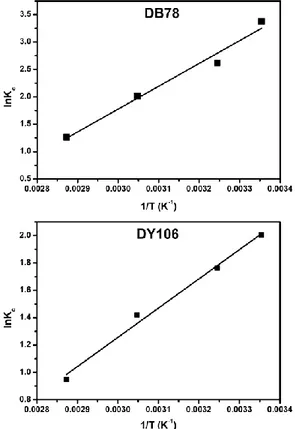
2.6 Thermodynamic analysis. Thermodynamic parameters, such as Gibb’s free energy change (ΔGº) (J mol-1), enthalpy change (ΔHº) (J mol-1) and entropy
change (ΔSº) (J mol-1 K-1), allow to understand the nature
of adsorption. They can be calculated using the following relations [32]: ∆G° = −RT lnKc Equation (7) Kc= Ci Ce Equation (8) ln Kc= ∆S° R − ∆H° RT Equation (9) ∆G° = ∆H° − T∆S° Equation (10) where R is the universal gas constant (8.314 J mol−1 K−1) and T is the solution temperature (K).
The enthalpy change (ΔH°) and the entropy change (ΔSº) are obtained from the slope and intercept of the plot of ln Kc versus 1/T (Fig. 8).
2.7 Adsorption Kinetics. The mechanisms that control
the adsorption process, such as chemical reaction, diffusion control and mass transfer, can be efficiently investigated by several models based on experimental data. Among these models, adsorption kinetic models are the most commonly used. The parameters obtained by these models allow to determine the uptake rate of solute which is a very useful value for design of full-scale batch adsorption process.
Thus, the adsorption kinetics of anionic dyes onto AL-CH beads were analyzed using the pseudo-first and second order kinetic models. The resultant values along with the corresponding linear regression correlation coefficients R2
were reported in Table 3 and the best-fit model was selected based on the R2 values.
2.7.1 Pseudo-first order model. The linearised integral
form of the pseudo-first order model was described by Lagergren [33] and generally it can be written in the following form:
log (qe− qt) = log qe− K1
2.303 t Equation (11)
where qe (mg/g) and qt (mg/g) are the amounts of dye
absorbed on beads respectively at equilibrium and at each time t and k1 (min-1) is the pseudo first order rate
constant. The Lagergren’s first order rate constant, k1, and
the theoretical qe determined from the model, were
calculated respectively by the slope and intercept values of plot log (qe - qt) versus t (Fig. 7a and 7c).
2.7.2 Pseudo-second order model. The simplified and
linearised equation of pseudo-second order kinetic model is described by the following equation [34]:
t qt= 1 K2·qe2+ t qe Equation (12)
http://dx.doi.org/10.22161/ijeab/2.4.48 ISSN: 2456-1878
where qe (mg/g) and k2 (g/mg min) are respectively the
equilibrium adsorption capacity and the pseudo-second order rate constant.
The qe and k2 values were determined from the slope and
intercept of plot t/qt vs t (Fig. 7b and 7d). The
applicability of the pseudo-second order model suggests that the chemisorption may be the rate-limiting step which controls the adsorption processes.
2.8 Desorption and dyeing experiments. The dyes
desorption from AL-CH beads was also studied to determine the feasible reuse of dyes in other dyeing processes. Indeed, this study has the dual objective to remove the dyes from wastewater and to recycle them. After the adsorption step, the AL-CH beads loaded with DB 78 and DY106 were collected and then left in contact with distilled water for 120 minutes at 368 K, under continuous stirring. The final dyes concentration in the liquid phase was measured to determine the amount of dyes release. Then, this colored solution was used to carry out the dyeing experiments on cotton fabric without adjusting the pH of the baths.
The dyeing experiments were performed for 120 minutes at 368 K in presence of increasing amounts of sodium sulfate to promote the dye exhaustion, that is the process of dye transferring from the water to fibers.
III. RESULTS AND DISCUSSION
3.1 Comparison of dyes adsorption: AL vs. AL-CH beads. To identity the best material able to adsorb
efficiently the anionic dyes, two different types of adsorbents, AL and AL-CH beads, were compared. 10 mL of DB78 (10.50 mg/L) and DY106 (13.30 mg/L) at pH 6 and 298 K were analysed using 0.5 g of AL and AL-CH beads as adsorbent.
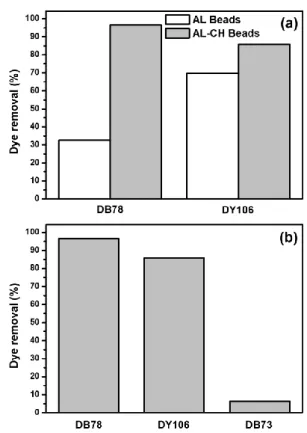
Data reported in Fig. 2a shows that AL-CH beads resulted to be a better adsorbent than AL beads.
Indeed, for DB78, the dye removal efficiency was 32.53% with AL beads, in contrast to the 96.67% when AL-CH beads were used. In the case of DY106, the dye removal was 69.84% and 85.85% for AL beads and AL-CH beads, respectively. This behavior indicates that the possible mechanisms of the adsorption process is mainly based on ionic interactions between the positive amino groups of the chitosan surface and the negative charges of the dyes [35]. Furthermore, in this study, the AL-CH beads were chosen as preferential adsorbent to treat the anionic dyes.
Fig. 2: (a) Adsorption comparison between different adsorbents, AL and AL-CH beads: 10 mL of DB78 (10.50
mg/L) and DY106 (13.30 mg/L) at pH 6 and 298 K using 0.5 g of AL and AL-CH beads, respectively. (b) Adsorption comparison between different dyes: 10
mL of DB78 (10.50 mg/L), DY106 (13.30 mg/L) and DB73 (18.00 mg/L) at pH 6 and 298 K with 0.5 g of
AL-CH beads.
3.2 Adsorption mechanism. To prove that the adsorption
process depends on electrostatic attractions between the cationic groups of protonated chitosan and the anionic groups of dyes, the removal efficiency of the two ionic dyes (DB78 and DY106) was compared to those of DB73, characterized by the absence of ionizable groups. The adsorption of DB78 (10.50 mg/L), DY106 (13.30 mg/L) and DB73 (18.00 mg/L) on 0.5 g of AL-CH beads were separately analyzed at pH 6 and 298 K.
As shown in Fig. 2b, the removal of non-ionic DB73 was a low 6.27% compared with the higher values relative to the anionic dye removal: 96.67% for DB78 and 85.85% for DY106. The great difference in the adsorption percentage indicates that the electrostatic interactions are the main responsible in adsorption, although other weak bonds between dyes and polysaccharide chains cannot be excluded [36].
Moreover, the better adsorption of DB78, in comparison to DY106, could be attributed to the dye chemical structure. Indeed, the presence of four sulfonate groups on
http://dx.doi.org/10.22161/ijeab/2.4.48 ISSN: 2456-1878
DB78 structure (Fig. 1), allows to give a higher dye/chitosan molecular ratio than the six groups on DY106 [35].
3.3 Dye removal experiments.
3.3.1 Effect of contact time. 10 mL of DB78 (32.00
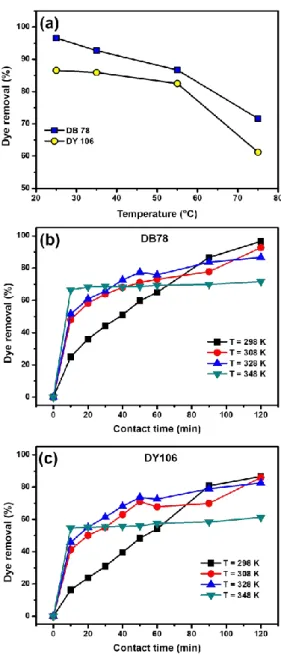
mg/L) and DY106 (40.00 mg/L) were stirred with 0.5 g of AL-CH beads at pH 6 and 298 K until 24 hours. To determine the best contact time of adsorption processes, the dye concentrations were measured at different times. The data reported in Fig. 3a indicate that the removal of both direct dyes increased with time and, in the first minutes of adsorption process, the removal of DB78 was more fast than that of DY106. 84.05% of DB78 was removed from aqueous solution within the first 60 minutes and then the dye removal gradually increased to 95.65% in the next 60 minutes. Thereafter, no further appreciable adsorption occurred, so 120 minutes were deemed as the equilibrium time. Also, the percentage of DY106 removal increased from 67.80% to 83.21% when time was increased from 60 to 120 minutes.
Then, also for this dye, the time required to achieve the equilibrium was about 120 minutes. This could be attribute to the active site saturation of the adsorbent, which do not allow further adsorption [37].
3.3.2 Effect of adsorbent dosage. The adsorption of
DB78 (32.00 mg/L) and DY106 (40.00 mg/L) solutions on AL-CH beads was also studied ranging only the adsorbent dosage, from 0.1 to 0.5 g, and maintaining constant the other parameters.
The systems, at pH 6 and 298 K, were stirred until the equilibrium was reached, and the remaining amount of the dye in solutions were measured. Fig. 3b indicates that the percentage of removal for the two dyes increased with the increase of adsorbent amount. Indeed, the dye removal from the initial solutions increased from 64.05% to 95.67% for DB78 and from 70.45% to 84.23% for DY106, as the adsorbent dosage increased from 0.1 to 0.5 g. This result is attributable to the increase in adsorbent surface area with the consequential increase in available adsorption sites [37].
A further increase in adsorbent dosage did not improve the removal percentage of both dyes, hence 0.5 g of AL-CH beads were selected as the optimum adsorbent dosage for the removal of the dyes.
Fig. 3: (a) Effect of contact time on the removal of DB78 (32.00 mg/L) and DY106 (40.00 mg/L). 10 mL of dye solution with 0.5 g of AL-CH beads at pH 6 and 298 K were studied. (b) Effect of AL-CH beads dosage on the removal of DB78 (32.00 mg/L) and DY106 (40.00 mg/L)
at pH 6 and 298 K. Increasing amount of adsorbent dosage, in the range from 0.1 to 0.5 g, were added into 10
mL of dye solutions.
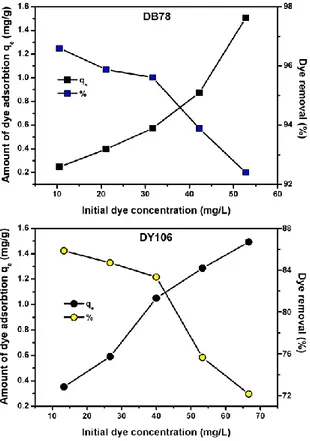
3.3.3 Effect of initial dye concentration. Increasing
concentrations of DB78 and DY106 solutions were used to study the effect of initial dye concentration on the adsorption mechanism. The experiments were performed at pH 6 and 298 K, using a constant volume of dye solution (10 mL) and a constant dosage of adsorbent (0.5 g). Fig. 4 shows that increasing the dye initial concentration, an increase in the dye adsorption capacity onto AL-CH beads was observed. As the initial concentration of DB78 increased from 10.50 to 52.80 mg/L, the amount of dye adsorbed onto beads at equilibrium, qe, improved from 0.25 to 1.51 mg/L. In the
case of DY106, qe increased from 0.35 to 1.49 mg/L
incrementing the dye initial concentration from 13.30 to 66.60 mg/g. These results suggest that higher initial concentrations of dye provide high driving force able to overcome the dye resistance to the mass transfer between the aqueous and the solid phase [38].
http://dx.doi.org/10.22161/ijeab/2.4.48 ISSN: 2456-1878
Besides, observing the adsorption percentage (Fig. 4), it decreased as the initial dye concentration incremented. The dye removal decreased from 96.67% to 92.40% and from 85.85% to 72.20% for increasing concentration of DB78 and DY106, respectively, indicating a reduction in the availability of surface area due to the increment of dye amount. Indeed, for constant amount of adsorbent, increasing the initial dye concentration, the available adsorption sites become fewer, and hence the percentage of removed dye, which depends upon the initial concentration, decreases [39].
Fig. 4: Effect of initial dye concentration on the adsorption of DB78 and DY106 onto AL-CH beads (volume of dye solution 10 mL, adsorbent dosage 0.5 g, pH 6 and temperature 298 K). Increasing concentrations of dyes in the range from 10.50 to 52.80 mg/L, for DB78,
and from 13.30 to 66.60 mg/L, for DY106, were respectively used.
3.3.4 Effect of initial pH. The dye solution pH affects the
adsorption process acting not only on the adsorbent external surface charge, but varying also the ionization degree of the solubilized substances, the dissociation of functional groups on the adsorbent active sites, the chemistry of dye solution [37], and the interaction between the alginate and the chitosan surfaces.
Generally, as reported in literature, when chitosan supports are used as adsorbent materials, the percentage
of anionic dye removal increases decreasing the pH [20, 26]. Indeed, at low pH, more protons are available to protonate the amino groups of chitosan molecules forming many positive charges (–NH3+), confirming the
essential role of electrostatic attractions between protonated chitosan positive charges and the negative charges of anionic dyes. However, in the present study, a different behavior it was observed: the anionic dye adsorption onto AL-CH beads did not increase with the pH decrease. On the contrary, as shown in Fig. 5, the DB78 and DY106 removal, at different pH values, increased from 83.77% to 96.67% and 71.66% to 85.85%, respectively, when solution pH increased from 2 to 6 units. This result indicates that, probably, in the case of AL-CH beads, the solution pH affects also the ionic interaction between alginate and chitosan functional groups. At low values of pH, the carboxylic groups of alginate polymers are protonated and, consequently, are no longer able to interact with –NH3+ groups of chitosan.
It causes a weakening of beads structure and a significant decrease in the adsorbent efficiency. Simsek-Ege et al. [39] have indeed demonstrated that the yield of the complex formation of chitosan coating on alginate was higher when the complex is prepared at pH 5 than at pH 2. Therefore, in our experiments, the solution pH 6 was used to perform all the adsorption processes, considering also that at pH > 6 the AL-CH bead structure becomes very instable.
Fig. 5. Effect of initial pH on the removal of DB78 (10.50 mg/L) and DY106 (13.30 mg/L) at increasing pH values
(from pH 2 to pH 6). The adsorption of 10 mL of dyes solutions was studied at 298 K using 0.5 g of AL-CH
beads.
3.3.5 Effect of temperature. The effect of temperature
on AL-CH bead adsorption capacity was investigated increasing temperature values, from 298 to 348 K, maintaining constant both adsorbent amount (0.5 g) and dye solution volume (10 mL) at pH 6.
http://dx.doi.org/10.22161/ijeab/2.4.48 ISSN: 2456-1878
Fig. 6a shows that the amount of dye removal decreased from 96.65% to 71.67% for DB78 and from 85.80% to 61.24% for DY106 when the temperature increased from 298 to 328 K as the temperature incremented, indicating an exothermic process in the dye adsorption on AL-CH beads. Even if in the first minutes of process an increase in the temperature seemed to affect the adsorption rate, at the end of the process, when the equilibrium was reached, the increase in the temperature led to a decrease of dye removal (Fig. 6b and 6c).
Fig. 6: (a, b, c) Effect of temperature on the removal of DB78 (10.50 mg/L) and DY106 (13.30 mg/L) at increasing temperature values (from 298 to 348 K). The adsorption of 10 mL of dye solutions was studied at pH 6
using 0.5 g of the adsorbent.
This result suggests that the temperature increase determines an increase in the dye diffusion which
consequently induces an increase in the adsorption rate. Further, the increase in temperature provokes also an increase of dye solubility, making the interactions between solute and solvent stronger than those between solute and adsorbent. So, the dye adsorption on AL-CH beads becomes more difficult at high temperature. On the other hand, the temperature influences not only the adsorption, but also the desorption processes. Indeed, the release study confirmed the reversibility of the adsorption mechanism.
3.4 Adsorption equilibrium isotherms. The adsorption
isotherms of DB78 and DY106 onto AL-CH beads were determined at pH 6 maintaining the system at 298 K. Various adsorbent quantities, in the range of 0.1-0.5 g, were added to 10 mL of DY78 (32.00 mg/L) and DY106 (40.00 mg/L) and the adsorption process was followed until the achievement of the equilibrium state.
The Langmuir and Freundlich adsorption isotherm parameter values for DB78 and DY106 and their plots are showed in Table 2 and in Fig. 7, respectively. The value of the linear regression correlation coefficient R2 give
information about the best-fit model.
Based on the Langmuir isotherm analysis, the maximum monolayer amount, qm, of DB78 and DY106 adsorbed on
beads was only 2.43 and 4.61 mg/g, respectively. These values were much lower than those calculated experimentally. These results suggest that the Langmuir model did not properly describe the anionic dye adsorption process on AL-CH beads. This is also confirmed by values of the linear correlation coefficients R2 reported in Table 2. Applying the Freundlich isotherm
model, the calculated R2 coefficients resulted indeed
higher than the previous ones for the adsorption of both dyes. This indicates that the DB78 and DY106 adsorption onto AL-CH adsorbent could be better described by the Freundlich model than the Langmuir model, suggesting that no monolayer adsorption of dye occurred, involving the heterogeneous surface of the adsorbent material. In addition, the Freundlich factors of heterogeneity, n, were determined as 2.4319, for the DB78, and 1.4688, for the DY106, indicating a favorable adsorption process (n > 1).
Table 2: Adsorption isotherm values for DB78 and DY106.
Dye Langmuir model Freundlich model KL (L/m g) qm (mg/ g) R2 K F (L/g) n R2 DB7 8 0.388 4 2.43 25 0.96 68 0.74 38 2.43 19 0.99 42 DY1 06 0.058 6 4.61 47 0.97 13 0.35 86 1.46 88 0.98 42
http://dx.doi.org/10.22161/ijeab/2.4.48 ISSN: 2456-1878
Fig. 7: Adsorption isotherm plots for the adsorption of DB78 (32.00 mg/L) and DY106 (40.00 mg/L) onto AL-CH
beads at pH 6 and at constant temperature of 298 K.
3.5 Thermodynamic analysis. The plot of ln Kc versus
1/T, showed in Fig. 8, allowed to calculate the enthalpy change and the entropy change. The calculated ΔH° values of DB78 and DY106 adsorption by AL-CH beads were -34.65 kJ mol−1 and -17.77 kJ mol−1, respectively. This indicates that the adsorption followed an exothermic process as already hypothesized. The corresponding values of ΔS° were -89.17 J mol-1 K-1 for DB78 and
-42.87 J mol-1 K-1 for DY106. These negative values
indicate that the disorder of the system decreased at the solid–solution interface during dyes adsorption on adsorbent. Moreover, the values of ΔG° at 298, 308, 328 and 348 K are -8.08, -7.18, -5.40 and 3.62 kJ mol−1 respectively for DB78 and -4.99, -4.57, -3.71 and -2.85 kJ mol−1 respectively for DY106. The negative values of ΔG° indicate the spontaneity and feasibility of the adsorption process. Since when the ΔG° values range between −20 and 0 kJ mol-1, the adsorption is classified as
physical adsorption, [32] in this study it is possible to affirm that the anionic dyes adsorption on AL-CH beads was mainly physical, involving electrostatic interactions.
Fig. 8: Plot of ln Kc versus 1/T for DB78 (10.50 mg/L) and DY106 (13.30 mg/L) using 10 mL of dye solutions,
pH 6 using 0.5 g of AL-CH beads.
3.6 Adsorption Kinetics. The applicability of the
pseudo-first and pseudo-second order kinetic model was also tested for describing the adsorption process of anionic dyes on AL-CH beads.
http://dx.doi.org/10.22161/ijeab/2.4.48 ISSN: 2456-1878
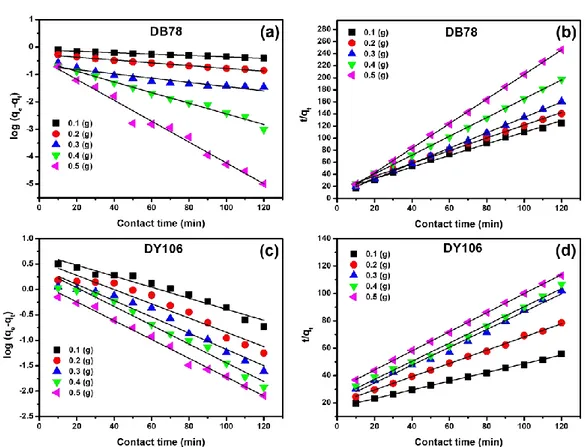
Fig. 9: Adsorption kinetic models of DB78 (32.00 mg/L) and DY106 (53.30 mg/L) onto AL-CH beads (from 0.1 to 0.5 g) at pH 6 and 298 K. Application of pseudo-first order kinetic model at (a) DB78, (c) DY106. Application of pseudo-second order
kinetic model at (b) DB78, (d) DY106.
Table 3: Pseudo-first and pseudo-second order kinetic parameters for adsorption of DB78 and DY106 on AL-CH beads.
Pseudo-first order model Pseudo-second order model Dye AL-CH beads
dosage (g) qeexp (mg/g) k1 (min-1) qethe (mg/g) R2 k 2 (g/mg.min) qethe (mg/g) R2 DB78 0.1 1.3564 0.0059 0.1003 0.9884 0.0695 1.0366 0.9923 0.2 0.9953 0.0117 0.5425 0.9868 0.0714 0.9448 0.9967 0.3 0.7634 0.0178 0.2151 0.8815 0.2365 0.7844 0.9998 0.4 0.6087 0.0447 0.3202 0.9858 0.2555 0.6416 0.9997 0.5 0.4824 0.0877 0.3820 0.9824 2.3202 0.4909 0.9997 DY106 0.1 3.1992 0.0249 4.9709 0.9541 0.0061 3.1314 0.9984 0.2 2.1961 0.0323 3.6261 0.9267 0.0118 2.0666 0.9987 0.3 1.7473 0.0368 2.6402 0.9585 0.0197 1.5350 0.9909 0.4 1.5067 0.0425 2.5417 0.9778 0.0184 1.5062 0.9933 0.5 1.3684 0.0426 1.3379 0.9899 0.0162 1.4329 0.9997 These models were used for fitting (Fig. 9) experimental
data recorded at pH 6 and 298 K using 10 mL of DB78 (32.00 mg/L) and DY106 (53.30 mg/L) onto different amount of adsorbent dosage (from 0.1 to 0.5 g). All kinetic parameters were presented in Tables 3. The linear regression coefficients (R2) obtained by applying the
pseudo-second order kinetics model were higher than those calculated by using the pseudo-first order kinetics model, suggesting that the DB78 and DY106 adsorption
on AL-CH beads follows a pseudo-second order kinetics. In addition, as reported in Table 3, the corresponding calculated qethe values are very close to the experimental
ones (qeexp). These data agree with other adsorption
studies based on various chitosan-based adsorbent which reported similar kinetic trends [13].
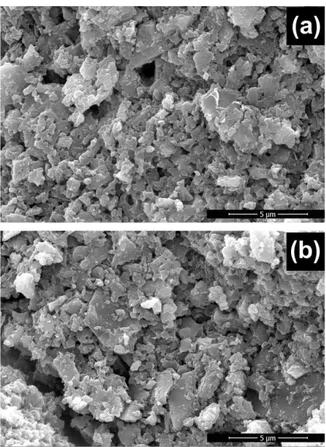
3.7 Scanning electron microscopy (SEM) analyses.
AL-CH beads and DB78 loaded AL-AL-CH beads were analyzed by scanning electron microscopy to study their
http://dx.doi.org/10.22161/ijeab/2.4.48 ISSN: 2456-1878
morphology. SEM images (Fig. 10) showed a highly porous and irregular structure, whose cavities are potentially able to adsorb the dyes molecules. This surface morphology agrees with the results obtained by Freundlich model of adsorption equilibrium isotherms, where a heterogeneous adsorption was demonstrated. Moreover, the presence of loaded dyes did not affect significantly the morphology of the samples.
Fig. 10: SEM images. (a) AL-CH beads. (b) DB78 loaded AL-CH beads
3.8 FTIR-ATR spectroscopy measurements. Infrared
(IR) spectra of studied samples (Fig. 11) were recorded to confirm the alginate-chitosan interactions and to better understand the dye-chitosan interactions.
Fig. 11: ATR-FTIR spectra of adsorbent system. (a) AL beads and AL-CH beads spectra. (b) DB78, DB78 loaded
AL-CH beads and AL-CH beads spectra. (c) DY106, DY106 loaded AL-CH beads and AL-CH beads spectra.
In Fig. 11a the spectra of AL beads and AL-CH beads were showed. AL beads displayed two intense absorption bands at 1597 cm-1 and at 1417 cm-1, characteristic of
alginate, assigned to the asymmetric and symmetric stretching of carboxylate groups [40, 41], that in the AL-CH bead spectrum, resulted shifted to 1587 cm-1 and to
1415 cm-1, respectively [42]. In addition, in the AL-CH
IR spectrum, a new less intense peak appeared at 1543 cm-1, attributable to the N-H bending vibration
characteristic of chitosan amide II band, although the signal was shifted respect to the corresponding one in pure chitosan (1599 cm-1). These results confirm the
chitosan coating of alginate beads by means of electrostatic interactions involving the carboxylic groups
http://dx.doi.org/10.22161/ijeab/2.4.48 ISSN: 2456-1878
of AL-beads [41]. Moreover, new peaks were observed in AL-CH bead FTIR spectrum: a very weak signal at 1081 cm-1, which may be attributed to the secondary hydroxyl
group (C-O stretch mode relative to -CH-OH in cyclic alcohols) [41], and another one at around 1000 cm-1
corresponding to the variations of C-O stretching in the ring relative to the C-OH, C-O-C and CH2OH moieties
[43].
The FTIR spectra of AL-CH beads before and after the adsorption of DB78 and DY106 were also compared. In the spectrum of DB78 loaded AL-CH beads (Fig. 11b), a reduction in intensity of chitosan signal at 1543 cm-1 was
observed compared to the corresponding signal in the AL-CH bead spectrum, suggesting the presence of dye-chitosan interaction through dye-chitosan amide group. Additionally, a further intensity reduction of chitosan signal at 1002 cm-1 was also observed.
On the other hand, two new peaks were observed on AL-CH beads in presence of DB78: a very weak signal at 1459 cm-1 attributable to aromatic dye rings and another
at 1210 cm-1, corresponding to dye -SO
3- groups [44].
These signals confirm the addition of dye on the chitosan polymer shell.
A similar behavior was observed in the case of FTIR spectra of DY106 loaded AL-CH beads (Fig. 11c). The total absence of peaks at 1543 and 1002 cm-1 and the
presence of a new weak peak at 1210 cm-1 were observed.
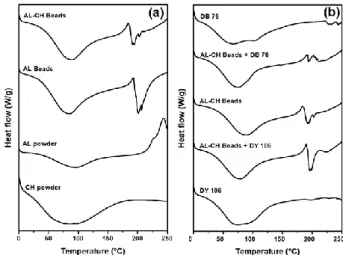
3.9 Thermal analysis. The thermal behavior of AL beads
and AL-CH beads loaded with DB78 and DY106 was investigated by DSC and TGA. As shown in Fig. 12a, the DSC thermograms for sodium alginate powder, chitosan powder, AL beads and AL-CH beads exhibited a broad endothermic peak at about 90°C attributed to the loss of water associated to hydrophilic groups of AL and CH polymers [45]. The exothermic peak at about 245°C and the double exothermic endothermic peaks at about 180°C and 190°C for the AL powder, AL-CH beads and AL beads, respectively, indicated the beginning of a multistep decomposition process also confirmed by thermogravimetric curves (Fig. 13a), in agreement with literature [46].
The two dyes, DB78 and DY106, were thermally more stable than adsorbent beads as shown by DSC and TG curves in Fig. 12b and 13b. So, also AL-CH beads loaded with DB78 and DY106 were more stable than unloaded beads. Finally, these results confirmed the presence of interactions between the two dyes and Al-CH beads and showed that the loaded or unloaded beads have good thermal stability suitable for the practical application herein proposed.
Fig. 12: Thermograms obtained by DSC for pure materials, beads and loaded beads. (a) Thermograms of
AL powder, CH powder, AL beads, AL-CH beads. (b) Thermograms of DB78, DY106, DB78 loaded AL-CH beads, DY106 loaded AL-CH beads and AL-CH beads.
Fig. 13: Thermograms obtained by TGA for pure
materials, beads and loaded beads. (a) Thermograms of AL powder, CH powder, AL beads, AL-CH beads. (b) Thermograms of DB78, DY106, DB78 loaded AL-CH beads, DY106 loaded AL-CH beads and AL-CH beads.
3.10 Desorption and dyeing experiments. The
http://dx.doi.org/10.22161/ijeab/2.4.48 ISSN: 2456-1878
studied adding 0.6 g of dye loaded beads in 10 mL of distilled water for 120 minutes at 368 K, under continuous stirring. The final concentration of the adsorbate in the liquid phase was measured and the obtained amount of desorbed dye was 15.27 mg/L for DB78 and 20.16 mg/L for DY106. The amount of released dye was about 50% for both dyes, if compared to the initial quantity of adsorbed dyes.
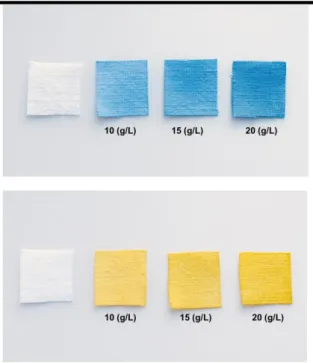
These experiments confirm that the temperature affects both the adsorption and the desorption processes, indicating that the adsorption mechanism is a reversible process thanks to weak electrostatic interactions between adsorbate and adsorbent. Successively, the colored solutions obtained from desorption experiments, were directly used to dye some surfaces of cotton fabric. Small pieces (1.5×1.5 cm) of a white cotton fabric, with a superficial area equal to 2.25 cm2, were immersed in 10
mL of colored solution for 120 minutes at high temperature (368 K) in presence of increasing amounts of sodium sulfate (10, 15 and 20 g/L) to promote the dye transferring from solution to fibers of fabric. Then, the amount of dye adsorbed on fabric (mg/cm2) were
measured and their values are reported in Fig. 14. The effect of the salt amount on the dye exhaustion is also clearly visible in the photos where the final outcome on fabrics was shown in Fig. 15. The results indicate that increasing the sodium sulfate concentration, the dyestuff coloring ability increments, suggesting a neutralization of cotton negative charge by sodium ions in the dye bath, favoring the fabric dyeing [47].
10 12 14 16 18 20 0.010 0.015 0.020 0.025 0.030 0.035 A mo u n t o f d yes ad so rb ed o n fab ri c (mg /cm 2 ) Sodium sulphate (g/L) DB 78 DY 106
Fig. 14: Plot of amount of DB78 and DY106 dyes adsorbed on fabric vs. sodium sulfate concentration (10,
15 and 20 g/L). Dyeing experiments were performed at 368 K for 120 minutes.
Fig. 15: Photographs of the outcome after the dyeing process on fabric in presence of increasing concentration
of sodium sulfate (10, 15 and 20 g/L).
IV. CONCLUSION
Chitosan-alginate beads demonstrated to have a great potential as adsorbent material for the removal of anionic dyes from textile wastewater at room temperature and pH 6. The study conducted on alginate beads and on a nonionic dye established that the direct dyes interact with the chitosan shell by means of electrostatic interactions between the dye sulfonate groups and the cationic amino groups of protonated chitosan. The results showed a higher adsorption affinity of DB78 compared to DY106, owing to the differences in the molecular weight of the dye molecules and the number of sulfonate groups on each dye. About the isotherm analysis, the Freundlich isotherm model was found to provide the best prediction for the dye adsorption process, suggesting a heterogeneous adsorption on the adsorbent surface. Adsorption kinetics studies reported that a pseudo-second order kinetic provided the best correlation of the experimental data. Thermodynamic analysis demonstrated that the adsorption is an exothermic, spontaneous, and physical process.
Moreover, it was demonstrated that the studied system has not only the ability to remove dyes from wastewater, reducing the pollution, but also the ability to desorb them for further dyeing processes, considering the point of view of a sustainable recycling economy of textile dyeing process.
http://dx.doi.org/10.22161/ijeab/2.4.48 ISSN: 2456-1878 ACKNOWLEDGEMENTS
This study was financed by the European project “DYES4EVER” (Use of cyclodextrins for treatment of wastewater in textile industry to recover and reuse textile dyes, LIFE12 ENV/ES/000309) within the LIFE+ 2012 “Environment Policy and Governance project application” program. Some instruments used in this study were funded by the Italian Ministry of Education, University and Research (MIUR) for the project “PON R&C - Laboratorio per lo Sviluppo Integrato delle Scienze e delle TEcnologie dei Materiali Avanzati e per dispositivi innovativi”. We gratefully acknowledge the skilful and excellent technical assistance of Mr. Sergio Nuzzo.
REFERENCES
[1] Yagub M.T., Sen T.K., Afroze S., Ang H.M. Dye and its removal from aqueous solution by adsorption: A review. Adv Colloid Interface Sci. 2014, 209:172– 184.
[2] Robinson T., McMullan G., Marchant R., Nigam P. Remediation of dyes in textile effluent: a critical review on current treatment technologies with a proposed alternative. Bioresour Technol. 2001, 77: 247–255.
[3] Kadirvelu K., Kavipriya M., Karthika C., Radhika M., Vennilamani N., Pattabhi S. Utilization of various agricultural wastes for activated carbon preparation and application for the removal of dyes and metal ions from aqueous solutions. Bioresour Technol. 2003, 87:129–132.
[4] Semeraro P., Rizzi V., Fini P., Matera S., Cosma P., Franco E., García R., Ferrándiz M., Núñez E., Gabaldón J.A., Fortea I., Pérez E., Ferrándiz M. Interaction between industrial textile dyes and cyclodextrins. Dyes Pigments. 2015, 119:84–94. [5] Brüschweiler B.J., Küng S., Bürgi D., Muralt L.,
Nyfeler E. Identification of non-regulated aromatic amines of toxicological concern which can be cleaved from azo dyes used in clothing textiles. Regul Toxicol Pharmacol. 2014, 69:263–272. [6] Gupta V.K., Suhas, Application of low-cost
adsorbents for dye removal – A review. J Environ Manage. 2009, 90:2313–2342.
[7] Tauber M.M., Gubitz G.M., Rehorek A. Degradation of azo dyes by oxidative processes – Laccase and ultrasound treatment. Bioresour Technol. 2008, 99:4213–4220.
[8] Sun Q., Yang L. The adsorption of basic dyes from aqueous solution on modified peat-resin particle. Water Res. 2003, 37:1535–1544.
[9] Abbasi M. Synthesis and characterization of magnetic nanocomposite of chitosan/SiO2/carbon
nanotubes and its application for dyes removal. J Clean Prod. 2017, 145:105–113.
[10] Kabbout R., Taha S. Biodecolorization of Textile Dye Effluent by Biosorption on Fungal Biomass Materials. Phys Procedia. 2014, 55:437–444.
[11] Jain A.K., Gupta V.K., Bhatnagar A., Suhas. Utilization of industrial waste products as adsorbents for the removal of dyes. J Hazard Mater. 2003, 101:31–42.
[12] Kaur H., Sharma G. Removal of Dyes from Textile Industry Effluent: A Review. SSRG Int J Humanit Soc Sci. 2015, 59–63.
[13] Crini G. Non-conventional low-cost adsorbents for dye removal: A review. Bioresour Technol. 2006, 97:1061–1085.
[14] Franco E., Ferrandiz M., Moldovan S., Fini P., Semeraro P., Cosma P., Núñez E., Gabaldón J.A., Fortea I., Pérez E., Ferrándiz M. Reuse of recovered dyes in cyclodextrins in dyeing process. Vlakna a Textil. 2016, 23(3): 62-68.
[15] Sayğılı H., Güzel F., Önal Y. Conversion of grape industrial processing waste to activated carbon sorbent and its performance in cationic and anionic dyes adsorption. J Clean Prod. 2015, 93:84–93. [16] Jáuregui-Rincón J., Lozano-Alvarez J.A.,
Medina-Ramírez I. Zimm-Bragg Model Applied to Sorption of Dyes by Biopolymers: Alginic Acid and Xanthan. Biotechnol Biopolymers. 2011, 9:165–190.
[17] Lozano-Alvarez J.A., Marañón-Ruiz V.F., Jáuregui-Rincón J., Medina-Ramírez I., Frausto-Reyes C., Salinas-Gutiérrez R. Removal of Direct Dyes with Alginic Acid. J Mex Chem Soc. 2015, 59:215–228. [18] Dotto G.L., Santos J.M.N., Tanabe E.H., Bertuol
D.A., Foletto E.L., Lima E.C., Pavan F.A. Chitosan/polyamide nanofibers prepared by Forcespinning® technology: A new adsorbent to remove anionic dyes from aqueous solutions. J Clean Prod. 2017, 144:120–129.
[19] Rizzi V., Longo A., Fini P., Semeraro P., Cosma P., Franco E., García R., Ferrándiz M., Núñez E., Gabaldón J.A., Fortea I., Pérez E., Ferrándiz M. Applicative study (Part I): the excellent conditions to remove in batch direct textile dyes (Direct red, Direct blue and Direct yellow) from aqueous solutions by adsorption processes on low-cost chitosan films under different conditions. Adv Chem Eng Sci. 2014, 4:454–469.
[20] Vakili M., Rafatullah M., Salamatinia B., Abdullah A.Z., Ibrahim M.H., Tan K.B., Gholami Z., Amouzgar P. Application of chitosan and its derivatives as adsorbents for dye removal from water and wastewater: A review. Carbohydr Polym. 2014, 113:115–130.
http://dx.doi.org/10.22161/ijeab/2.4.48 ISSN: 2456-1878
[21] Grant G.T., Morris E.R., Rees D.A., Smith P.J.C., Thom D. Biological interactions between polysaccharides and divalent cations: the egg-box model. FEBS Lett. 1973, 32:195–198.
[22] Morris E.R., Rees D.A., Thom D., Boyd J. Chiroptical and stoichiometric evidence of specific, primary dimerisation process in alginate gelation. Carbohydr Res. 1978, 66:145–154.
[23] Aravindhan R., Fathima N.N., Rao J.R., Nair B.U. Equilibrium and thermodynamic studies on the removal of basic black dye using calcium alginate beads. Colloids Surf A: Physicochem Eng Aspects. 2007, 299:232–238.
[24] Ribeiro A.J., Silva C., Ferreira D. Veiga F. Chitosan-reinforced alginate microspheres obtained through the emulsification/internal gelation technique. Eur J Pharm Sci. 2005, 25:31–40.
[25] Hebeish A., Rafei R., El-Shafei A. Crosslinking of chitosan with glutaraldehyde for removal of dyes and heavy metals ions from aqueous solutions. Egypt J Chem. 2004, 47:65–79.
[26] Chiou M.S., Ho P.Y. Li H.Y. Adsorption of anionic dyes in acid solutions using chemically cross-linked chitosan beads. Dyes Pigments. 2004, 60:69–84. [27] Wan Ngah W.S., Teong L.C., Hanafiah M.A.K.M.
Adsorption of dyes and heavy metal ions by chitosan composites: A review. Carbohyd Polym. 2011, 83:1446–1456.
[28] Hameed B.H., Mahmoud D.K., Ahmad A.L. Equilibrium modeling and kinetic studies on the adsorption of basic dye by a low-cost adsorbent: Coconut (Cocos nucifera) bunch waste. Journal of Hazardous Materials. 2008, 158:65–72.
[29] Moussavi G. and Mahmoudi M. Removal of azo and anthraquinone reactive dyes from industrial wastewaters using MgO nanoparticles. Journal of Hazardous Materials. 2009, 168:806–812.
[30] Langmuir I. The adsorption of gases on plane surfaces of glass, mica and platinum. J Am Chem Soc. 1918, 40(9):1361–403.
[31] Kannan N., Sundaram M.M. Kinetics and mechanism of removal of methylene blue by adsorption on various carbons-a comparative study. Dyes and Pigments. 2001, 51:25–40.
[32] Ali I.H., Alrafai H.A. Kinetic, isotherm and thermodynamic studies on biosorption of chromium(VI) by using activated carbon from leaves of Ficus nitida. Chemistry Central Journal. 2016, 10:36.
[33] Ho Y.S. Citation review of Lagergren kinetic rate equation on adsorption reactions. Scientometrics. 2004, 59(1):171–177.
[34] Ho Y.S., McKay G. Pseudo-second order model for sorption processes. Process Biochemistry. 1999, 34:451–465.
[35] Wong, Y.C., Szeto Y.S., Cheung W.H., McKay G. Adsorption of acid dyes on chitosan-equilibrium isotherm analyses. Process Biochem. 2004, 39:693– 702.
[36] Rizzi V., D'Agostino F., Fini P., Semeraro P., Cosma P. An interesting environmental friendly cleanup: The excellent potential of olive pomace for disperse blue adsorption/desorption from wastewater. Dyes and Pigments. 2017, 140:480–490.
[37] Crini G., Badot P.M. Application of chitosan, a natural aminopolysaccharide, for dye removal from aqueous solutions by adsorption processes using batch studies: A review of recent literature. Prog Polym Sci. 2008, 33:399– 447.
[38] Yagub M.T., Sen T.K., Ang H.M. Equilibrium, Kinetics, and Thermodynamics of Methylene Blue Adsorption by Pine Tree Leaves. Water Air Soil Pollut. 2012, 223:5267–5282.
[39] Simsek-Ege F.A., Bond G.M., Stringer J. Polyelectrolyte Complex Formation Between Alginate and Chitosan as a Function of pH. J Appl Polym Sci. 2003, 88:346–351.
[40] Lawrie G., Keen I., Drew B., Chandler-Temple A., Rintoul L., Fredericks P., Grøndahl L. Interactions between Alginate and Chitosan Biopolymers Characterized Using FTIR and XPS. Biomacromolecules. 2007, 8:2533–2541.
[41] Li P., Dai Y.N., Zhang J.P., Wang A.Q., Wei Q. Chitosan-Alginate Nanoparticles as a Novel Drug Delivery System for Nifedipine. Int J Biomed Sci. 2008, 4:221–228.
[42] Li T., Shi X.W., Du Y.M., Tang Y.F. Quaternized chitosan/alginate nanoparticles for protein delivery. J Biomed Mater Res A. 2007, 83:383–390.
[43] Darder M., Colilla M., Ruiz-Hitzky E. Biopolymer-Clay Nanocomposites Based on Chitosan Intercalated in Montmorillonite. Chem Mater. 2003, 15:3774– 3780.
[44] Sakkayawong N., Thiravetyan P., Nakbanpote W. Adsorption mechanism of synthetic reactive dye wastewater by chitosan. J Colloid Interf Sci. 2005, 286:36–42.
[45] Hosseini S.M., Hosseini H., Mohammadifar M.A., Mortazavian A.M., Mohammadi A., Khosravi-Darani K., Shojaee-Aliabadi S., Dehghan S., Khaksar R. Incorporation of essential oil in alginate microparticles by multiple emulsion/ionic gelation process. Int J Biol Macromol. 2013, 62:582–588. [46] Vijaya Y., Popuri S.R., Reddy G.S., Krishanaiah A.
http://dx.doi.org/10.22161/ijeab/2.4.48 ISSN: 2456-1878
biopolymer sorbent for the removal of fluoride ion from aqueous solutions. Desalin Water Treat. 2011, 25:159–169.
[47] Ali S., Hussain T., Nawaz R. Optimization of alkaline extraction of natural dye from Henna leaves and its dyeing on cotton by exhaust method. J Clean Prod. 2009, 17:61–66.