Contents lists available atScienceDirect
Applied Energy
journal homepage:www.elsevier.com/locate/apenergy
Technoeconomic assessments of hybrid photovoltaic-thermal vs.
conventional solar-energy systems: Case studies in heat and power provision
to sports centres
Kai Wang
a,⁎, María Herrando
a,b, Antonio M. Pantaleo
a,c, Christos N. Markides
a aClean Energy Processes (CEP) Laboratory, Department of Chemical Engineering, Imperial College London, London SW7 2AZ, United Kingdom bFluid Mechanics Group, University of Zaragoza, Zaragoza 50007, SpaincDepartment of Agro-Environmental Sciences, University of Bari, Via Amendola 165/A, 70125 Bari, Italy
H I G H L I G H T S
•
Various solar energy systems for combined heat and power provision are compared.•
PVT CHP system has the highest total energy output and emission reduction potential.•
PV system has the shortest payback time and the lowest levelised cost of energy.•
ETC solar-thermal system is economically inviable for the sport centre application.•
PVT CHP system attains the highest total cost saving if a carbon price is imposed. A R T I C L E I N F OKeywords: Cogeneration
Combined heat and power CHP
PV-thermal Solar collector
Internal combustion engine
A B S T R A C T
This paper presents a comprehensive analysis of the energetic, economic and environmental potentials of hybrid photovoltaic-thermal (PVT) and conventional solar energy systems for combined heat and power provision. A solar combined heat and power (S-CHP) system based on PVT collectors, a solar-power system based on PV panels, a solar-thermal system based on evacuated tube collectors (ETCs), and a S-CHP system based on a combination of side-by-side PV panels and ETCs (PV-ETC) are assessed and compared. A conventional CHP system based on a natural-gas-fired internal combustion engine (ICE) prime mover is also analysed as a com-peting fossil-fuel based solution. Annual simulations are conducted for the provision of electricity, along with space heating, swimming pool heating and hot water to the University Sports Centre of Bari, Italy. The results show that, based on a total installation area of 4000 m2in all cases, the PVT S-CHP system outperforms the other
systems in terms of total energy output, with annual electrical and thermal energy yields reaching 82.3% and 51.3% of the centre’s demands, respectively. The PV system is the most profitable solar solution, with the shortest payback time (9.4 years) and lowest levelised cost of energy (0.089 €/kWh). Conversely, the ETC solar-thermal system is not economically viable for the sports centre application, and increasing the ETC area share in the combined PV-ETC S-CHP system is unfavourable due to the low natural gas price. Although the PVT S-CHP system has the highest investment cost, the high annual revenue from the avoided energy bills elevates its economic performance to a level between those of the conventional PV and ETC-based S-CHP systems, with a payback time of 13.7 years and a levelised cost of energy of 0.109 €/kWh. However, at 445 tCO2/year, the CO2
emission reduction potential of the PVT S-CHP system is considerably higher (by 40–75%) than those of the all other solar systems (254–317 tCO2/year). Compared to the solar energy systems, the ICE-CHP system has the
shortest payback time (6.2 years), but its CO2emission reduction (25 tCO2/year) is significantly lower. A high
carbon price is beneficial for improving the cost-competitiveness of the solar energy systems, in particular the PVT S-CHP system, which would further boost its market penetration, helping to meet the carbon emission targets.
https://doi.org/10.1016/j.apenergy.2019.113657
Received 31 January 2019; Received in revised form 31 July 2019; Accepted 1 August 2019
⁎Corresponding author.
E-mail addresses:[email protected](K. Wang),[email protected](M. Herrando),[email protected](A.M. Pantaleo), [email protected](C.N. Markides).
0306-2619/ © 2019 Elsevier Ltd. All rights reserved.
1. Introduction
Renewable energy has surpassed fossil fuels as the main driver of global power capacity growth since 2015, currently accounting for more than 50% of new installations[1], with distributed solar-energy systems[2]and in particular photovoltaic (PV) technology expected to continue to dominate the grown of this market in the short term. Apart from power generation by PV panels, solar energy can be harvested effectively as heat for heating purposes via low-temperature solar thermal technologies, such as evacuated tube collectors (ETC)[3–5]. Hybrid PV-thermal (PVT) collectors combine PV cells and (relatively) low-temperature solar thermal collectors into one integrated compo-nent, promising a higher energy output than side-by-side PV and solar thermal technologies, as both heat and electricity are generated from the same aperture area[6,7]. Among the above solar technologies, PV and solar thermal technologies are both relatively well established in terms of technology maturity, cost and market penetration.
PV has experienced exponential growth in installed capacity to-gether with a dramatic reduction in costs over the past ten years. In 2018, PV generated about 570 TWh of electricity, representing around 2% of the world’s total electricity generation[8]. The global weighted-average levelised cost of electricity from utility-scale PV projects in 2018 reached 0.085 $/kWh, which was 77% lower than the equivalent figure for 2010 [9]. Apart from utility-scale PV systems, small-scale distributed PV systems for domestic and commercial use have also seen significant growth in recent years due to the continuous cost reduction and attractive economic returns under net-metering or feed-in-tariff schemes[10]. As multiple types of energy needs (i.e., cooling, heating and power) are required for most built environments, PV power systems are often integrated with other technologies (conversion, storage, etc.)
to form wider solar energy systems and to meet the whole energy needs of target end-users. Heat pumps have been widely considered for in-tegrating with PV systems for heating and cooling purposes (by switching their operational mode)[11,12]. In particular, there has been an interest in ground-source heat pumps due to their good performance, which is less susceptible to the ambient conditions, their low environ-mental impact, as well as good adaptability to and integration with a variety of renewable energy sources [13]. Different control strategy [14], thermal storage[15]and battery storage[16]options were ex-amined in such systems to maximize the solar contribution to the en-ergy demands and to lower the greenhouse gas emissions.
Solar thermal was the leading renewable energy in terms of cu-mulated installed capacity in operation for many years until 2016 when wind energy started to take the lead[17]. Although solar thermal is predominated by small-scale individual systems for domestic water heating [3], large-scale solar thermal plants connected to district heating networks or to large buildings have been expanding[18], and interest of using solar thermal in industrial applications is also growing [19]. The solar thermal technologies of interest mainly include flat plate collectors (FPCs) [20], ETCs [21], parabolic trough collectors (PTCs) [22], and compound parabolic collectors (CPCs)[23]. Many researchers proposed to integrate heat-to-power conversion units with solar thermal collectors to form wider solar combined heat and power (S-CHP) systems[24]. Organic Rankine cycles[25]and super-critical CO2power cycles[26]have been considered as the appropriate
heat-to-power conversion technologies for S-CHP applications. The hybridisa-tion of solar thermal energy with other renewable energy sources such as biomass, in order to increase flexibility of operation and heat to power capabilities was also proposed in previous studies[27,28].
Compared to PV and solar thermal technologies, PVT collector is Nomenclature
cel electricity purchase price, €/kWh
cng natural gas price, €/kWh
cCO2 carbon price, €/kgCO2
C0 investment cost, €
Cfuel fuel cost, €/kWh
CO&M operation and maintenance costs, €
Cs annual cost saving, €
d discount rate
Ecov electricity demand covered, kWh
Edem electricity demand, kWh
Eexc excess electricity exported to grid, kWh
EPCS environmental penalty cost saving, €
ERel emission reduction from electricity, tCO2/year
ERng emission reduction from natural gas, tCO2/year
ERtot total emission reduction, tCO2/year
fng CO2emission factor of natural gas, kgCO2/kWh
fel CO2emission factor of electricity, kgCO2/kWh
G total solar irradiance, W/m2
iF inflation rate
LCOE levelised cost of energy, €/kWh
LCOEel levelised cost of electricity, €/kWh
LCOEeq.el levelised cost of equivalent electricity, €/kWh
LCOEth levelised cost of heat, €/kWh
LCS life cycle cost saving, €
n lifetime, year
Q net annual production of energy, kWh
Qcov thermal demand covered, kWh
Qdem thermal demand, kWh
QSH,dem thermal demand of space heating, kWh
QSP&HW,dem thermal demand of swimming pool heating and hot
water, kWh
sel electricity selling price, €/kWh
PBT payback time, year
Ta ambient temperature, °C
Tfm mean fluid temperature, °C
TPV PV cell operating temperature, °C
Tr reduced temperature, °C
TSH,dem required water temperature for space heating, °C
TSH,tanko delivered water temperature for space heating, °C
TSP&HW,dem required water temperature for swimming pool heating
and hot water, °C
TSP&HW,tanko delivered water temperature for swimming pool
heating and hot water, °C
TCS total cost saving, €
Vt tank volume, L
boil boiler efficiency el electrical efficiency
ref reference electrical efficiency th thermal efficiency
temperature coefficient, 1/K
Abbreviations
CHP combined heat and power CPC compound parabolic collector ETC evacuated tube collector FPC flat plate collector ICE internal combustion engine ORC organic Rankine cycle PTC parabolic trough collector PV photovoltaic
PVT hybrid photovoltaic-thermal S-CHP solar combined heat and power
still an emerging solar technology with a small market[29]. Unlike PV and solar thermal collectors which inherently generate only a single form of energy (heat or electricity) and need be integrated with other energy conversion technologies for CHP applications, PVT collectors can provide both heat and electricity by nature, making them highly suitable for matching multi-vector energy needs of end-users. In-creasing interest has thus been drawn into this field recently. While various modelling tools[30,31] have been developed for the system design and performance prediction of PVT systems, many studies were focused on technoeconomic assessments of PVT-based CHP systems for specific applications, such as residential buildings [32], university campuses [33], dairy farms [34], etc. The results showed that with appropriate installation area and system operation strategy, PVT sys-tems can cover a significant amount of energy demand with a reason-able payback time. To improve the thermal performance of PVT col-lectors, some researchers proposed to use flat-box structure [35] or microchannels [36]as alternative absorber-exchanger designs to the conventional sheet-and-tube type, while others considered using na-nofluids[37]or heat pipe[38]for heat transfer enhancement. More recently, studies have shown that employing advanced emissivity control techniques[39]and spectral splitting concepts[40]into PVT collector designs emerge as promising directions for performance breakthrough.
Since each solar technology has its own unique features and po-tentials, the selection of the most appropriate technology for a specific application is not always straightforward. This choice depends not only on the capability of the technology in meeting the energy demand of specific applications but, more importantly, on the cost-competitiveness in comparison to other alternative solar technologies, as well as con-ventional energy solutions[41]. Apart from the energetic and economic benefits, the environmental impact of energy provision is becoming a vital factor in the assessment of renewable energy technologies, espe-cially under the growing pressure for decarbonisation[42].
Existing technoeconomic comparisons of solar energy systems for cooling, heating and/or power provision in the literature have been focused predominantly on the well-established solar technologies, i.e., PV, solar thermal collectors or side-by-side installations of these two. In Ref. [12], thermoeconomic comparisons of three solar-assisted heat pump systems in near-zero energy buildings were performed, using PV panels, flat-plate solar collectors, or a side-by-side combination of the two. It was concluded that a PV-assisted heat pump system was the most effective system in terms of energy and economic performance for the specified application. Other researchers[43]conducted life-cycle impact comparisons of PV and solar thermal technologies for industrial heating applications in 12 locations around the world. The results in-dicated that solar-thermal systems based on linear Fresnel collectors outperform PV-driven heat-pump systems in high-irradiance locations in terms of embodied energy payback time. A further study from the same authors[44]showed that hybridisation of PV and solar thermal technologies in a side-by-side configuration can improve the energy performance, the levelised cost of energy and the environmental pay-back time compared to standalone PV and solar thermal systems. Ref. [45]compared PV and solar thermal options with conventional energy systems for space heating and cooling in buildings. It was found that the solar system based on PV and reversible heat pump has the lowest le-velised cost of energy, but it also highlighted that since the system performance depends on multiple factors (building envelope, load patterns, solar radiation, roof area, energy prices, and policies), case-by-case analyses are required for specific locations and applications. Another thermoeconomic comparison between PV driven compression chillers and solar thermal driven sorption chillers indicated that the economic metrics of the two options are very close[46]. However, a similar study from Ref.[47]concluded that PV-based cooling systems are always more advantageous in office building applications if re-muneration is available for excess PV electricity.
As an emerging solar technology, comparisons of PVT systems with
other alternative solar energy systems from multi-perspectives (energy, economic and environmental) were relatively scarce, while the focus of most available work was primarily placed on thermodynamic assess-ments. In Ref.[48], a comparative study of the thermal and electrical performance between PV panels, unglazed and glazed PVT-air collec-tors was performed based on a thermal-electrical model. The authors concluded that the glazed double-pass PVT-air collector shows the highest overall efficiency and energy output. Another exergy analysis [49]showed that with identical installation area, PVT systems are su-perior in exergy efficiency to either PV-only systems or side-by-side PV and solar thermal systems in three representative climates in the US. Other investigators [50]tested and compared the performance of a commercial PVT system and a simple PV system. It was observed that the PVT system was able to reach an overall efficiency of 80–85% when operated over the span of a full day under clear and sunny days in Jaén, Spain. In Ref.[51], an existing PV panel was retrofitted into a PVT collector and a parallel comparative investigation of these two systems was conducted through laboratory and field experiments. The results showed that the PVT collector could enhance the electric yield of the PV panel by nearly 3.5% and increase the total energy output by more than three times. Energy performance simulations and comparisons of PVT systems, PV systems, solar-thermal systems and their hybridised sys-tems for a net zero energy building were also conducted in previous work[52]. The results suggested that the building with only PV systems was the closest to reach a near zero balance, and the second-best option was the system consisting of both PV and solar-thermal systems. Ref. [53]compared the operational effectiveness of ETCs, PTCs, PVT col-lectors, and their integrations with PV or organic Rankine cycle (ORC) systems and concluded that the PVT system was more effective than a solar-driven ORC system for low-temperature cogeneration applica-tions.
The literature review shows that earlier work on the comparisons of solar energy systems for cooling, heating and/or power provision have been mostly focused on well-established solar technologies (i.e., PV, solar thermal collectors), while less work has involved PVT collectors. Existing work on the comparison of PVT systems with other alternative energy solutions was restricted to only thermodynamic modelling and energy performance characterisation, while economic and environ-mental aspects were rarely considered, making it difficult to fully un-derstand the competitiveness of this emerging technology. Besides, the findings from the existing comparative studies of PV, solar thermal and their hybridisations are not always consistent and sometime even conflicting, implying the complexity of such solar energy systems. As there are diverse options for meeting the energy demands, i.e., both fossil-fuel based conventional and solar or other renewable energy so-lutions, comprehensive assessments of the available competing tech-nology options are of great importance for techtech-nology selection and system design and are a long-standing interest of the relevant re-searchers, developers, end-users and other stakeholders.
To this end, a holistic and fair comparison of the PVT systems with other competing solar or conventional energy systems from multiple perspectives, including energy performance, economic benefit and en-vironmental impact, is highly required, which, however, is still lacking from previous work. This paper aims to fill this knowledge gap and to provide a comprehensive assessment of the energy, economic and en-vironmental potentials of both established and emerging solar energy systems as well as fossil-fuel based conventional solutions for heat and power provision. In particular, a PVT-based solar combined heat and power (S-CHP) system is compared with three alternative solar systems, including a PV-based solar-power system, an ETC-based solar-thermal system, and the combination of PV and ETC (PV-ETC) with different shares of the installation area. A CHP system based on an internal combustion engine (ICE) prime mover fuelled by natural gas is also assessed, as a conventional competing technology. Systems’ parameters and details as well as transient models of the above energy systems are first introduced, followed by the description of the methodologies used
for the economic and environmental assessments. The proposed systems are then compared in a specific application for covering the demands of swimming pool heating, hot water, space heating and electricity in the University Sports Centre of Bari, Italy.
2. Methodology
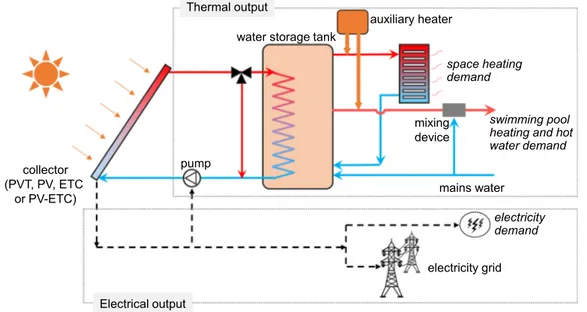
Five types of heating and/or power systems are investigated and compared in the present work, including: (i) a PVT S-CHP system, (ii) a PV solar-power system, (iii) an ETC solar-thermal system, (iv) com-bined PV-ETC S-CHP systems, and (v) an ICE-CHP system. Natural gas and electricity from the grid are used as the backup sources for meeting (respectively) the heat and power demands that cannot be covered by the aforementioned systems. Any surplus electricity from the energy systems is fed into the grid. The four solar-based energy systems are modelled in TRNSYS, which is a modelling platform widely used in solar energy system modelling[32,54,55]. The systems models are built by connecting each component model using the same logics and mass/ energy/information flows as the schematic shown inFig. 1. Detailed information about the TRNSYS models can be found in the TRNSYS Mathematical Reference[56]. The installation areas of the solar col-lectors are kept constant for the different system configurations, since roof-space availability is a major constraint in the considered applica-tion. Hourly transient simulations are conducted over a year using local weather and measured energy demand data. The weather data is gen-erated using Meteonorm in TRNSYS. The energy performance of the ICE-CHP system is evaluated using a thermal-load-following opera-tional strategy to match the transient profile of the thermal demand. The economic performance is estimated in terms of life cycle cost saving, payback time and levelised cost of energy, considering the in-vestment costs, operation and maintenance costs and the cost savings due to the reduced fuel and electricity consumptions. Environmental benefits are evaluated considering the avoided CO2emissions and the
environmental penalty cost savings due to the emission reductions. To ensure a fair and consistent comparison, the technoeconomic potentials of all the systems are evaluated based on the same local weather data, demand profiles, economic and environmental metrics.
2.1. PVT S-CHP system
The PVT S-CHP system is shown inFig. 1. The thermal output of the
PVT-water collectors is stored in a water storage tank via a heat transfer loop. The stored energy is extracted and upgraded to the required temperature by existing gas boilers if necessary. The electrical output of the PVT collectors is used to cover the electricity demand and the surplus is injected to the grid by net metering, i.e., electricity is taken from the grid when the demand exceeds the solar generation.
Polycarbonate flat-box PVT collectors with 3 × 2 mm rectangular channels as the absorber-exchanger design, proposed by the authors [35,57], are considered here because of the improved heat transfer performance and cost-effectiveness, compared to conventional copper sheet-and-tube PVT collectors. The PVT collector comprises (from top to bottom) a transparent glass cover, an insulating gas layer, a multi-crystalline silicon PV module, an Ethylene-Vinyl Acetate (EVA) en-capsulating film, an absorber-exchanger and an insulation layer[35]. The collector has a nominal electric power output of 240 Wpwith an
aperture area of 1.55 m2. The PV electrical efficiency (
el) decreases linearly with the cell operating temperature (TPV) as per[58–60],
= ·[1+ ·(T T )]
el ref PV ref (1)
where ref is the reference PV electrical efficiency (14.7%) at a cell temperature of 25 °C and a solar irradiance of 1000 W/m2, and is the
temperature coefficient (−0.45%/K). A modified Type 560 is used to model the PVT collectors in TRNSYS to include the above electrical characteristics and also to match the thermal efficiency ( th) curve[35],
=0.726 3.325·T 0.0176· ·G T th r r2 (2) = T T T G r fm a (3)
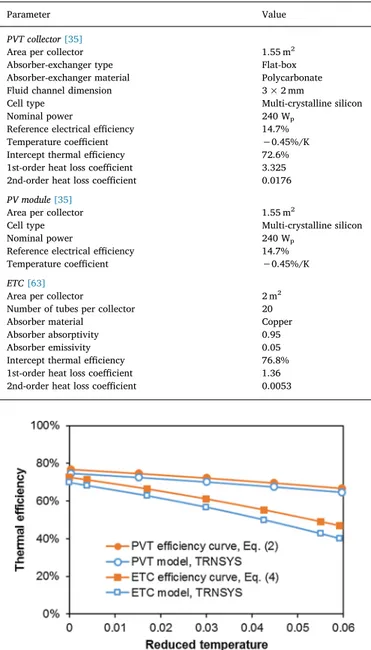
where G is the total solar irradiance,Tfm,Taand Tr are the mean fluid temperature in the collector, the ambient temperature and the reduced temperature, respectively. The main technical specifications of the PVT collector are given inTable 1. The comparison of the thermal efficiency obtained from the modified Type 560 model and the thermal efficiency curve (Eq.(2)) for the considered collector is shown inFig. 2, which shows that the thermal performance characteristics are well captured by the model, with a relative deviation of 2.6–6.7%.
A stratified water storage tank (Type 534 in TRNSYS) is used for thermal energy storage, with 6 nodes along its vertical axis to take account of the temperature stratification effect[61]. Depending on the temperature requirement for a specific thermal demand, the ports for extracting and returning water are allocated to appropriate nodes of the
collector (PVT, PV, ETC
or PV-ETC)
pump
water storage tank
auxiliary heater
space heating demand
swimming pool heating and hot water demand mains water mixing device electricity demand electricity grid Thermal output Electrical output
Fig. 1. Schematic of solar-based heating and/or power systems. There is only electrical output if PV panels are used, and only thermal output if ETCs are used. There are both electrical and thermal outputs when PVT collectors or the combined PV-ETC are used.
tank to match the temperatures. The capacity of the water storage tank is sized according to the installation area of the collectors by using a ratio of 50 L per unit area of collectors based on previous work[57,62]. Auxiliary gas boilers are used to heat up the water if the temperature of the hot water from the tank is lower than the required one.
2.2. PV solar-power system
PV panels have experienced a dramatic price drop in the past decade (> 70% since 2010) and are now the fastest-growing renewable energy technology. A PV solar-power system is assessed here as an established solar technology for comparison purposes. Unlike the PVT S-CHP system described inSection 2.1, which generates both electricity and useful thermal energy, PV systems only provide electricity, as shown by the block denoted with electrical output inFig. 1. As with the operation strategy of the PVT S-CHP system, the electricity generated by the PV panels is directly used to cover the electricity demand, and any surplus is exported to the electricity grid. Electricity is bought from the grid
when the demand exceeds generation. The electrical parameters (see Table 1) and installation area of the PV panels are the same as for the PVT collectors. In this case, the thermal demand is completely met by natural gas through gas boilers.
2.3. ETC solar-thermal system
ETCs are the predominant solar thermal collector technology and can provide thermal energy at a higher temperature compared to FPCs [17]. The layout of the ETC solar-thermal system is the same as the part of the thermal output inFig. 1. The water storage tank is the same as for the PVT S-CHP system described in Section 2.1. The commercially available ETC “Thermomax DF-400” is selected and modelled using Type 71 in TRNSYS. Each ETC has 20 evacuated tubes with an absorber area of 2 m2. The overall dimension of each ETC is 1.95 × 1.42 m.
Copper sheet with a selective coating (absorptivity = 0.95, emis-sivity = 0.05) is used as the absorber material. The thermal efficiency curve of the ETC is expressed as[63],
=0.768 1.36·T 0.0053· ·G T
th r r2 (4)
The thermal efficiency calculated by the Type 71 collector model used in this work and the above efficiency curve are given inFig. 2. The relative deviation is observed as around 2–3%. The technical specifi-cations of the ETC design are listed inTable 1.
As only thermal energy can be supplied by the ETC system, the electricity demand in this case is satisfied by the grid.
2.4. Combined PV-ETC S-CHP system
An alternative solution for generating both electricity and thermal energy from the given area is to install both (separate) PV panels and ETC collectors. Therefore, combined PV-ETC S-CHP systems are also assessed. The system layout and the operation strategy are the same as the PVT S-CHP system, as shown inFig. 1. The difference is that the electricity and thermal energy are generated separately from the side-by-side PV panels and ETC collectors respectively in the combined PV-ETC S-CHP systems. Same as the other cases, natural gas and grid electricity are used as the backup energy sources and any excess elec-tricity is exported to the grid. The total cumulated area of the PV panels and ETC collectors is kept equal to the other solar-based systems, but with different allocations for power and heat generations. Three sets of the allocated areas are considered, namely 25%-75%, 50%-50% and 75%-25% of the total installation area for PV panels and ETC collectors respectively. Hence, the PV and ETC systems, as described inSections 2.2 and 2.3respectively, can be regarded as two extreme cases of the combined PV-ETC S-CHP system with the percentages of 100%-0% and 0%-100% respectively. The water tank volume is sized based on the ETC area using the same ratio of 50 L/m2as other systems.
2.5. ICE-CHP system
ICEs are the most mature and predominant CHP prime-mover technology, accounting for ~70% of the total annual sales[64]. In this work, a natural-gas-fired ICE-CHP system is considered as a competing conventional solution. When considering the available products on the market, the ICE is selected on the basis of cost and performance, and sized according to the energy demand to ensure that the generated electricity is mainly used for meeting the on-site demand. Here, a commercial ICE-CHP system (TEMA® 100) supplied by Energifera with a rated power of 165 kWt/85 kWeis used for the Sports Centre
appli-cation as described inSection 3. The ICE-CHP system has six opera-tional modes, as shown inTable 2. A constant thermal efficiency of 56.8% with a variable electrical efficiency that depends on the opera-tional characteristics of the ICE-CHP system is assumed, based on the technical specifications provided by the supplier. The ICE-CHP system Table 1
Main technical specifications of the PVT collector, PV module and ETC.
Parameter Value
PVT collector[35]
Area per collector 1.55 m2
Absorber-exchanger type Flat-box
Absorber-exchanger material Polycarbonate
Fluid channel dimension 3 × 2 mm
Cell type Multi-crystalline silicon
Nominal power 240 Wp
Reference electrical efficiency 14.7%
Temperature coefficient −0.45%/K
Intercept thermal efficiency 72.6%
1st-order heat loss coefficient 3.325 2nd-order heat loss coefficient 0.0176 PV module[35]
Area per collector 1.55 m2
Cell type Multi-crystalline silicon
Nominal power 240 Wp
Reference electrical efficiency 14.7%
Temperature coefficient −0.45%/K
ETC[63]
Area per collector 2 m2
Number of tubes per collector 20
Absorber material Copper
Absorber absorptivity 0.95
Absorber emissivity 0.05
Intercept thermal efficiency 76.8%
1st-order heat loss coefficient 1.36 2nd-order heat loss coefficient 0.0053
Fig. 2. Thermal efficiencies obtained by the PVT and ETC collector models and the relevant efficiency curves given by Eqs.(2) and (4).
is operated based on the thermal-load-following operational strategy by switching its operation mode according to the profile of thermal de-mand, and thus no water tank is considered in this case. The generated electricity is used to cover the electricity demand and any surplus is exported to the grid. As in the other cases, heat from gas boilers and electricity from the grid are used as backup sources.
2.6. Economic analysis
The economic analysis conducted here is based on multiple in-dicators, including the life cycle cost saving (LCS), payback time (PBT) and levelised cost of energy (LCOE) of the systems, while considering each system’s investment cost, operation and maintenance costs, and cost savings due to the reduced natural gas and electricity bills required to satisfy the energy demand of the application.
The life cycle cost saving, LCS, is defined as the present value of the total energy cost savings over the lifetime, n, of each system,
= + + LCS C d i i d C 1 1 1 n s F F 0 (5) where d is the discount rate, iFrefers to the inflation rate considered for
the annual fuel savings, andC0is the investment cost. The annual cost saving, Cs, is estimated by,
= + +
Cs Ecov el·c Eexc el·s Qcovc C
boiler ng O & M (6)
where Ecovand Qcovare the electrical and thermal demands covered by
the system, Eexcthe electricity exported to the grid via net metering, cel
and cngthe electricity and natural gas prices respectively, ηboilthe boiler
efficiency, selthe electricity price for the net metering option applicable
to the system, andCO & Mthe operation and maintenance costs. The payback time, PBT, is calculated from[65],
= + + +
( )
PBT ln 1 ln C i d C i d ( ) 1 1 0 F s F (7) The levelised cost of energy, LCOE, is obtained by,= + + + + = = LCOE C C i d Q d (1 ) (1 ) (1 ) i n i i i n i 0 1 O & M F 1 1 (8)
where Q is the net annual production of energy in the form of electricity or heat,C0 andCO & Mcorresponds to the costs related to the energy production. Both the levelised cost of electricity, LCOEel, and the le-velised cost of heat, LCOEth, are assessed. For the PV solar-power system, only LCOEelis used since there is no thermal energy output. Conversely, the ETC solar-thermal system only involves LCOEth. For the combined PV-ETC S-CHP system, LCOEel and LCOEth are calculated independently based on the costs and energy productions of the PV and ETC subsystems, respectively. In the case of PVT S-CHP and ICE-CHP systems, the allocation of the costs to heat and electricity is based on the contributions to the total bill savings from the thermal and elec-trical outputs. Beyond that, the levelised cost of total energy is also assessed in the form of equivalent electricity, LCOEeq.el, which is the sum of the actual electricity output and the equivalent electricity con-verted from the thermal energy output. A conversion factor of 0.55 is used from thermal energy to electricity, which corresponds to the ty-pical efficiency of a modern natural gas power plant[66].
The investment costs are estimated from price lists available from solar retailers in the EU (VAT included). The main investment costs of the PVT S-CHP system and ETC solar-thermal system include the collectors, water storage tanks, hydraulic components and system installation costs. The total investment costs of the PV solar-power system and of the ICE-CHP system are provided by the relevant suppliers as whole packages for the sports centre application mentioned inSection 3. In particular, the PV price is between the average figures for commercial-scale and utility-scale PV pro-jects in Italy[9]. The investment cost for the combined PV-ETC S-CHP system is estimated by combining the independent costs of the PV and ETC subsystems. The detailed cost breakdowns are summarised inTable 3. The operation and maintenance costs per year are estimated as 1% of the total investment cost for the PVT S-CHP system, the ETC solar-thermal system and the combined PV-ETC S-CHP system. For the ICE-CHP system, the operation and maintenance costs are calculated by adding the fuel cost for running the ICE (Cfuel) to 1% of the total investment cost. In all cases, the auxiliary heater cost is not considered as it is assumed that gas-fired boilers have already been installed.
Table 2
Operational modes of the ICE-CHP system considered in the present work. Operational
mode Thermalpower [kWt]
Electric power [kWe]
Thermal
efficiency Electricalefficiency
Mode 1 185 101 56.8% 30.9% Mode 2 165 85 56.8% 29.4% Mode 3 139 68 56.8% 27.8% Mode 4 98 45 56.8% 26.3% Mode 5 63 27 56.8% 24.7% Mode 6 32 13 56.8% 23.2% Table 3
Cost breakdowns of the heating and/or power systems.
System Component Value Unit Reference or comments
PVT S-CHP system PVT collector 301 €/collector [35]
Hydraulic components 375 €/set [57]
Expansion vessel 140 €/set [57]
Water storage tank 0.874·Vt(l) + 763.5 € [57]
Pipes 11 €/m [57]
Heat transfer fluid 3.3 €/L [57]
Mounting 59 €/collector [57]
System installation 40 €/m2 Estimation based on the information provided by suppliers
CO & M 0.01·C0 € [29]
ETC solar-thermal system* ETC collector 150 €/m2 [67]
Mounting 47.2 €/collector [57]and estimation
System installation 24 €/m2 Estimation based on the information provided by suppliers
CO & M 0.01·C0 € [29]
PV solar-power system C0 950 €/kWp Provided by the PV supplier
CO & M 15 €/kWp
ICE-CHP system C0 328 k€ Provided by the ICE supplier
CO & M 0.01·C0+Cfuel k€
2.7. Environmental analysis
The environmental benefit, especially the potential for CO2emission
reduction, has been one of the main driving forces for the increasing interest in and the market growth of renewable energy technologies. Momentum is growing among countries to place a price on carbon pollution as a means of bringing down emissions and shifting invest-ments into cleaner options. To date, more than 50 countries or regions have already used carbon pricing mechanisms, with more planning to implement them in the future[68].
In this regard, the annual reduction of CO2emission by using the
proposed systems is assessed based on the CO2 emission factors of
natural gas and electricity, fngandfel,
= ERng Qcov ·f boiler ng (9) = + ERel (Ecov Eexc)·fel (10) = + ERtot ERng ERel (11)
whereERngand ERelare the emission reductions due to the displaced natural gas and electricity respectively, and ERtot is the total emission reduction.
The total environmental penalty cost saving, EPCS, over its lifetime due to the reduction of carbon emission is estimated by,
= + + EPCS ER c d i i d · 1 1 1 n tot CO F F 2 (12) where the cost of unit CO2emission,cCO2, varies from 120 €/tCO2to
below 1 €/tCO2depending on the countries and regions[68]. The total
cost saving, TCS, due to the avoided energy bill and environmental penalty cost is used to evaluate the overall economic and environmental potential of the proposed systems,
= +
TCS EPCS Cs (13)
3. Case study
The University Sports Centre of Bari in Italy is selected as an ap-plication for the proposed solar-energy systems. A layout of the sports centre is shown inFig. 3, with roof areas shadowed in red. All the solar energy systems are based on the same installation area of 4000 m2. This
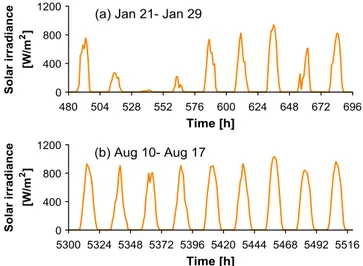
value corresponds to the maximum available roof area of the sports centre. The yearly solar radiation in Bari is about 1700 kWh/m2. The
solar irradiance in clear summer days can go up to 900–1000 W/m2,
while it is less stable in winter days, as shown inFig. 4.
The thermal demands of the swimming pool, hot water and space heating in the University Sports Centre are currently covered by natural gas boilers with an annual consumption of around 175,000 Sm3 of
natural gas. The water delivery temperatures for the swimming pool and hot water are both 55 °C, while it is 70 °C for space heating using radiators. Apart from the thermal demands, the sports centre has an
Fig. 3. Layout of the University Sports Centre of Bari with available roof areas shadowed in red.
Fig. 4. Solar irradiance in typical winter and summer periods in Bari, Italy: (a) 21st − 29th Jan., and (b) 10th − 17th Aug.
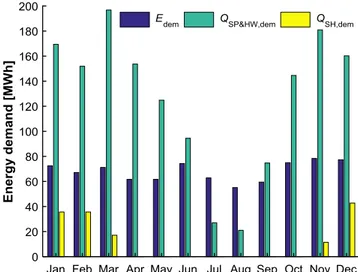
annual electricity demand of 814 MWh. Fig. 5 shows the measured monthly thermal and electricity demands. Quarter-hourly data are available for the electricity demand of the sports centre, which are aggregated into hourly electricity consumption for the simulations. A flat profile from 8 am to 9 pm is assumed to estimate the space heating demand based on the available monthly gas consumption data using a boiler efficiency of 82%. Similarly, a flat profile from 7 am to 9 pm is assumed for the thermal demand for the swimming pool. Hot water demand is required from 12 pm to 10 pm, with an estimated profile proportional to the number of users in the sports centre.
Same hourly weather conditions (solar irradiance, ambient tem-perature, wind speed, etc.) and energy demands (thermal demands for space heating, swimming pool and hot water heating, profiles of elec-tricity demand) are given as inputs for the transient simulations for all cases. A summary of the simulated cases for the application in the University Sports Centre of Bari are listed inTable 4. The economic and environmental parameters are kept the same for all cases, as given in Table 5. The values of the electricity and natural gas prices correspond to the current tariffs for the sports centre. The electricity surplus is assumed to be injected to the grid through the net metering option with half of the total price of electricity[69]. The efficiency of the boiler is estimated from the operational data of the boiler in the sports centre. As there is no explicit carbon tax in Italy yet, the typical range of the carbon prices in Europe (i.e., 0.02–0.12 €/kgCO2) are used to assess the
possible ranges of environmental benefits. The total initial investment costs for the PVT S-CHP system, the PV solar-power system, the ETC solar-thermal system and the ICE-CHP system are 1.50 M€, 0.73 M€, 1.12 M€ and 0.33 M€, respectively.
4. Results and discussion
4.1. Transient operation
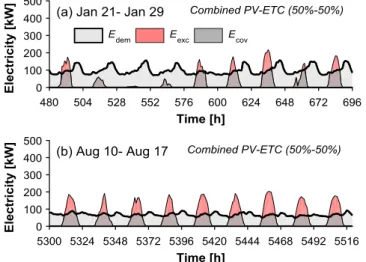
Hourly transient simulations are performed over a year to assess and compare the performance of the proposed energy systems for the ap-plication of the University Sports Centre in Bari (Italy).Figs. 6–9show the electricity demand of the sports centre, the covered and excess electricity of the PVT, PV, combined PV-ETC (50%-50%) and ICE sys-tems respectively in two representative periods of the year, i.e., 9 days in January and in August. The corresponding solar irradiance is given in Fig. 4. It can be observed from the results inFig. 6that the PVT S-CHP system generates considerably more electricity than the sports centre demand during daytime when the solar irradiance is high. The excess electricity, which accounts for more than half of the total generation, is fed into the grid using the net metering option. When the generated electricity is not sufficient to cover all the demand at low or no solar irradiance conditions, electricity from the grid is used to fill the gap. As expected, more electricity is generated in August than that in January by the PVT S-CHP system (due to higher irradiance and sunnier days as shown inFig. 4), which allows the system to cover most of the daytime demand. As shown inFig. 7, the results of the PV solar-power system show similar trends to those of the PVT S-CHP system. No noticeable difference is observed in the electricity coverage between the PV and PVT systems, as shown by the shadowed areas denoted with Ecov.
However, there is more excess electricity generated by the PV system, which is exported to the grid especially in the summer period when the solar irradiance is high. This is attributed to the lower electrical effi-ciency of the PVT system due its design, but also the higher operating temperatures of the solar cells when generating a higher-temperature thermal output. As the roof area is halved between PV panels and ETCs in the combined PV-ETC (50%-50%) S-CHP system, the total electricity generation is half of that in the PV solar-power system, but it is still sufficient to cover the demand during most of the daytimes with some excess (seeFig. 8). As shown inFig. 9(a), the ICE-CHP system covers the largest amount of electricity demand compared to all solar-based sys-tems in January. It satisfies the baseload of the electricity demand with
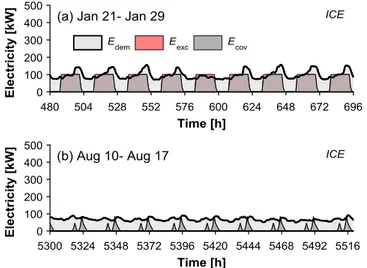
little excess, which can be beneficial for the profitability of these sys-tems as the price of the exported electricity is less than that of displaced on-site consumption. Less electricity is generated in August by the ICE-CHP system (seeFig. 9(b)), as it is operated in a low power mode (see Table 2) to follow the low thermal demand in the summer period through the thermal-load-following operational strategy.
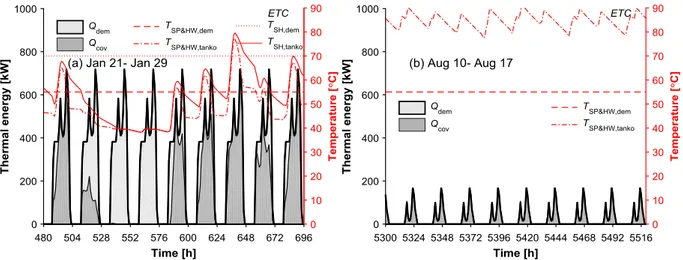
The thermal energy demands covered by the PVT, ETC, combined PV-ETC and ICE systems for space heating, swimming pool heating and hot water provision purposes are shown inFigs. 10–13, respectively. In the three solar-based systems, the temperatures of the outlet water from the water storage tank in the 21st − 29th of January is much lower than those in 10th − 17th of August, due to the lower solar irradiance in winter and the higher thermal demand. Consequently, auxiliary heating is often required in the winter months to heat the water to the required delivery set-point temperatures (70 °C for space heating, and 55 °C for swimming pool heating and hot water), while in summer the tank outlet temperatures should be cooled down by mixing with mains water to the set-point temperatures. No auxiliary heating is required and all thermal demands are satisfied in August by all of the in-vestigated based systems. Still, the thermal outputs of the solar-based systems in winter allow them to cover considerable amounts of the demand through preheating the water, from which the cost of natural gas consumption is reduced. Comparing the PVT and ETC sys-tems, it is observed that the tank outlet water temperature and thermal energy coverage of the ETC system is noticeably higher than those of the PVT system (seeFigs. 10and11). This is due to the higher thermal efficiency of the ETCs (i.e., compare Eq.(4)and Eq.(2)). Although the ETCs in the combined PV-ETC (50%-50%) S-CHP system cover only half of the total area, the thermal energy covered (seeFig. 12(a)) is not half of that of the ETC solar-thermal system (seeFig. 11(a)), which implies that the thermal output is not linearly proportional to the area. In the ICE-CHP system, the ICE only runs when there is a need for thermal energy by following the thermal demand. As the thermal demand is significantly lower in summer, sizing the ICE purely based on the thermal demand in winter would result in oversizing in summer and influence the system efficiency and profitability. Therefore, the size of the ICE is selected by balancing between the demands in winter and summer, and by considering the size availability of commercial pro-ducts. As shown inFig. 13, the selected ICE is constantly operated in the most-efficient full-power mode (i.e., Mode 1 inTable 2) in January, severing as the base-load source. Similar to the solar-based systems,
Fig. 5. Monthly thermal and electricity demands of the University Sports Centre of Bari. Edem: electricity demand; QSP&HW,dem: thermal demand of
swimming pool heating and hot water; QSH,dem: thermal demand of space
almost all the thermal demand in August can be covered by the ICE-CHP system, by changing its operation mode to match the profile of the thermal demand.
4.2. Monthly and annual results
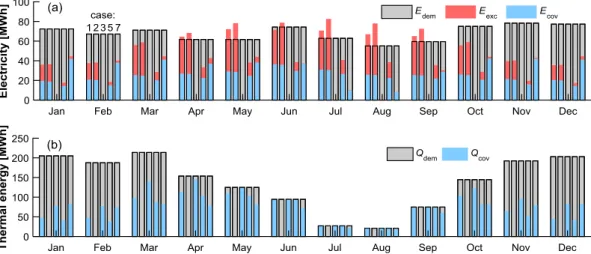
Fig. 14 shows the aggregated monthly demands, coverages and excesses of the electricity and thermal energy for the PVT, PV, ETC, combined PV-ETC (50%-50%) and ICE systems (marked by the corre-sponding case numbers as given inTable 4). It is found that the total electricity generations of the PVT S-CHP system and PV system (Cases 1 and 2 respectively) are around the same as or higher than the demand for half of a year when solar irradiance is high (from April to Sep-tember, inclusive). However, due to the daily profiles of solar energy and electricity demand, less than half of the generated electricity is directly used in the University Sports Centre, while the rest is exported
to the grid, and imported later on with the net metering option. As analysed before, the difference between the electricity generation of the PVT and PV systems is larger in summer due to the lower PV efficiency in the PVT system. The electricity demand covered of the combined PV-ETC (50%-50%) S-CHP system (Case 5) is slightly lower than that of the PVT and PV systems over the year, while its excess electricity is con-siderably lower since the PV area is halved. The ICE-CHP system (Case 7) covers the highest amount of electricity demand in winter months, Table 4
List of the simulated cases.
No. Case Installation area/capacity Capacity of water storage tank
1 PVT S-CHP system 4000 m2 200 m3
2 PV solar-power system 4000 m2 –
3 ETC solar-thermal system 4000 m2 200 m3
4 PV-ETC (75%-25%) S-CHP system (3000 + 1000) = 4000 m2 50 m3
5 PV-ETC (50%-50%) S-CHP system (2000 + 2000) = 4000 m2 100 m3
6 PV-ETC (25%-75%) S-CHP system (1000 + 3000) = 4000 m2 150 m3
7 ICE-CHP system 165 kWt/85 kWe –
Table 5
List of economic and environmental parameters used in the simulations.
Parameter Value
Discount rate, d 5%[70,71]
Inflation rate, iF 1.23%[72]
Electricity purchase price, cel 0.205 €/kWh*
Electricity selling price, sel 0.103 €/kWh[69]
Natural gas price, cng 0.0563 €/kWh*
Efficiency of gas boiler, ηboil 82%*
Life time, n 25 years[29]
CO2emission factor for natural gas, fng 0.206 kgCO2/kWh[73]
CO2emission factor for electricity, fel 0.350 kgCO2/kWh[74]
Cost of unit CO2emission, cCO2 0.02–0.12 €/kgCO2[68,75]
* corresponds to the current value in the University Sports Centre of Bari.
Fig. 6. Electricity demand (Edem), electricity demand covered (Ecov) and excess
electricity exported to the grid (Eexc) by the PVT S-CHP system installed in the
University Sports Centre of Bari: (a) 21st − 29th Jan., and (b) 10th − 17th Aug.
Fig. 7. Electricity demand (Edem), electricity demand covered (Ecov) and excess
electricity exported to the grid (Eexc) by the PV solar-power system installed in
the University Sports Centre of Bari: (a) 21st − 29th Jan., and (b) 10th − 17th Aug.
Fig. 8. Electricity demand (Edem), electricity demand covered (Ecov) and excess
electricity exported to the grid (Eexc) by the combined PV-ETC (50%-50%)
S-CHP system installed in the University Sports Centre of Bari: (a) 21st − 29th Jan., and (b) 10th − 17th Aug.
with little excess electricity exported to the grid over the whole year. The results show that the solar-based systems cover most of the thermal demand from April to October, while auxiliary heating is the dominant source in the rest of the months. In particular, the contribution of solar heating in the PVT, ETC and combined PV-ETC (50%-50%) systems from June to September is up to 100% (Cases 1, 3 and 5 respectively). The annual results of the demands, coverages and excesses of the electricity and thermal energy are shown inFig. 15. The PV system generates the largest amount of electricity, taking up 89% of the total electricity demand. In terms of the thermal energy coverage, the ETC solar-thermal system outperforms the other systems, covering 66% of the total thermal demand. Hybridisations of the PVs and ETCs, i.e., the combined PV-ETC S-CHP systems, provide a solution to generate both electricity and thermal energy. However, none of the above systems are able to compete with the PVT S-CHP system in terms of the total energy yields. Apart from the electricity output which reaches 82.3% of the electricity demand, the PVT system provides an additional thermal output, covering 51.3% of the total thermal demand. The ability of the PVT system to generate both electricity and thermal energy from the same aperture area is particularly attractive for applications where the available roof area is limited, as it is the case in the University Sports
Centre. Due to the variability of solar irradiance, the instantaneous electricity generation covers only around 37% of the electricity demand for the PV and PVT systems, while the rest is exported to the grid and withdrawn at a lower price with the net metering option. Unlike the solar-based systems, the ICE-CHP system covers a considerably higher percentage of the electricity demand with limited electricity exported to the grid, which arises from the baseload electricity generation of the ICE throughout the whole day (in contrast with the daytime generation of the solar-based systems), allowing a better match between electricity generation and demand.
4.3. Economic performance
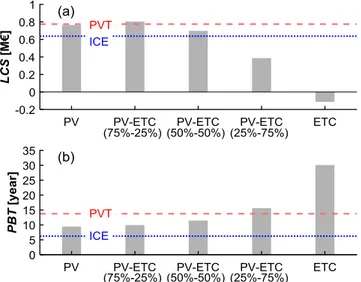
The life cycle savings (LCS) and payback times (PBT) of the in-vestigated systems are shown in Fig. 16. The results indicate that adding more ETCs to the combined PV-ETC system decreases the LCS and remarkably increases the PBT. The LCS of the ETC solar-thermal system is negative, implying it is not profitable within its 25 year life-time. This is due to two main reasons: (i) the investment costs of ETC systems are higher than the PV system, and (ii) natural gas is con-siderably cheaper than electricity, making thermal energy economically less valuable compared to electricity. The combined PV-ETC (75%-25%) S-CHP system has the highest LCS, reaching about 0.80 M€ over its 25 year lifetime. The LCS of the PVT S-CHP is close to that of the PV system (0.77 M€ vs. 0.76 M€), which is remarkably higher than the ICE result (0.64 M€). The shortest PBT (6.2 years) is achieved by the ICE-CHP system, due to its much lower investment cost compared to the other solar-based systems. The PBT of the PV system is the shortest (9.4 years), among the solar-based systems. The limited electricity in-stantaneously covered by the PVT S-CHP system (seeFig. 15(a)) in-fluences the profitability of the investment, because the tariff for the net metering option is only the generation cost component (50%) of the total electricity tariff. The PBT of the PVT S-CHP system is 13.7 years, which is lower than the combined PV-ETC (25%-75%) S-CHP system. An electrical storage system could introduce an electric load following capability for the PVT S-CHP system, reducing the amount of electricity exported through the net metering operation and thus increasing the revenues from avoided cost of electricity supply. However, this would increase system’s complexity as well as the investment costs for the storage system; therefore is not considered in this work. Further in-centives for renewable electricity and heating, and for high efficiency CHP systems, are already available through the White Certificates mechanism in the Italian energy framework, which provides a Fig. 9. Electricity demand (Edem), electricity demand covered (Ecov) and excess
electricity exported to the grid (Eexc) by the ICE-CHP system installed in the
University Sports Centre of Bari: (a) 21st − 29th Jan., and (b) 10th − 17th Aug.
Fig. 10. Thermal demand (Qdem), thermal energy covered (Qcov), required (TSP&HW,dem) and delivered (TSP&HW,tanko) water temperatures for swimming pool heating
and hot water, required (TSH,dem) and delivered (TSH,tanko) water temperatures for space heating by the PVT S-CHP system installed in the University Sports Centre of
Fig. 11. Thermal demand (Qdem), thermal energy covered (Qcov), required (TSP&HW,dem) and delivered (TSP&HW,tanko) water temperatures for swimming pool heating
and hot water, required (TSH,dem) and delivered (TSH,tanko) water temperatures for space heating by the ETC solar-thermal system installed in the University Sports
Centre of Bari: (a) 21st − 29th Jan., and (b) 10th − 17th Aug.
Fig. 12. Thermal demand (Qdem), thermal energy covered (Qcov), required (TSP&HW,dem) and delivered (TSP&HW,tanko) water temperatures for swimming pool heating
and hot water, required (TSH,dem) and delivered (TSH,tanko) water temperatures for space heating by the combined PV-ETC (50%-50%) S-CHP system installed in the
University Sports Centre of Bari: (a) 21st − 29th Jan., and (b) 10th − 17th Aug.
Fig. 13. Thermal energy demand (Qdem) and thermal energy covered (Qcov) by the ICE-CHP system installed in the University Sports Centre of Bari: (a) 21st − 29th
contribution up to 250 €/TOE (ton oil equivalent) saved. These support measures, that are expected to increase the profitability of the solar-based systems proposed here, have not been considered in this assess-ment.
Fig. 17shows the levelised cost of energy in terms of electricity (LCOEel), heat (LCOEth) and total equivalent electricity (LCOEeq.el). As
the investment costs and electricity generated by the PV panels are both linearly proportional to the installation area, the LCOEelof the PV and
PV-ETC systems is the same and it is the lowest among all the cases (0.089 €/kWh). The LCOEelof the PV system in this work is close to the
average value of commercial-scale PV systems in Italy, i.e., around 0.095 €/kWh in 2019 extrapolated using the cost-reduction trend in previous years[9]. The ICE-CHP system has the highest LCOEel, and the
PVT S-CHP system is in between them. In terms of the LCOEth, the
ICE-CHP system outperforms the other systems, closely followed by the PVT S-CHP system. The LCOEth of the ETC solar-thermal system is the
highest (0.085 €/kWh), which is within the reasonable range estimated by a study from Task 52 in the Solar Heating and Cooling Programme of the International Energy Agency (IEA-SHC Task 52) [76]. The
LCOEeq.el, which includes both the electricity and thermal outputs, is
the lowest for the PV system and increases with the percentage of the installed area of ETCs in the combined PV-ETC S-CHP system. Although the PVT S-CHP system requires the highest investment costs, the high annual revenue from the avoided energy bills elevates its LCOEeq.elto a
medium level (0.109 €/kWh) among the solar-based systems. The re-sults show that the ICE-CHP system does not have any advantages over the proposed solar-based systems in the LCOEeq.el, except for the ETC
solar-thermal system.
In summary, the PV solar-power system outperforms all the other solar-based systems considered in this work in the terms of PBT and
LCOE, due to the relatively low cost of the PV panels and considerably
higher electricity price compared to that of natural gas. From an Fig. 14. (a) Monthly electricity demand (Edem), coverage (Ecov) and excess (Eexc) and, (b) monthly thermal demand (Qdem) and thermal energy coverage (Qcov) of the
proposed systems installed in the University Sports Centre of Bari. Case 1: PVT S-CHP system, Case 2: PV system, Case 3: ETC system, Case 5: combined PV-ETC (50%-50%) S-CHP system, Case 7: ICE-CHP system. Case 4 (PV-ETC (75%-25%)) and Case 6 (PV-ETC (25%-75%)) are not shown here for the sake of simplicity.
Fig. 15. (a) Annual electricity demand (Edem), coverage (Ecov) and excess (Eexc) and, (b) annual thermal demand (Qdem) and thermal energy coverage (Qcov) of the
economic perspective, the ETC solar-thermal system is a less promising option and the increase in the fraction of ETCs in the combined PV-ETC S-CHP system is not favourable, due to the relatively high investment cost and the low natural gas price. Currently, the ICE-CHP system ap-pears as the most profitable solution (lowest PBT), although its levelised cost of energy is high. The economic performance of the PVT S-CHP system is at an intermediate level, between those of the other, more mature systems (PV panels, ETCs or their combinations). Considering that the technology and market readiness levels of PVT collectors are much lower than those of PV panels and ETCs, a significant potential for further improvements can be expected in the near future[39].
4.4. Environmental performance
The CO2emission reductions due to avoided consumption of natural
gas and electricity are shown inFig. 18. As expected, the PV solar-power system outperforms the other systems in the emission reduction due to electricity generation (ERel), while the ETC solar-thermal system
has the highest emission reduction by thermal energy (ERth).
Hy-bridisation of PV and ETC shows increased total emission reductions (ERtotin Fig. 18(c)), reaching 317 tCO2/year when the area share is
50%-50%. The total CO2emission reduction of the PVT S-CHP system
(445 tCO2/year) is considerably higher than the other systems, due to
the higher amount of total energy supplied by the PVT system as shown inFig. 15. The total emission reduction of the ICE-CHP system is only 25 tCO2/year, which is more than 10 times lower than the solar-based
systems, inferring the limited environmental benefits of the ICE-CHP system. Increasing the use of solar heating and/or power technologies, in particular the PVT S-CHP system proposed here, would help meeting the EU commitment of 40% carbon emission reductions by 2030.
The emission trading systems and carbon tax that many countries have implemented or scheduled to implement will bring additional costs to energy usage because of CO2emissions[68]. In this regard,
although there is no explicit carbon tax in Italy yet, the environmental penalty cost savings (EPCS) due to the reduced CO2emissions are
as-sessed here, as shown inFig. 19(a). The typical range of the carbon prices in Europe (0.02–0.12 €/kgCO2) are used to assess the potential
range of EPCS, as denoted by the bottom and top error bars for the PV-ETC systems and the shadowed areas for the PVT and ICE systems in Fig. 19. The points and lines correspond to the results calculated using the mid-value carbon price (0.07 €/kgCO2). Similar to the trends of the
total CO2emission reductions inFig. 18(c), the lowest EPCS is for the
ICE-CHP system, and the highest for the PVT S-CHP system in the whole range of the carbon prices. For instance, if the carbon price is set to the high limit (0.12 €/kgCO2), the EPCS reaches 0.82 M€ for the PVT
system whereas for the other systems it amounts to 0.58 M€ at most. If instead the carbon price is 0.02 €/kgCO2, the EPCS is 0.14 M€ vs. <
0.1 M€ for the PVT and the other systems respectively.
The total cost saving (TCS) due to the avoided energy bills and the carbon emission penalty costs, as shown inFig. 19(b), allows a more comprehensive comparison of the total economic benefits of these systems. It is observed that the ETC system remains an economically Fig. 16. (a) Life cycle saving (LCS), and (b) payback time (PBT) of the proposed
systems installed in the University Sports Centre of Bari.
Fig. 17. Levelised cost of energy based on: (a) electricity (LCOEel), (b) thermal
energy (LCOEth), and (c) equivalent electricity of the total energy (LCOEeq.el) of
the proposed systems installed in the University Sports Centre of Bari.
Fig. 18. CO2emission reductions from (a) electricity generation (ERel) and (b)
thermal energy (ERth), and (c) total emission reduction (ERtot) of the proposed
unattractive solution (close to zero or negative TCS value). The TCS of the combined PV-ETC systems reaches the maximum when 75% of the total roof area of the sports centre is covered with PV panels and the rest with ETCs, as denoted by PV-ETC (75%-25%) inFig. 19(b). The PVT system leads all the other proposed systems in TCS in the whole range of carbon price. The TCS is the same for the PVT S-CHP and the combined PV-ETC (75%-25%) S-CHP systems when the carbon price is at its low limit. The differences of TCS of the solar-based systems and the ICE-CHP system become smaller when reducing the carbon price, which would make the solar-based systems a less attractive alternative to conventional systems. This suggests that a high carbon price is beneficial for improving the cost-competitiveness of the solar-based systems, in particular the PVT S-CHP system, which would further boost its market penetration, helping to meet the carbon emission targets. 5. Conclusion
Four types of solar-based combined heat and/or power (S-CHP) systems have been studied and compared comprehensively from en-ergetic, economic and environmental perspectives, namely: (i) a PVT S-CHP system, (ii) a PV solar-power system, (iii) an ETC solar-thermal system, and (iv) combined PV-ETC S-CHP systems with different area shares for the PV panel and ETC sub-sections. A conventional CHP system with a natural-gas powered internal combustion engine (ICE) prime mover has also been assessed as a reference competing fossil-fuel based solution. The University Sports Centre of Bari (Italy), with known demands for electricity, swimming pool heating, hot water and space heating, has been selected as a case study for the detailed comparison of the performance of these systems over an entire annual period of op-eration.
The energetic assessments show that, based on a total installation area of 4000 m2in all cases, the systems can cover most of the sports
centre’s thermal demand from April to October. In particular, the contribution of solar heating in the PVT, ETC and combined PV-ETC (50%-50%) based systems from June to September can be up to 100% of the total demand. The PVT S-CHP system outperforms the other al-ternatives in terms of total energy output, covering 82.3% of the elec-tricity demand and 51.3% of the thermal demand of the sports centre. The PV system outperforms the rest of the investigated solutions in terms of PBT and LCOE, due to the relatively low cost of the PV panels and the high revenue from electricity generation. Conversely, the ETC system does not emerge as a promising option from an economic per-spective in the present case study, and a high percentage of ETCs in the
combined PV-ETC S-CHP system is also unfavourable. The economic performance of the PVT S-CHP system falls between those of the other more mature systems (PV panels, ETCs and their combinations). Currently, the ICE-CHP system is the most profitable solution with the shortest PBT of 6.2 years, compared to 9.4 years and 13.7 years for the PV solar power and PVT S-CHP systems, respectively. Nevertheless, the environmental assessments show that the PVT S-CHP system can dis-place emission amounting to 445 tCO2/year, which is considerably
higher than all other solar systems investigated in this work: 317 tCO2/
year for the combined PV-ETC (50%-50%) S-CHP system, and 25 tCO2/
year for the ICE-CHP system. Furthermore, a comparison of the total cost saving (TCS) due to the avoided energy bills and the carbon emission penalty costs shows that the PVT S-CHP system outperforms the other systems with any existing carbon price in EU. It suggests that a high carbon price is beneficial for improving the cost-competitiveness of the proposed solar-based systems, and in particular of the PVT S-CHP system. This would further promote the market penetration of this emerging technology, and contribute to existing carbon emission ob-ligations. Further efforts in technology innovation and cost reduction are still required before PVT technology can become economically competitive with conventional fossil-fuel solutions.
Acknowledgement
This work was supported by the UK Engineering and Physical Sciences Research Council (EPSRC) [grant number EP/M025012/1]. Data supporting this publication can be obtained on request from [email protected].
References [1] www.iea.org.
[2] Markides CN. Low-concentration solar-power systems based on organic Rankine cycles for distributed-scale applications: overview and further developments. Front Energy Res 2015;3.
[3] Freeman J, Hellgardt K, Markides CN. An assessment of solar-powered organic Rankine cycle systems for combined heating and power in UK domestic applica-tions. Appl Energy 2015;138:605–20.
[4] Ramos A, Chatzopoulou MA, Freeman J, Markides CN. Optimisation of a high-ef-ficiency solar-driven organic Rankine cycle for applications in the built environ-ment. Appl Energy 2018;228:755–65.
[5] Freeman J, Hellgardt K, Markides CN. Working fluid selection and electrical per-formance optimisation of a domestic solar-ORC combined heat and power system for year-round operation in the UK. Appl Energy 2017;186:291–303.
[6] Ramos A, Guarracino I, Mellor A, Alonso-Álvarez D, Childs P, Ekins-Daukes NJ, et al. Solar-thermal and hybrid photovoltaic-thermal systems for renewable heating. Briefing paper No 22, Grantham Institute Imperial College London; May 2017. p. 1–9.
[7] Dupeyrat P, Menezo C, Fortuin S. Study of the thermal and electrical performances of PVT solar hot water system. Energy Build 2014;68:751–5.
[8] https://www.iea.org/tcep/power/renewables/solarpv/[accessed 28/06/2019]. [9] IRENA. Renewable Power Generation Costs in 2018. Abu Dhabi: International
Renewable Energy Agency; 2019.
[10] Luthander R, Widén J, Nilsson D, Palm J. Photovoltaic self-consumption in build-ings: A review. Appl Energy 2015;142:80–94.
[11] Fong KF, Lee CK, Chow TT. Comparative study of solar cooling systems with building-integrated solar collectors for use in sub-tropical regions like Hong Kong. Appl Energy 2012;90:189–95.
[12] Thygesen R, Karlsson B. Simulation and analysis of a solar assisted heat pump system with two different storage types for high levels of PV electricity self-con-sumption. Sol Energy 2014;103:19–27.
[13] Reda F, Arcuri N, Loiacono P, Mazzeo D. Energy assessment of solar technologies coupled with a ground source heat pump system for residential energy supply in Southern European climates. Energy 2015;91:294–305.
[14] Thür A, Calabrese T, Streicher W. Smart grid and PV driven ground heat pump as thermal battery in small buildings for optimized electricity consumption. Sol Energy 2018;174:273–85.
[15] Toradmal A, Kemmler T, Thomas B. Boosting the share of onsite PV-electricity utilization by optimized scheduling of a heat pump using buildings thermal inertia. Appl Therm Eng 2018;137:248–58.
[16] Litjens GBMA, Worrell E, van Sark WGJHM. Lowering greenhouse gas emissions in the built environment by combining ground source heat pumps, photovoltaics and battery storage. Energy Build 2018;180:51–71.
[17] Weiss W, Spörk-Dür M. Solar Heat Worldwide, Global Market Development and Trends in 2017, Detailed Market Figures 2016. 2018 Edition.
[18] Tian Z, Zhang S, Deng J, Fan J, Huang J, Kong W, et al. Large-scale solar district
Fig. 19. (a) Sensitivity of environmental penalty cost saving (EPCS) and (b) total cost saving (TCS) of the proposed systems to the carbon price in Europe (0.02–0.12 €/kgCO2).