Abstract
The issue of the fragmentation of natural habitats is increasingly at the core of the scientific debate, but often not taken into due consid-eration in planning tools, with particular reference to the dynamism and complexity of landscapes. As it has been recognised at a European level, in order to allow different species to remain in good functional status, a network of green infrastructures should be implemented. The concept of ecological island is no longer sufficient to protect adequate-ly the fauna and the ecosystem it lives in. Consequentadequate-ly, ecological islands must turn into ecological networks. The ecological connectivity refers to the way habitats are physically connected to each other and how easy it is for species to move in. Good ecological connectivity is fundamental to the effective conservation of biodiversity considering that most species and ecological functions provided by ecosystems (ecosystem services) require a much wider space than that available within the boundaries of a single protected area. The main objective of this paper is to critically compare the application of a dedicated model for the design of ecological networks to two very different environmen-tal contexts. This model was first tested in a Mediterranean area (the
province of Reggio Calabria) in 2008 and updated in 2010. The main goal was to integrate the traditional (physiographic and functional) approaches into the design of ecological networks by taking into account biological and orographic elements as well as the anthropic structure of the territory. In 2011, within the ECONNECT European project, the same model was applied to the Pilot region of South-Western Alps (including the French region of Provence-Alpes-Côte d’Azur and the Italian regions Piedmont and Liguria), which is one of the richest transnational districts in Europe in terms of biodiversity. In such a region, the issue of multidisciplinary ecological connectivity was tackled in order to provide a series of proposals aiming at the development of the ecological potential of the area. The two applica-tions allowed to further investigate the strengths and weaknesses of the implemented model by integrating its validation also by means of information on faunal presence, which obviated one of the major lim-itations occurred in the first application.
Introduction
Over the last decade, the concept of ecological network has increasing-ly established itself in the European technical and scientific scenario (Rientjes and Roumelioti, 2003). The construction and development of ecological networks could represent one of the prominent strategies able to face the biodiversity loss (Hagen et al., 2012). Nevertheless, the term ecological network is not defined univocally and it is subject to different interpretations (Boitani et al., 2007) and the analysis of multispecies ecological networks in a spatially explicit manner is at an earlier stage (Dale and Fortin, 2010; Kissling et al., 2012). A first widely recognised approach is the structural (physiographic) one, which is based on the patch-matrix-corridor paradigm (Godron and Forman, 1983) where an ecological network is simplified in landscape morphological elements, such as core areas, corridors and buffer zones (Jongman and Pungetti, 2004). This interpretation derives from the assumption that the ecologi-cal management of the environmental mosaic should be investigated in an integrated manner and considering various space and time scales. Later on, this led to the concept of multiple-use modules (Noss and Harris, 1986) and to the use of the structural approach to define networks of habitats (Hobbs, 2002) (e.g., the Natura 2000 network, the centrepiece of EU nature and biodiversity policy). A second widespread approach is the functional one, where the elements of the ecological network are interpreted as a whole of ecosystems (core areas) connected through channels of functional relationships between the organisms of the ecosystem (Opdam et al., 2006). These differences in interpretations are one of the major problems concerning the technical and operational pro-posals aimed at the definition of ecological networks (Rientjes and Roumelioti, 2003). Actually, what stated before was the theoretical and operational starting point of the present research work, which aims at identifying a method that may integrate the above-mentioned approach-es obviating the need of detailed spatialised bio-ecological observations that are not often available or based on reliable time and space data. Yet, Correspondence: Luigi Laudari, Department of Agronomy, Mediterranean
University of Reggio Calabria, Località Feo di Vito, 89122 Reggio Calabria, Italy.
E-mail [email protected]
Key words: Ecological networks design; ecological connectivity; geographical information systems; sustainable landscape planning.
Contributions: the authors contributed equally.
Conflict of interests: the authors declare no potential conflict of interests. Acknowledgements: the authors wish to thank Dr Roberto Gianoglio (SEAcoop srl) for providing data obtained within the project ECONNECT -Pilot region of South-Western Alps (project funded by the EU within the framework of the European Territorial Cooperation/Alpine Space Programme 2007-2013 - www.econnectproject.eu).
Received for publication: 11 March 2015. Accepted for publication: 26 April 2015. ©Copyright C.R. Fichera et al., 2015 Licensee PAGEPress, Italy
Journal of Agricultural Engineering 2015; XLVI:459 doi:10.4081/jae.2015.459
This article is distributed under the terms of the Creative Commons Attribution Noncommercial License (by-nc 3.0) which permits any noncom-mercial use, distribution, and reproduction in any medium, provided the orig-inal author(s) and source are credited.
Application, validation and comparison in different geographical contexts
of an integrated model for the design of ecological networks
Carmelo Riccardo Fichera, Luigi Laudari, Giuseppe Modica
Department of Agronomy, Mediterranean University of Reggio Calabria, Italy
Non
commercial
at the same time, such a method should not lead to the mere identifica-tion of physical constituent elements but to a procedure with clear impacts on sustainable spatial planning at a medium and small scale (Noss and Coperrider, 1994; Meffé and Carroll, 1997; Beier and Noss, 1998; Gilbert-Norton et al., 2010). In particular, a model for the definition of an ecological network as a guideline in the planning process (Fichera et al., 2009a, 2009b) was implemented within a wider research activity carried out by the authors to define models of sustainable landscape plan-ning which take into account ecological connectivity (Fichera et al., 2007). From a methodological point of view, the developed model is com-posed of a system of algorithms operating on a geo-database in a dedicat-ed geographical information system (GIS) that, through repeatdedicat-ed process-ing of habitat quality assessment coupled with the definition of core areas, is able to determine the organisation of the ecology connectivity matrix. The model combines the two classical approaches for the defini-tion of ecological networks and sets out an integrated ecological network that corresponds to the real territorial structure and actual ecological needs. The model was applied to the territory of the province of Reggio Calabria (Italy) in 2008, and updated in 2010, emphasising its potentials and limitations as a guiding tool for a sustainable land-use planning (Fichera et al., 2010). Furthermore, the integration of the resulting
analy-ses in a WebGIS platform can represent an interesting opportunity in sup-porting a proactive participation of the stakeholders in the planning process (Pollino and Modica, 2013).
The resulting network design allows obtaining spatial continuity func-tional to faunal dispersion without any excessive impact on the study area. Data inputs were implemented on a functional connectivity (FunConn) model (Theobald et al., 2006). Such a model, which provides graph-theory based analysis methods for landscape connectivity, was modified and adapted for its application to two study areas: the whole province of Reggio Calabria (Fichera et al., 2009b) and the side of the Maritime Alps that is part of the province of Cuneo) taking into account their different landscape structure and ecological needs of native faunal species.
Materials and methods
Study areas
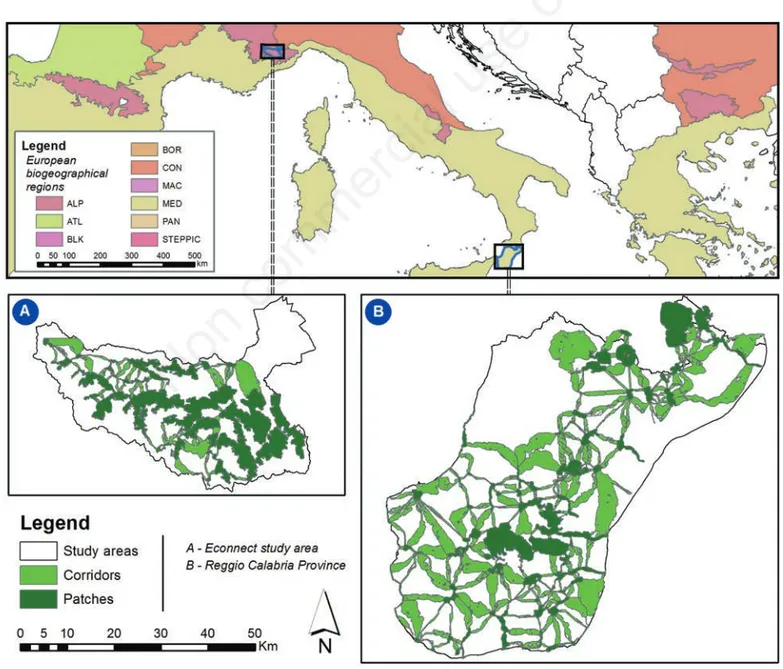
The work was carried out in two study areas (Figure 1):
- A: the side of the Maritime Alps that is part of the province of Cuneo
Figure 1. Location of the two study areas (A and B) with reference to the European biogeographical regions and organisation of their ecological networks obtained following the work of Fichera et al. (2009b).
Non
commercial
(an internal area of 123,921 ha) and belongs to the alpine biogeo-graphical region (hereafter the ECONNECT study area).
- B: the province of Reggio Calabria, a peninsular area of 318,291 ha belonging to the Mediterranean biogeographical region, in which the model was implemented and tested in 2008 (hereafter the Reggio Calabria study area) (Fichera et al., 2009b).
Within the Alpine Space Programme (ETC, 2007), the European Union has launched the project ECONNECT with the purpose of imple-menting an ecological continuum across the alpine region over the three years 2008/2011. The main goal of the project was to increase the ecological connectivity of the Alps through a holistic and multidiscipli-nary approach based on a model that is centred on the qualitative and quantitative selection of the areas of significant ecological value and on the analysis of their levels of interconnection. In order to achieve that goal, the workgroup, which was entrusted with the implementa-tion of the project in the Alps South-West pilot region (one of the seven ECONNECT pilot regions which are evenly distributed throughout the Alps), adopted the model for the design of ecological networks that Fichera et al. (2009b) had elaborated by adapting and modifying the FunConn model (Theobald et al., 2006).
This opportunity allowed comparing the design of two ecological net-works obtained with the same model applied to territorial contexts (Figure 1) that are deeply different from the administrative, bio-ecolog-ical and geographbio-ecolog-ical point of view.
Comparison of the model in the two different
geographical contexts
The research work was organised in a set of sequential steps that were separately carried out in the two study areas: i) definition of the integrated ecological networks on the two areas following the work of Fichera et al. (2009b); ii) selection of a set of common indicators in order to perform a comparative analysis; iii) comparison of the two eco-logical networks.
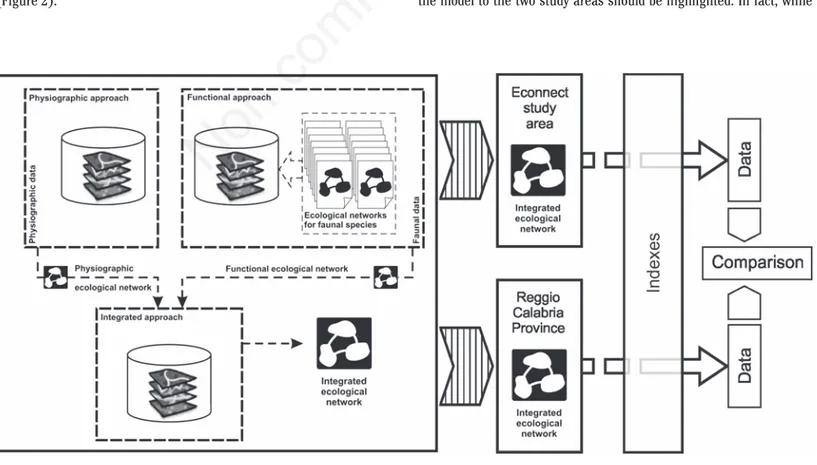
Ecological networks were elaborated in the two following steps (Figure 2):
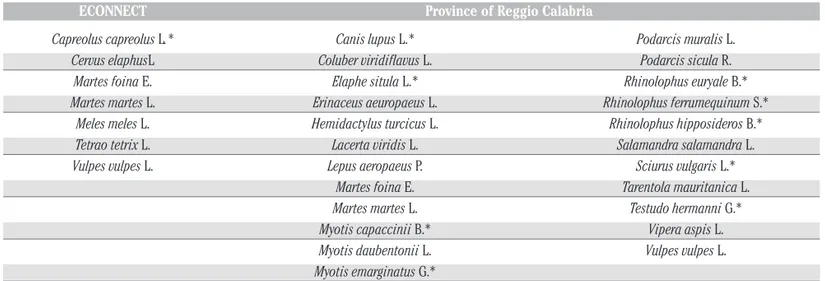
- In the first step, a specific ecological network was elaborated for each focal species present in the study areas (Boitani, 2000; Watts et al., 2010; Battisti and Luiselli, 2011). In the present research, in order to provide a complete picture of the complexity of the two different eco-logical contexts, a total 7 focal species for the ECONNECT area and 23 focal species for the province of Reggio Calabria have been select-ed (Table 1). As reportselect-ed in the table, ten of the thirty selectselect-ed focal species are currently included in the International Union for Conservation of Nature (IUCN) red lists (IUCN, 2015). This allowed identifying and mapping specific core areas and their related corri-dors (Bennett and Wit, 2001; Bennett and Mulongoy, 2006). To this end, the FunConn (v1.9) (Theobald et al., 2006) algorithm, a connec-tivity analyses toolbox designed to operate in the ArcGIS®(Esri®)
environment, was adopted. The main steps of FunConn can be syn-thesized in the three subsequent phases: i) creating a habitat-qual-ity surface; ii) using landscape resistance; and iii) defining and con-necting functional patches (Theobald et al., 2006).
- In the second step, after identifying the portions of core areas of high-er ecological value through ovhigh-erlay mapping, the specific ecological networks were aggregated to the institutional core areas (e.g., Natura 2000 network and Park’s Integral Reserves) found in the study areas (Kunzl et al., 2011). The resulting configuration corre-sponded to the main design of the core areas of the integrated eco-logical network. Starting from such core areas, the model led to the corridors’ design. In the resulting ecological network, corridors can be defined as plurispecific transit areas according with the consider-ations on regional connectivity planning (Baldwin et al., 2010). The model follows Bennett’s theoretical approach (2006), which organizes the ecological network as a coherent system of core areas (zones of high natural value for the conservation of habitats, species and landscapes) and corridors (physical connections between core areas so as to ensure the ecosystems self-regulation by allowing the movement of species) (De Montis et al., 2014a, 2014b).
In the above-mentioned first step, a difference in the application of the model to the two study areas should be highlighted. In fact, while
Figure 2. Diagram of the general model, flow chart of the analysis and operations comparison.
Non
commercial
the identification of the institutional core areas in the province of Reggio Calabria took into account Park’s Integral Reserves (category Ia; IUCN, 2008), SCIs (92/43/CEE) and SPAs (79/409/CEE) of the Natura 2000 network, in the case of the Maritime Alps, Integral Natural Reserves (category Ia; IUCN, 2008) and Special Natural Reserves (areas of great natural value defined by the Piedmont regional admin-istration - category IV; IUCN, 2008) were considered. However, this choice was suggested by objective reflections: actually, in the ECON-NECT study area, the Natura 2000 system is particularly extended and not completely differentiated according to specific ecological needs. Therefore, it appears as a continuum of protected areas, which would make any resulting ecological network, made up of short corridors, completely useless.
In order to evaluate the different structure of the two ecological net-works, the network comparison analysis was carried out by referring to tree synthetic indexes calculated for both study areas: i) landscape fragmentation (LF): mainly referred to the habitat fragmentation and isolation phenomena (in structural as well as in functional terms) and caused by the interference of anthropic activity (Jaeger, 2000; Romano, 2003, 2005); ii) environmental sustainability index (ESI): an indicator of ecological stability defined starting from the balance of pressure effects and the regeneration potential typical of each type of land use (Magoni and Steiner, 2001); iii) habitat suitability index (HSI): an aggregate measure of the territorial quality level of the species-envi-ronment relationships, defined for the Italian vertebrate by Boitani et al. (2003).
The indices analysis (except the HSI) and the implementation of the two ecological networks were based on 1:100,000 Corine land cover as reference map.
The values of the three indicators were grouped into classes accord-ing to their similar impact and the results obtained were shown sepa-rately for each of them in the following graphs and figures.
Results and discussion
Landscape fragmentation
Sprawl phenomena show that anthropic expansion (Harris, 1984; Saunders et al., 1991; Forman, 2008) has led to a remarkable qualita-tive and quantitaqualita-tive reduction in rural areas (Modica et al., 2012) with
consequent ecosystemic changes caused by the progressive isolation of the residual natural areas (MacArthur and Wilson, 1967; Boardman, 1981; Farhing and Merriam, 1985; Rodrigues et al., 2004; Hoekstra et al., 2005) and the interruption of the ecological connections existing between spatially separate landscape elements (EEA, 2011).
In literature, several methodologies to identify, evaluate and classify LF can be found. They can be grouped in the following approaches: analytic [e.g., the PANDORA model (Gobattoni et al., 2011)], patch-based (Heilman et al., 2002; Bogaert et al., 2004; Riitters et al., 2004); pixel-level mapping based on image convolution (Riitters et al., 2000, 2002; Civco et al., 2002), and on morphological image processing (Metzger and Muller, 1996; Metzger and De’camps, 1997; Soille, 2003; Vogt et al., 2007).
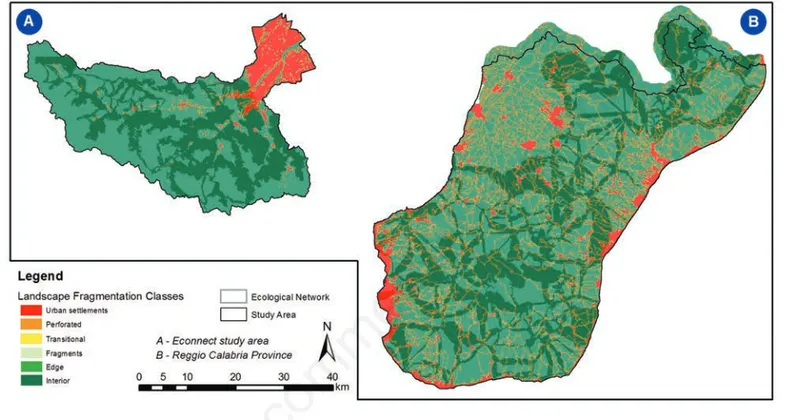
In the present research, LF was assessed by means of the landscape fragmentation tool (LFT v2.0), a GIS tool developed by the Laboratory for Earth Resources Information Systems, Centre for Land use Education and Research (CLEAR - University of Connecticut) and based on the research carried out by Vogt et al. (2007) that have deep-ened morphological image processing (Soille, 2003) on landscape analysis. LFT classifies landscape patterns by a sequence of logical operations using geometric objects of pre-defined shape and size, and called structuring elements (Vogt et al., 2007). LFT maps and classifies LF in a specified land use category (e.g., agro-forestry areas) according to five fragmentation classes: interior, perforated, edge, transitional and fragments. These categories can be used to assess the amount of LF and are obtained on a specified edge width (Parent and Hurd, 2009). The edge width indicates the distance over which other land uses (e.g., urban settlements) can degrade the land cover category of interest.
Once such parameters were mapped and displayed by means of a simple overlay mapping process, six LF elements were obtained (Table 2). A LF map was created for each study area highlighting the territory belonging to their respective ecological networks (Figure 3). Moreover, the corresponding surface values were analysed according to the six landscape fragmentation classes and made comparable through the cal-culation of their incidence rates (in surface terms) in each of the investigated territories.
The graph in Figure 4 shows a similar trend of the values of the LF indicator for the two study areas and for the two ecological networks. Significant variations that can be noticed are mainly related to the dif-ferent intensity and distribution of road infrastructures on the two study areas. In more details, the ECONNECT study-area shows higher values of fragmentation but clustered and mainly located in the
north-Table 1. List of the focal species selected in the implementation of the two ecological networks.
ECONNECT Province of Reggio Calabria
Capreolus capreolus L.* Canis lupus L.* Podarcis muralis L. Cervus elaphusL Coluber viridiflavus L. Podarcis sicula R. Martes foina E. Elaphe situla L.* Rhinolophus euryale B.* Martes martes L. Erinaceus aeuropaeus L. Rhinolophus ferrumequinum S.* Meles meles L. Hemidactylus turcicus L. Rhinolophus hipposideros B.* Tetrao tetrix L. Lacerta viridis L. Salamandra salamandra L. Vulpes vulpes L. Lepus aeropaeus P. Sciurus vulgaris L.* Martes foina E. Tarentola mauritanica L. Martes martes L. Testudo hermanni G.* Myotis capaccinii B.* Vipera aspis L. Myotis daubentonii L. Vulpes vulpes L. Myotis emarginatus G.*
*Species included in the International Union for Conservation of Nature (IUCN) red list of threatened species.
Non
commercial
eastern side. In the Reggio Calabria study-area, fragmentation is more dispersed although more significantly concentrated along the coastal areas that are more urbanised and densely populated. Moreover, in this study-area, fragments can be detected also in the institutional core areas, therefore in the Natura 2000 framework. What highlighted does not mean that Natura 2000 sites should be excluded from the ecological network. Indeed, their role on biodiversity conservation is widely recog-nised and remarked by scholars (Boitani et al., 2003; Biondi et al., 2012; Modica et al., 2012). Rather, this issue opens new perspectives of reflection and therefore new challenges in their sustainable planning and management.
Particularly referring to the design of networks, in case of high
eco-logical fragmentation, the model tends to generate small patches scat-tered on the territory. In this situation, corridors are oversized and play a dominant role within the network, thus making their precise analysis unavoidable for an interim validation of the network. When fragmenta-tion is lower and characterised by large and evenly distributed patches, the model generates shorter corridors, since it can at most delimit the width of the lower-friction directrices, depending on the biological and ecological characteristics of the faunal species.
Environmental sustainability index
ESI (Treu et al., 2000; Magoni and Steiner, 2001) is an indicator of the level of ecological stability of the landscape based on models of
Figure 3. Landscape fragmentation distribution map according to the six landscape fragmentation classes defined.
Figure 4. Graphic distribution of the landscape fragmentation according to the six landscape fragmentation classes defined. Data are reported with reference to their distribution on the whole study areas, on their ecological networks and on their core areas.
Non
commercial
compartmental land management (Odum, 1983) that analyse natural and human components as compartments linked to each other by flows of material and energy. As a result, a condition of sustainable develop-ment may be achieved through a balanced dimensional ratio and an effective interaction between the various land covers, which depends on the different pressure and regeneration processes they can carry out (Fichera et al., 2010).
In order to achieve a transparent assessment of the quantitative parameters of the levels of pressure [equivalent pressure surface (EPS)] and regeneration [equivalent regeneration surface (ERS)] phenomena, an analytic hierarchy process (AHP) (Saaty, 1977) has been implemented following the work of Treu et al. (2000) (Fichera et al., 2010).
Once the eigenvectors of EPS and ERS matrices were defined, ESI was calculated through the following passages: i) areas covered by the land uses were multiplied by the respective values of ERS and EPS; ii) ESI was calculated as the ratio between the total equivalent area of regeneration (T-ERS) and the overall equivalent area (T-ERS + T-EPS), which were defined for each land use class (equivalent area is meant as the estimate of the equivalent area of regeneration necessary to rebalance a unit of equivalent area of pressure):
ESI = T-ERS / (T-ERS + T-EPS *α ) (1) where α is the coefficient of ecological stability used to set the indica-tor (Treu and Magoni, 1998; Magoni and Steiner, 2001). The value range of ESI is included between 0 (minimum level of regeneration and
maximum level of pressure) and 1 (maximum level of regeneration and minimum level of pressure) (Table 3).
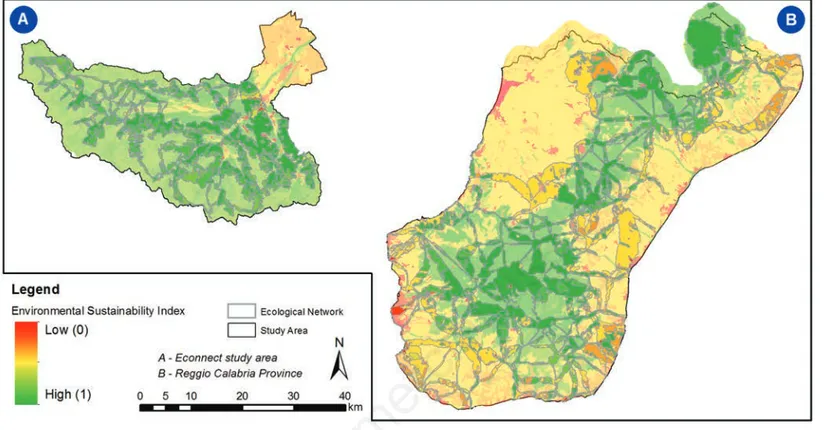
ESI values were associated to each land cover class for each study area and for the corresponding ecological networks (Figure 5). Surface values were grouped into three classes and made comparable through the calculation of their incidence rates (Figure 6).
Also in this case, the graph shows a marked difference in the index spatial distribution in both the two study areas (second and third class) but a certain consistency in the trend of the values on the networks. This discrepancy is due to the higher incidence of agricultural areas (ESI average values) on the territory of the Reggio Calabria study area and, therefore, to the higher proportional weight of forestry areas (high ESI values) on the ECONNECT study area.
Habitat suitability index
In 2002, the Italian Ministry of the Environment (Nature Conservation Service) promoted a study aimed at the identification and analysis of the conservation needs of the Italian vertebrates (Boitani et al., 2003). Still today, this is the only research carried out at national scale in Italy, and provides information on biodiversity and on habitat quality for most Italians native terrestrial vertebrates (33 amphibians, 92 mammals, 207 breeding birds, 37 reptiles, and 45 fresh-water fishes were scrutinised). All focal species selected for the defini-tion of the two ecological networks are included in the research of Boitani et al. (2003).
In the original study, for each species, four habitat quality levels were defined and mapped based on a raster data model (cell size,
Table 2. Landscape fragmentation classes types obtained applying landscape fragmentation tool (LFT v2.0).
Classes Description of the characteristics
0 Urban settlements - land covers that can degrade the land cover type of interest (e.g., agro-forestry areas)
1 Perforated - more than 60% of the analysis window contains the land cover of interest, and the land cover is found along the exterior edge of a small area of a non-similar land cover
2 Transitional - between 40% and 60% of the analysis window contains the land cover of interest. The land cover of interest tends to be connected to other like features, but it is beginning to be surrounded by other fragmentation land cover type
3 Fragments - less than 40% of the analysis window contains the land cover of interest. The land cover of interest tends to be surrounded by other fragmenting land cover types
4 Edge - more than 60% of the analysis window contains the land cover of interest and the land cover is found along the interior edge of a large area of non-similar land cover
5 Interior - the central cell in the landscape window is surrounded by cells of the same land cover. No fragmentation exist in the analysis window
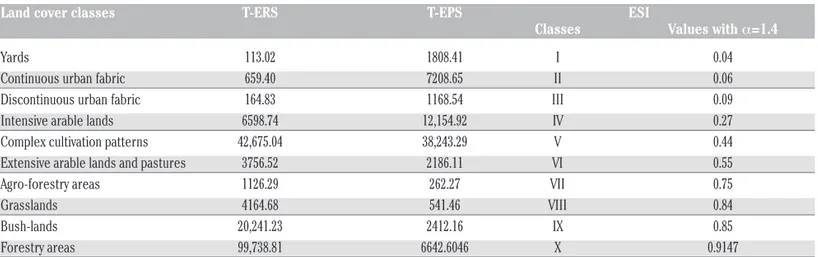
Table 3. Environmental sustainability index values for each of the defined land cover classes.
Land cover classes T-ERS T-EPS ESI
Classes Values with α=1.4 Yards 113.02 1808.41 I 0.04 Continuous urban fabric 659.40 7208.65 II 0.06 Discontinuous urban fabric 164.83 1168.54 III 0.09 Intensive arable lands 6598.74 12,154.92 IV 0.27 Complex cultivation patterns 42,675.04 38,243.29 V 0.44 Extensive arable lands and pastures 3756.52 2186.11 VI 0.55 Agro-forestry areas 1126.29 262.27 VII 0.75 Grasslands 4164.68 541.46 VIII 0.84 Bush-lands 20,241.23 2412.16 IX 0.85 Forestry areas 99,738.81 6642.6046 X 0.9147
T-ERS, total equivalent regeneration surface; T-EPS, total equivalent pressure surface; ESI, environmental sustainability index.
Non
commercial
100x100 m) (Boitani et al., 2003): i) unsuitable: habitats where the ecological needs of the species are not satisfied; ii) low suitable: habi-tats that do not guarantee long-term stability for the presence of species; iii) medium suitable: habitats that guarantee the presence of the species at a sub-optimal level; iv) very suitable: habitats that sup-port the presence of species to an optimal level.
As a result, a gradient of the habitat suitability for all Italian native terrestrial vertebrates was obtained at Italian scale. In our work,
origi-nal habitat suitability models of Boitani et al. (2003) were rescaled obtaining an HSI that ranges in a [0, 100] scale so as to facilitate com-parisons with the other two defined indices (Figure 7).
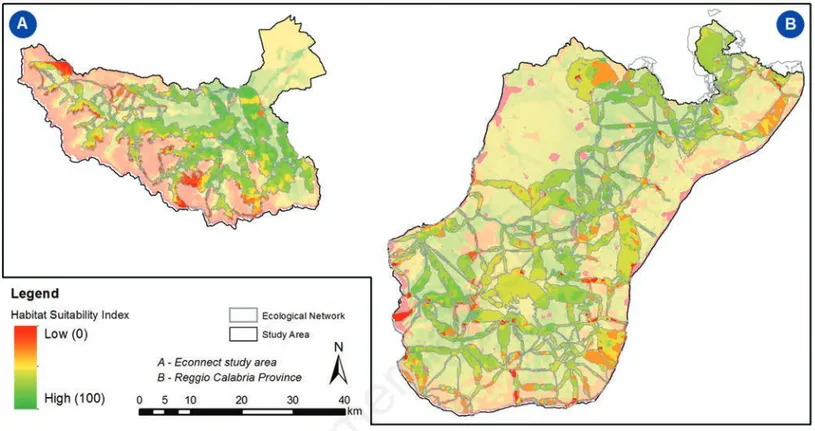
As the graph shows (Figure 8), the HSI has a similar trend in the whole territory of the two study areas and in the corresponding eco-logical networks, in which a higher habitat suitability can be observed. Moreover, also for HSI considerations made for LF can be applied. In fact, in the ECONNECT study area, lower values of HSI are
Figure 5. Map of the environmental sustainability index in the two study-areas (A and B).
Figure 6. Percentage distribution of the classes of the environmental sustainability index. Data are showed with reference to their dis-tribution on the whole study areas, on their ecological networks and on their core areas.
Non
commercial
more common and clustered compared to the Reggio Calabria study-area (they correspond to alpine habitat characterised by sparse or no vegetation). In the Reggio Calabria study-area, lower values of HSI are more widespread particularly along the coastal areas. Indeed, in this study-area, lower values of HSI can be observed also inside insti-tutional core areas of the ecological network (they correspond to habitats with degraded or no vegetation as well as to habitats very close to continuous urban areas).
Conclusions
To curb the phenomena of territorial fragmentation is one of the objectives of a correct policy of environmental conservation. As a mat-ter of fact, any treatment of the theme of natural conservation, which is linked to spatial planning based on the mere delimitation of areas and on forms of elementary protection, is anachronistic. The focus
Figure 7. Map of the habitat suitability index in the two study-areas (A and B).
Figure 8. Percentage distribution of the classes of the habitat suitability index. Data are showed with reference to their distribution on the whole study areas, on their ecological networks and on their core areas.
Non
commercial
must shift from the site or the species to the ecosystem or the habitat so as not to be constrained by the concept of geographical or adminis-trative border. In this new planning scenario, the terms delimitation and zoning are meant as structuring of a permeable territorial fabric able to interconnect the different natural areas as elements of a large system and to guarantee the regular internal dynamics of biological systems.
The model allowed obtaining the design of an ecological network that complies with the theoretical physiographic and functional aspects and with the fundamental characteristics of ecological networks. This resulted in an integrated approach to planning that may ensure ecolog-ical consistency and landscape multifunctionality. In other words, it would be a wide-ranging green infrastructure aimed at integrating the maintenance of ecological functionality and the real needs and poten-tial expressions of the landscape.
The comparison showed that, in order to effectively model core areas and corridors, the best research scale should be that of a large area (medium spatial scale). This parameter influences not only the applicative importance of results but also the design of networks. In fact, a large-scale application imposes the presence of cutting lines that directly depend on the imposed limits. The application of the model, with the same parameters but on different borders, generates different networks that are not significant at a local scale, though they still allow getting information on the quantity and on the location of high quality habitats for each species.
Moreover, considering that corridors’ design is strictly scale-depend-ed, corridors defined at a regional or provincial scale should be comple-mented with corridors that are created at a supraregional and local scales, thus configuring a multiple scale network of effective linkage.
An important result is certainly the replicability of the model, which can be used again to integrate further species (e.g., following changes occurring in the IUCN red list or in presence of new synecological researches). Therefore, it proves to be a tool that may be normally used in a system of collection and organisation of faunal data and informa-tion. Then, the creation of the integrated network must be seen as a result that allows making planning and programming choices able to meet requirements of synthesis and analysis.
Furthermore, the available faunal information for the ECONNECT project territory showed that the presence and location of the species investigated corresponded to the most fitting areas identified by the model. It also provided consistent data related to the clash between fauna and infrastructures.
The analysis carried out demonstrated that, thanks to its character-istics of synthesis, replicability and integrability, the model allows obtaining consistent and similar responses on territories that are oro-graphically, structurally and biologically different.
References
Baldwin R.F., Perkl R.M., Trombulak S.T., Burwell W.B. 2010. Modeling ecoregional connectivity. In: S. Trombulak and R. Baldwin (eds.), Landscape-scale conservation planning. Springer-Verlag, Dordrecht, The Netherlands, pp 349-367.
Battisti C., Luiselli L. 2011. Selecting focal species in ecological network planning following an expert-based approach: italian reptiles as a case study. J. Nature Conserv. 19:126-30.
Beier P., Noss R.F. 1998. Do habitat corridors provide connectivity?. Conserv. Biol. 12:1241-52.
Bennett G., Mulongoy K.J. 2006. Review of experience with ecological net-works, corridors and buffer zones. Technical Series No. 23. Secretariat of the Convention on Biological Diversity, Montreal, Quebec, Canada.
Bennett G., Wit P. 2001. The development and application of ecological networks. a review of proposals, plans and programmes. AID Environment, Amsterdam, The Netherlands.
Biondi E., Casavecchia S., Pesaresi S., Zivkovic L. 2012. Natura 2000 and the pan-European ecological network: a new methodology for data integration. Biodivers. Conserv. 21:1741-54.
Boardman R. 1981. International organisation and the conservation of nature. Macmillan, New York, NY, USA.
Bogaert J., Ceulemans R., Salvador-Van Eysenrode D. 2004. Decision tree algorithm for detection of spatial processes in landscape transforma-tion. Environ. Manage. 33:62-73.
Boitani L. 2000. Rete ecologica nazionale e conservazione della biodiver-sità. Parchi 29:66-74.
Boitani L., Falcucci A., Maiorano L., Montemmaggiori A. 2003. Italian eco-logical network: the role of the protected areas in the conservation of vertebrates. Animal and Human Biology Department, University La Sapienza of Rome; Nature Conservation Directorate of the Italian Ministry of Environment; Istitute of Applied Ecology, Rome, Italy. Boitani L., Falcucci A., Maiorano L., Rondinini C. 2007. Ecological
net-works as conceptual framenet-works or operational tools in conservation. Conserv. Biol. 21:1414-22.
Civco D.L., Hurd J.D., Wilson E.H., Arnold C.L., Prisloe Jr. M.P. 2002. Quantifying and describing urbanizing land- scapes in the northeast United States. Photogr. Eng. Rem. S. 68:1083-90.
Dale M.R.T., Fortin M.-J. 2010. From graphs to spatial graphs. Annu. Rev. Ecol. Evol. Syst. 41:21-38
De Montis A., Bardi M.A., Ganciu A., Ledda A., Caschili S., Mulas M., Dessena L., Modica G., Laudari L., Fichera C.R. 2014a. Landscape planning and ecological networks. Part A. A rural system in Nuoro, Sardinia. TeMA J. Land Use Mobility Environ. 7:297-307.
De Montis A., Bardi M.A., Ganciu A., Ledda A., Caschili S., Mulas M., Dessena L., Modica G., Laudari L., Fichera C.R. 2014b. Landscape planning and ecological networks. Part B. a rural system in Nuoro, Sardinia. TeMA J. Land Use Mobility Environ. 7:309-20.
EEA (European Environment Agency). 2011. Green infrastructure and ter-ritorial cohesion. EEA, Copenhagen, Denmark.
ETC (European Territorial Cooperation). 2007. Alpine Space Programme. Available from: http://www.alpine-space.eu Accessed: Febbruary 2015. Farhing L., Merriam G. 1985. Habitat patch connectivity and population
survival. Ecology 66:1762-8.
Fichera C.R., Laudari L., Modica G. 2007. L’implementazione di una matrice di connessione ambientale per la valorizzazione delle aree rurali marginali. Il caso studio del versante tirrenico reggino. In: C.R. Fichera (ed.), Multifunzionalità dell’agricoltura e sviluppo sosteni-bile. Innovazione Tecnologica e valorizzazione delle tipicità nelle aree marginali. Iiriti Ed., Reggio Calabria, Italy, pp 103-118.
Fichera C.R., Laudari L., Modica G. 2009a. Ecological networks as a key in sustainable landscape planning to solve landscape fragmentation. In: XXXIII CIOSTA CIGR V Conf. Technology and Management to Ensure Sustainable Agriculture, Agro-Systems, Forestry and Safety, Reggio Calabria, Italy.
Fichera C.R., Laudari L., Modica G. 2009b. Un modello per la strut-turazione di reti ecologiche a supporto della pianificazione territori-ale. Il caso della Provincia Di Reggio Calabria. In: Proc. IX Conf. AIIA, Ischia Porto (NA), Italy.
Fichera C.R., Laudari L., Modica G. 2010. From the construction of an eco-logical network to the definition of an environmentally sustainable planning model for periurban space. In: XVII World Congr. Int. Comm. Agric. Biosyst. Engine. (CIGR), Quebec, Canada.
Forman R.T.T. 2008. Land mosaics: the ecology of landscapes and regions. Cambridge University Press, Cambridge, UK.
Gilbert-Norton L., Wilson R., Stevens J.R., Beard K.H. 2010. A meta-analyt-ic review of corridor effectiveness. Conserv. Biol. 24:660-8.
Non
commercial
Gobattoni F., Pelorosso R., Lauro G., Leone A., Monaco R. 2011. A proce-dure for mathematical analysis of landscape evolution and equilibri-um scenarios assessment. Landscape Urban Plan. 103:289-302. Godron M., Forman R.T.T. 1983. Landscape modification and changing
ecological characteristics. In: H.A. Mooney and M. Godron (eds.), Disturbance and ecosystems. Springer, Berlin-Heidelberg, Germany, pp 12-28.
Hagen M., Kissling W.D., Rasmussen C., De Aguiar M.A.M., Brown L.L., Carstensen D.W., Alves-Dos S.I., Dupont Y.L., Edwards F.K., Genini J., Guimarães P.R., Jenkins G.D., Jordano P. 2012. Biodiversity, species interactions and ecological networks in a fragmented world. Adv. Ecol. Res. 46:89-120.
Harris L.D. 1984. The fragmented forest; island biogeography theory and the preservation of biotic diversity. University of Chicago Press, Chicago, IL, USA.
Heilman G.E., Strittholt J.R., Slosser N.C., Dellasala D.A. 2002. Forest frag-mentation of the conterminous United States: assessing forest intactness through road density and spatial characteristics. BioSci. 52:411-22.
Hobbs R.J. 2002. Habitat networks and biological conservation. In: K.J. Gutzwiller (ed.), Applying landscape ecology in biological conserva-tion. Springer, New York, NY, USA, pp 150-170.
Hoekstra J., Boucher T., Ricketts T., Roberts C. 2005. Confronting a biome crisis: Global disparities of habitat loss and protection. Ecol. Lett. 8:23-9.
IUCN (International Union for Conservation of Nature). 2008. Guidelines for applying protected area management categories. IUCN, Gland, Switzerland.
IUCN (International Union for Conservation of Nature). 2015. The IUCN red list of threatened species. Version 2014.3. Available from: http://www.iucnredlist.org Accessed: 23 April 2015.
Jaeger J.A.G. 2000. Landscape division, splitting index, and effective mesh size: new measures of landscape fragmentation. Landscape Ecol. 15:115-30.
Jongman R.H.G., Pungetti G. 2004. Ecological networks and greenways: concept, design, implementation. Cambridge University Press, Cambridge, UK.
Kissling W.D., Dormann C.F., Groeneveld J., Hickler T., Kuhn I., McInerny G.J., Montoya J.M., Romermann C., Schiffers K., Schurr F.M. 2012. Towards novel approaches to modelling biotic interactions in multi-species assemblages at large spatial extents. J. Biogeogr. 39:2163-78. Kunzl M., Badura M., Heinrichs A.K., Plassmann G., Haller R., Walzer C.
2011. Implementation recommendations. STUDIA
Universitätsbuchhandlung und-verlag, Innsbruck, Austria.
MacArthur R.H., Wilson E.O. 1967. The theory of island biogeography. Princeton University Press, Princeton, NJ, USA.
Magoni M., Steiner F.R. 2001. The environment in the provincial plan of Cremona, Italy. Environ. Manage. 27:639-54.
Meffé G.K., Carroll R.C. 1997. Principles of conservation biology, 2nd ed. Sinauer Associates, Sunderland, MA, USA.
Metzger J.P., De’camps H. 1997. The structural connectivity threshold: an hypothesis in conservation biology at the landscape scale. Acta Oecol. Int. J. Ecol. 18:1-12.
Metzger J.P., Muller E. 1996. Characterizing the complexity of landscape boundaries by remote sensing. Land Ecol. 11:65-77.
Modica G., Vizzari M., Pollino M., Fichera C.R., Zoccali P., Di Fazio S. 2012. Spatio-temporal analysis of the urban-rural gradient structure: an application in a Mediterranean mountainous landscape (Serra San Bruno, Italy). Earth Syst. Dyn. 3:263-79.
Noss R.F., Coperrider A.Y. 1994. Saving nature’s legacy: protecting and restoring biodiversity. Defenders of wildlife. Island Press, Washington, DC, USA.
Noss R.F., Harris L.D. 1986. Nodes, metworks, and MUMs: preserving
diversity at all scales. Environ. Manage. 10:299-309.
Odum E.P. 1983. Basic ecology. Saunders College Publ., University of Michigan, Ann Arbor, MI, USA.
Opdam P., Steingröver E., van Rooij S. 2006. Ecological networks: a spatial concept for multi-actor planning of sustainable landscapes. Landscape Urban Plan. 75:322-32.
Parent J., Hurd J., 2009. Landscape fragmentation tool (LFT) v2.0. Center for Land Use Education and Research. University of Connecticut, Farmington, CT, USA.
Pollino M., Modica G., 2013. Free web mapping tools to characterise land-scape dynamics and to favour e-participation. In: B. Murgante, S. Misra, M. Carlini, C.M. Torre, H.-Q. Nguyen, D. Taniar, B.O. Apduhan, O. Gervasi (eds.), ICCSA 2013, Part III. LNCS, vol. 7973, Lecture notes in computer science. Springer Berlin-Heidelberg, Germany, pp 566-581. Rientjes S., Roumelioti K. 2003. Support for ecological networks in
euro-pean nature conservation: an indicative social map. Euroeuro-pean Centre for Nature Conservation. Drukkerij Groels, Tilburg, Netherlands. Riitters K.H., Wickham J.D., Coulston J.W. 2004. A preliminary
assess-ment of Montreal process indicators of forest fragassess-mentation for the United States. Environ. Monitor. Assess 91:257-76.
Riitters K.H., Wickham J.D., O’Neill R.V., Jones K.B., Smith E.R. 2000. Global-scale patterns of forest fragmenta- tion. Ecol. Soc. (formerly Cons. Ecol.) 4:3.
Riitters K.H., Wickham J.D., O’Neill R.V., Jones K.B., Smith E.R. 2002. Fragmentation of continental United States forests. Ecosystems 5:815-22.
Rodrigues A.S.L., Andelman S.J., Bakarr M.I., Boitani L., Brooks T.M., Cowling R.M., Fishpool L.D.C., da Fonseca G.A.B., Gaston K.J., Hoffmann M., Long J.S., Marquet P.A., Pilgrim J.D., Pressey R.L., Schipper J., Sechrest W., Stuart S.N., Underhill L.G., Waller R.W., Watts M.E.J., Yan X. 2004. Effectiveness of the global protected area network in representing species diversity. Nature 428:640-3. Romano B. 2003. Evaluation of urban fragmentation in the ecosystems.
In: Int. Conf. on Mountain Environment and Development (ICMED), Chengdu, Sichuan, China.
Romano B. 2005. The indicators of ecological fragmentation in land use planning. In: Proc. Natl. Conf. Ecoregions and Ecological Networks: Planning Meets Conservation. WWF-UPI, Roma, Italy.
Saaty T.L. 1977. A scaling method for priorities in hierarchical structures. J. Math. Psychol. 15:234-81.
Saunders D.A., Hobbs R.J., Margules C.R. 1991. Biological consequences of ecosystem fragmentation: a review. Conserv. Biol. 5:18-32. Soille P. 2003. Morphological image analysis: principles and applications,
2nd ed. Springer-Verlag, Berlin, Germany.
Theobald D.M., Norman J.B., Sherburne M.R. 2006. FunConn v1 user’s manual: ArcGIS tools for functional connectivity modeling. Natural Resource Ecology Lab, Colorado State University, Fort Collins, CO, USA. Treu M.C., Magoni M. 1998. The environmental sustain- ability index in the plan for the Cremona area. Paper delivered at the Creating Sustainable Places Symposium, College of Architecture and Environmental Design, 29-31 January, Arizona State University, Tempe, AZ, USA.
Treu M.C., Magoni M., Steiner F., Palazzo D. 2000. Sustainable landscape planning for Cremona, Italy. Landscape Urban Plan. 47:79-98. Vogt P., Riitters K.H., Estreguil C., Kozak J., Wade T.G., Wickham J.D. 2007.
Mapping spatial patterns with morphological image processing. Landscape Ecol. 22:171-77.
Watts K., Eycott A.E., Handley P., Ray D., Humphrey J.W., Quine C.P. 2010. Targeting and evaluating biodiversity conservation action within fragmented landscapes: an approach based on generic focal species and least-cost networks. Landscape Ecol. 25:1305-18.