Presynaptic c-Jun N-terminal Kinase 2
regulates NMDA receptor-dependent
glutamate release
Robert Nistico`
1,8, Fulvio Florenzano
1, Dalila Mango
1,2, Caterina Ferraina
1, Massimo Grilli
3, Silvia Di
Prisco
3, Annalisa Nobili
2,4, Stefania Saccucci
5, Marcello D’Amelio
2,4, Michela Morbin
5, Mario Marchi
3,6,
Nicola B. Mercuri
2, Roger J. Davis
7, Anna Pittaluga
3,6& Marco Feligioni
11Laboratory of Pharmacology of Synaptic Plasticity, EBRI ‘‘Rita Levi-Montalcini’’ Foundation, Rome, 00143, Italy,2Laboratory of Experimental Neurology, IRCCS Fondazione Santa Lucia, Rome, 00143, Italy,3Department of Pharmacy, Pharmacology and Toxicology Section, University of Genoa, Genoa, 16148, Italy,4University Campus Biomedico, 00100 Rome,5Neuropathology & Neurology V - IRCCS Foundation C. Besta Milan, 20133, Italy,6Center of Excellence for Biomedical Research, University of Genoa, Genoa, 16132, Italy,7Department of Biochemistry and Molecular Biology, Howard Hughes Medical Institute and Program in Molecular Medicine, University of Massachusetts Medical School, Worcester, Massachusetts, 01605, USA,8Department of Physiology and Pharmacology, Sapienza University of Rome, Rome, 00185, Italy.
Activation of c-Jun N-terminal kinase (JNK) signaling pathway is a critical step for neuronal death occurring
in several neurological conditions. JNKs can be activated via receptor tyrosine kinases, cytokine receptors,
G-protein coupled receptors and ligand-gated ion channels, including the NMDA glutamate receptors.
While JNK has been generally associated with postsynaptic NMDA receptors, its presynaptic role remains
largely unexplored. Here, by means of biochemical, morphological and functional approaches, we
demonstrate that JNK and its scaffold protein JIP1 are also expressed at the presynaptic level and that the
NMDA-evoked glutamate release is controlled by presynaptic JNK-JIP1 interaction. Moreover, using
knockout mice for single JNK isoforms, we proved that JNK2 is the essential isoform in mediating this
presynaptic event. Overall the present findings unveil a novel JNK2 localization and function, which is likely
to play a role in different physiological and pathological conditions.
G
lutamate is the most abundant excitatory neurotransmitter in the brain playing fundamental roles such as
neuronal differentiation, migration and survival in the developing brain
1,2, as well as excitatory synaptic
transmission and plasticity
3,4. However, in a variety of pathological conditions, including stroke and
various neurodegenerative disorders, excessive glutamate release may mediate neuronal injury or death
5–7.
Glutamate exerts its function by activating ionotropic (NMDA, AMPA, kainate) or metabotropic (mGlu)
recep-tors. These receptors are widely distributed in the central nervous system (CNS) and, although they are
pref-erentially located postsynaptically, they are also involved in neurotransmitter release from presynaptic
compartments in different neuronal systems
8. However, existence of glutamate receptors at presynaptic terminals
has been suggested by immunochemical localization experiments
9,10, functional studies
11,12and receptor subunit
trafficking analyses
9,13. Physiological NMDA receptor (NMDAR) activity underlies normal synaptic plasticity,
whereas its excessive activation leads to apoptosis and excitotoxicity. These events appear to be mediated, among
other proteins, by c-Jun N-terminal kinase (JNK) phosphorylation which triggers signaling pathways associated
with acute and chronic diseases
14–16. Three genes are known to encode the different isoforms of JNK
17: JNK1 and
JNK2 that are expressed in a ubiquitous manner, while JNK3 is mainly expressed at neuronal level
18. Genes
associated with JNK expression are essential for mouse development
19and JNK isoforms act as key proteins for
brain development, including neuronal migration, dendrite formation and axon maintenance, but also neuronal
death
20–22. It has been suggested that following its activation, postsynaptic NMDARs interact with JNK, in fact,
JNK inhibition reduces NMDAR-mediated neuronal apoptosis in organotypic hippocampal slice culture
23.
Although JNKs are ubiquitously expressed, there is lack of evidence for their expression and physiological role
at presynaptic sites.
In the present study we have investigated, by using biochemical, imaging and functional approaches, the role of
JNKs in controlling glutamate release evoked by NMDA.
SUBJECT AREAS:
SPIKE-TIMING-DEPENDENT PLASTICITY NEUROTRANSMITTERS NEUROCHEMISTRY PATCH CLAMPReceived
27 October 2014
Accepted
13 February 2015
Published
12 March 2015
Correspondence and requests for materials should be addressed to M.F. (m.feligioni@ebri. it)Results
c-Jun N-terminal kinase (JNK) regulates presynaptic glutamate
release.
Glutamate release experiments, monitored as release of
preloaded [3H]D-aspartate ([3H]D-ASP), were performed to
investigate the role of JNK kinase in the presynaptic compartment.
The radiactive tracer allows to measure glutamate exocytosis from
isolated nerve terminals avoiding the problems related to the
enzymatic degradation of glutamate
24,25. From here on, throughout
the manuscript, the release of preloaded [3H]D-ASP will be referred
to as glutamate release. Mouse cortical terminals were tested for
glutamate release using different stimuli up-down superfused on a
thin layer of synaptosomes, according to a standard procedure
26.
Transient (90 s) exposure of cortical nerve terminals to a mild
depolarizing
stimulus
(8 mM
KCl)
induced
a
significant
exocytotic-like [
3H]D-Asp overflow (158 6 37% vs. control. **p ,
0.01), which is comparable to that obtained by 10 min exposure to
100 mM NMDA (202 6 21% vs. control. **p , 0.01). NMDA
stimulus was applied in Mg
21-free medium to ensure the
operability of the presynaptic NMDA receptor
24. Similarly, a
milder 10 min stimulus of 50 mM (s)-AMPA was able to give a
significant [
3H]D-Asp overflow (98 6 11% vs. control. **p ,
0.01) (fig. 1A). Both stimuli are known to trigger Ca
21-dependent
neurotransmitter release
27.
Biochemical analysis of c-Jun N-terminal Kinase (JNK) activation
upon different stimuli in cortical mouse synaptosomes.
Among
the many intracellular partners activated by the above used stimuli,
the involvement of the JNK protein has been investigated in cortical
mouse synaptosomes. Synaptic JNK activation, measured as
phosphorylated protein induced by different stimuli, was measured
by biochemical experiments (fig. 1B–C–D). Only 10 min exposure to
NMDA (100 mM) 1 glycine (1 mM) in Mg
21-free medium stimulus
induced a significant increase in JNK phosphorylation (163 6 18%
vs. control 5 100%. **p , 0.01). KCl and AMPA left unchanged the
level of pJNK respect to the control. The NMDA-evoked release
experiments were performed in Mg
21-free medium solution to
maintain the NMDA receptors active without the Mg
21‘block’
26.
Notably the NMDA blocker D-AP5 (50 mM) was able to reverse
the NMDA-mediated increase in JNK phosphorylation (Fig. 1E).
An additional study was carried out to exclude the possibility that
the basal release of glutamate reaches a sufficient concentration able
to induce NMDA activation in absence of any exogenous stimulus
and leading to JNK phosphorylation. The NMDAR antagonist
D-AP5 was applied to synaptosomes for 10 min and no changes in
phosphorylation of JNK (110.0 6 8.9% vs Ctrl 100%) were
detected (fig. 1F).
It was demonstrated that postsynaptic NMDAR induces JNK
activation through the interaction of JNK scaffolding protein JIP1.
In line with this, it was observed that the NMDAR activity in JIP1 KO
mice is reduced
28. Here in order to assess whether also presynaptic
NMDAR-signaling pathway might involve the signaling formed by
NMDA/JIP1/JNK proteins, we tested for the presence of JNK and
JIP1 at the presynaptic level.
For this, we used an ultrastructural fractionation of synaptosomes
9and purity of the fractions were analyzed before use. PSD-95
immunoreactivity was observed only at the post-synaptic fraction
(Post) while Syntaxin 1a (STX1a) resulted enriched in the
presynap-tic fraction (Pre) and absent in the Post. The non-synappresynap-tic soluble
proteins (NSSP) fraction was only contaminated by STX1a which it
could be attributed to docking vesicles at the presynaptic membrane
(fig. 1G). As expected JNK and its scaffolding protein JIP1 were
present at both NSSP and Post fractions. Most importantly they were
also clearly present at the presynaptic site (fig. 1G).
To demonstrate that, in synaptosomes, upon NMDA stimulus the
activation of JNK is mainly presynaptic, cortical synaptosomes were
stimulated and later subjected to ultrasynaptic fractionation. We
found that JNK phosphorylation was strongly augmented at the
presynaptic site (fig. 1H).
To confirm that JNK activation triggered by NMDA could pass
through JNK-JIP1 interaction, we used a specific JNK inhibitor
(L-JNKi1) which is able to disrupt the interaction of JNK with its
JNK-binding domain (JBD) targets
29. It is a cell permeable peptide (CPP)
composed the JBD amino acid sequence linked to 10–amino acid
carrier peptide derived from the HIV-Tat 48–57 sequence
29. Cortical
synaptosomes were treated for 30 min with 2 mM of L-JNKi1 after
which the same stimuli above described were applied. In accordance
with already published data the time frame and concentration used
were enough to let the inhibitor diffuse and inhibit JNK
29,30. In line
with the evidences that L-JNKi1 does not affect JNK
phosphoryla-tion
31, pre-incubation of synaptosomes with L-JNKi1 resulted in
increased JNK activation when NMDA stimulus was applied (149
6
10% vs control 5 100%. *p , 0.05). In contrast, basal JNK
phos-phorylation was unaltered when L-JNKi1 was applied alone (fig. 1B).
In the case of KCl and AMPA the application of L-JNKi1 left JNK
phosphorylation unaffected (fig. 1C–D). Altogether these results
indicate that NMDA stimulus specifically modulates JNK activity.
L-JNKi1 does not induce changes in vesicle machinery proteins and
in NMDA or AMPA receptor subunit levels.
We next monitored the
expression levels of some presynaptic proteins such as syntaxin 1a
(STX1a), synapsin (SYN), MUNC18-1 and synaptotagmin 1 (SYT1)
since their alteration compromises the neurotransmitter release
efficiency
32,33. In our experimental conditions NMDA and L-JNKi1,
when applied alone or in combination, did not modify the
expression of STX1a, SYN, MUNC18-1 and SYT1 in synaptosomes
(Supplementary Fig. 1A). Similarly, NMDA and AMPA receptor
subunits expression (Supplementary Fig. 1B) were unchanged, thus
excluding the possibility that NMDA-mediated effect on presynaptic
JNK might depend on specific modifications of receptors subunits.
L-JNKi1 inhibitor modulates presynaptic glutamate release and
reduces NMDA-evoked exocytosis of fluorescent dye from
synap-tosomes.
Interestingly, among the 3 stimuli used, only the
NMDA-stimulated glutamate release was strongly inhibited (260 6 10% vs.
control 5 100%. t-test, **p , 0.01) by L-JNKi1 (fig. 2A), indicating a
specificity of the JNK pathway in modulating only the
NMDA-evoked glutamate release. In order to exclude that the effect
measured was due to the Tat sequence contained in the L-JNKi1,
Tat peptides fragments, enclosing amino acids 48–57, were applied
on synaptosomes. Nor Tat 41–60 (100.85 6 5.18% vs. control 5
100%; t-test) neither Tat 31–50 (97.65 6 4.11% vs. control 5
100%; t-test) were able to decrease the glutamate spontaneous
release (fig. 2B).
The capability of JNK inhibition to reduce the effect of presynaptic
NMDA was also investigated by measuring the vesicle exocytosis.
The fluorescent dye (Synaptogreen), which is incorporated into
pre-synaptic vesicles, is released into the extracellular space losing its
fluorescence. The fluorescence decrease reflects the exocytosis
extent. The NMDA-evoked exocytosis was monitored by
spectro-fluorophotometer measurement. Synaptosomes, pre-loaded with the
fluorescent dye, were exposed to NMDA and glycine stimulus, as
control, or with a pretreatment for 30 min with L-JNKi1 or D-AP5.
The decrease in fluorescence intensity due to the released dye was
registered for 6 min in the two preparations (fig. 2C). As expected,
NMDA (100 mM) 1 glycine (1 mM) stimulus induced a reduction in
fluorescence (258.7 6 0.9%) which it was reduced by L-JNKi1
application (228.1 6 1.1% vs. NMDA 1 glycine. t-test **p ,
0.01) and more stronger with D-AP5 that was used as control since
is an NMDA channel blocker (29.2 6 1.3% vs. NMDA 1 glycine.
t-test **p , 0.01), (fig. 2D).
Time-lapse imaging recording of the stimulated exocytosis from
synaptosomes.
Synaptogreen fluorescence dye exocytosis was also
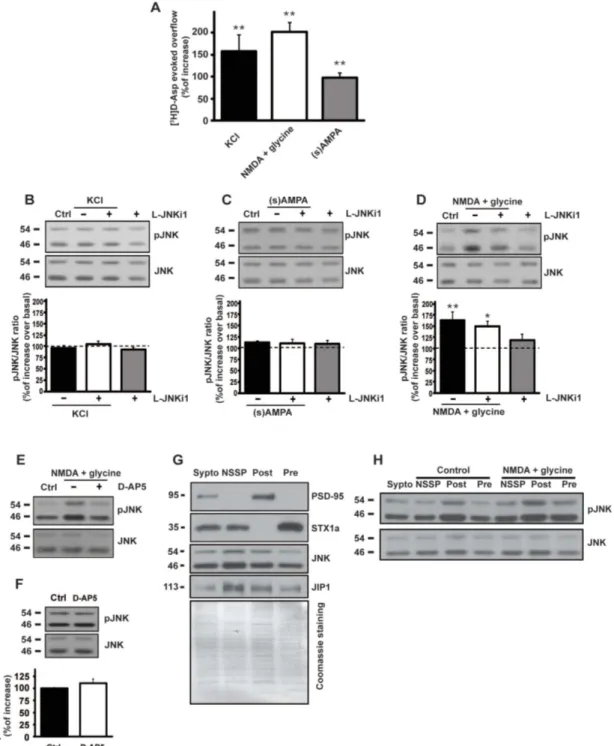
Figure 1
|
Effect of different pharmacological stimuli on presynaptic glutamate release and biochemical modulation of JNK. (A) Glutamate release evoked by different stimuli. Wild-type mice cortical synaptosomes preloaded with radioactive tracer were incubated with stimuli as indicated. The experiment demonstrated that every stimuli applied were able to induce the release of the neurotransmitter measured as radioactive D-Aspartate. Results are normalized vs. the basal release and expressed as percentage of induced overflow. Means 6 s.e.m. n 5 3 experiments run in triplicate (three superfusion chambers for each experimental condition), **p , 0.01 vs. basal release, Tukey’s test. (B–C–D) Cropped WB are representative of the activation of JNK showing P-JNK protein levels upon 90 sec of KCl (8 mM) stimulus (C), 10 min of NMDA (100 mM) 1 glycine (1 mM) (B), 10 min of (s)AMPA (50 mM) (D) and L-JNKi1 treatment in synaptosomal preparation. The quantifications are expressed as percentage of increase of P-JNK/JNK ratio over control (at 100) and show that only the NMDA 1 glycine stimulus induced an increase in JNK phosphorylation. Means 6 s.e.m. n 5 4, **p , 0.01 vs 100% of control, Tukey’s test. L-JNKi1 does not reduce NMDA effect, *p , 0.05 vs 100% of control, Tukey’s test. (E) The NMDA receptor antagonist D-AP5 (50 mM) was incubated in synaptosomal preparation and was able to prevent the JNK phosphorylation induced by NMDA stimulus. Cropped representative WB. (F) D-AP5 (50 mM) was incubated in synaptosomal preparation. Control and D-AP5 conditions not differ in JNK activation. Means 6 s.e.m. n 5 4, Student’s test. Cropped representative WB. (G) WB analysis of presynaptic JNK and JIP1. Cropped WB represents the synaptic compartment ultrafractionation of cortical mice synaptosomes. The purity of the preparation has been tested with anti-PSD95 and anti-STX1a as postsynaptic and presynaptic markers. JNK and JIP1 are clearly present also at the presynapse and they can therefore interact together. Lanes loading includes total synaptosomes (Sypto), non-synaptic soluble proteins (NSSP), post-synaptic fraction (Post), pre-synaptic fraction (Pre). Coomassie blue staining has been performed as loading control. H) Ultrasynaptic fractionation of mice cortical synaptosomes was prepared to show presynaptic JNK activation after NMDA stimulus. Cropped representative WB.studied through video time-lapse recording. This additional
technique allows to better appreciate the synaptosomal exocytosis
kinetics compared to spectrofluorophotometer. By analyzing the
images, it is possible to identify responding synaposomes and to
analyze the fluorescence changes of synaptic puncta during the
experiment. Administration of 30 mM KCl alone was able to
trigger a fluorescence decrease (24 6 4.57%). Synaptosomes
pre-incubation with L-JNKi1 for 30 min before the KCl stimulus
evoked a slight lower fluorescence decrease (21 6 6.21%) which
was not significatively different to the KCl alone group (fig. 3A–D,
I–J.). In line with spectrofluorophotometer experiments,
pre-incubation with L-JNKi1 for 30 min before the NMDA (100 mM)
1
glycine (1 mM) (Mg
21-free medium) stimulus prevented the
fluorescence decrease (30.37 6 9.48%; t-test, ***p , 0.001) when
compared to the NMDA (67.91 6 10.57%) stimulated alone group
(fig. 3E–H, L–M).
JNK mediates presynaptic NMDA-dependent glutamate release.
Glutamate spontaneously released in the synaptic cleft can in turn
activate the NMDARs located at the presynaptic terminals thus
allowing a further tonic facilitation of glutamate release
34. Here we
performed electrophysiological recordings to investigate the
functional role of JNK in glutamate release. We studied the effect
of L-JNKi1 on NMDA-dependent presynaptic glutamate release
measuring miniature excitatory postsynaptic currents (mEPSCs),
according to a protocol previously described
34. The application of
D-AP5 in the presence of extracellular tetrodotoxin (1 mM) and
picrotoxin (100 mM), and with MK-801 (10 mM) in the
patch-pipette (in order to block NMDA channels in the cell we were
recording from), induced a reversible increase of the cumulative
inter-event interval (iei) distribution (***p , 0.001, K-S test,
C57BL6/J vs. D-AP5, n 5 11; fig. 4A) and of their median values
(**p , 0.01, Student’s t-test, ctrl vs. D-AP5, n 5 11; fig. 4B), whilst
the cumulative and median amplitude of the same events were
unaffected (p . 0.05, K-S test, C57BL6/J vs. D-AP5, n 5 11;
fig. 4A; p . 0.05 Student t-test, ctrl vs. D-AP5, n 5 11; fig. 4B).
The reduction in frequency by D-AP5 is due to the blockade of
presynaptic NMDA receptors which facilitate tonic glutamate
release. In slices pre-incubated with L-JNKi1 the effect of D-AP5
was lost. In fact we found that perfusion with D-AP5 did not lead
to significant changes of inter-event interval (p . 0.05, K-S test,
C57BL6/J 1 L-JNKi1 vs. D-AP5, n 5 10; fig. 4A; p . 0.05,
Student’s t-test, ctrl vs. D-AP5, n 5 10; fig. 4B) and amplitude
(p . 0.05, K-S test, C57BL6/J 1 L-JNKi1 vs. D-AP5, n 5 10;
fig. 4A; p . 0.05, Student’s t-test, ctrl vs. D-AP5, n 5 10; fig. 4B).
Overall these electrophysiological results indicate that JNK
Figure 2
|
Effect of JNK inhibitor on evoked-glutamate release and fluorescent dye exocytosis. (A) Mice cortical synaptosomes where treated with the JNK inhibitor L-JNKi1 (2 mM) for 30 min before stimuli as indicated. Among the other stimuli, the JNK inhibitor was able to decrease the release of glutamate evoked by NMDA (100 mM) 1 glycine (1 mM). Results measured as neurotransmitter overflow are normalized vs. the evoked release (at 100) without L-JNKi1. Means 6 s.e.m. n 5 3 experiments run in triplicate (three superfusion chambers for each experimental condition), **p , 0.01 vs 100% of NMDA-evoked release, Tukey’s test. (B) Tat 20 mer (41–60) (2 mM) and (31–50) (2 mM) were used as control for the peptide L-JNKi1 which contain a sequence of the Tat protein (48–50) used as cargo for cell permeability. Both the 20 mer contains the cargo sequence and none of them were able to modify the basal release of glutamate in cortical synaptosomes. The synaptosomes loaded with radioactive neurotransmitter were treated with the Tat 20 mer. Results are measured as neurotransmitter overflow are normalized vs the basal release (at 100) without 20 mer Means 6 s.e.m. n 5 3 experiments run in triplicate (three superfusion chambers for each experimental condition), Student’s t-test (C) Wild-type mice cortical synaptosomes were preloaded with Synaptogreen, a fluorescent dye that is incorporated in the presynaptic release vesicle. Synaptosomes were then incubated, where indicated, with L-JNKi1 30 min before stimuli. Representative traces of Synaptogreen fluorescence decadence are here shown. L-JNKi1 reduced the fluorescence run-down evoked by NMDA (100 mM) 1 glycine (1 mM). As control the NMDA inhibitor D-AP5(50 mM) has been also used. To better appreciate the effect of the inhibitor traces of the last 2 min of the experiment have been graphed in the little panel. (D) Quantification of the fluorescence decadence upon NMDA 1 glycine stimulus. Data are calculated as mean of the last 20 sec of the experiments. Means 6 s.e.m. n 5 4, **p , 0.01 vs NMDA alone, Student’s t-test.inhibition reduces glutamate release mediated by presynaptic
NMDA receptors, suggesting that JNK plays a functional role in
NMDA-dependent glutamate release in acute brain slices.
NMDA does not facilitate glutamate release and JNK
phosphory-lation in JNK2 knock-out mice.
To identify which JNK isoform is
activated by NMDA stimulus in presynaptic compartment, glutamate
release experiments were conducted on cortical synaptosomes
obtained from JNK knock-out (KO) mice. Glutamate release,
measured as [
3H]D-Asp efflux, was evoked by NMDA for
10 min. Interestingly, NMDA evoked release was significantly
lower (28 6 19% over basal overflow; n 5 4 Newman-Keuls,
**p , 0.01) only in JNK2 KO mice compared to JNK1 and
JNK3 KO and wild-type (WT) mice (fig. 5A). This result
Figure 3
|
L-JNKi1 pretreatment does not affect KCl responses but reduces NMDA stimulated exocytosis. Representative images of Synaptogreen (FM 1-43) stained cortical synaptosomes stimulated after 1 min with KCl alone (A) or pretreated with L-JNKi1 (C) and recorded for 6 min; or stimulated after 4 min with NMDA alone (E) or pretreated with L-JNKi1 (G) and recorded for 30 min. First, is the first image of the time-lapse sequence. Last, is the last image of the time-lapse sequence. Difference, is the image obtained by subtracting the last image to the first of the time-lapse sequence. (B,D,F,H) are the corresponding fluorescence intensity color map (Jet Palette) images. Brighter spots correspond to functional presynaptic terminals. (I) Average percentage of fluorescence loss for KCl (green) and KCl 1 L-JNKi1 (red). (J) Representative traces of destaining time courses for KCl and KCl 1 L-JNKi1. Arrow indicates the KCl stimulus. (L) Average percentage of fluorescence loss for NMDA 1 glycine and NMDA 1 glycine 1 L-JNKi1. (M) Representative traces of destaining time courses for NMDA 1 glycine (green) and NMDA 1 glycine 1 L-JNKi1 (red). Arrow indicates the NMDA stimulus. Data are derived from four independent experiments. In each experiment three coverslips for each experimental group were analyzed. Scale bar A and J 5 10 mm.suggests that presynaptic JNK2 specifically controls
NMDA-evoked release.
In order to corroborate the notions indicating a specific
involve-ment of JNK2 in the presynaptic NMDA-evoked glutamate release,
we investigated whether the absence of JNK2 reduced JNK
phos-phorylation. The JNK KO mice used present a deletion of a specific
JNK gene, therefore the other remaining JNK proteins are still
detect-able. To appreciate the different protein expression, JNK
immuno-Figure 4
|
Functional role of JNK in NMDA-dependent glutamate release. (A) Cumulative distributions of mEPSC amplitude (left) and inter-event interval (iei) (right) recorded from a single C57BL6/J neuron, or C57BL6/J neuron pre-incubated with L-JNKi1 in response to D-AP5. The traces on top are obtained from the same neuron, in control conditions, during D-AP5 application and at D-AP5 washout. (B) Histograms of the median values expressed as percentage versus control (100%) of mEPSC amplitude (left) and iei (right) recorded from 11 neurons of C57BL6/J, and 10 neurons of C57BL6/J pre-incubated with L-JNKi1 (n 5 10) in response to D-AP5. **p , 0.01 (t-test).reactivity in JNK KO mice has then been analyzed. As already
reported
35JNK proteins are present as double isoforms (54 kDa
and 46 kDa bands) and at around 46 kDa JNK2 shows a faint band
up to the JNK1 one. In JNK1 KO mice the JNK1 46 kDa band
dis-appeared, while the JNK2 46 kDa band is lacking in JNK2 KO. In
both JNK2 and JNK3 KO mice the 56 kDa bands was found to be
reduced (fig. S1C).
Synaptosomes prepared from cortex of JNK-KO mouse were
sub-jected to NMDA stimulus and, as expected, the phosphorylation of
JNK induced by NMDA application was totally abolished in JNK2
KO mice as compared with control. In contrast, it was still
main-tained in JNK1 KO and in JNK3 KO mice where NMDA induced an
increase of pJNK immunoreactivity (165 6 13% over control 5
100%; n 5 5 t-test **p , 0.01) (176 6 10% over control 5 100%;
n 5 4 t-test **p , 0.01) (fig. 5B) which is totally comparable with the
one obtained in WT mice (fig. 1B). Interestingly NMDA stimulus
increased both bands (46 and 54 kDa) of JNK phosphorylation in
JNK1 and JNK3 KO mice. This might be due to the fact that JNK2,
which is present in both JNK1 and JNK3 KO animals, has two
splic-ing variants at 46 and 54 kDa
36. In all cases, application of L-JNKi1
alone did not affect JNK phosphorylation, suggesting that JNK
func-tionality in both KO mice is not perturbed in the presence of JNK
inhibitor, as also reported for wild-type mice (fig. 5A). The presence
of JNK2 at the presynaptic site was then detected by WB on an
ultrasynaptic fractionation of mice cortical synaptosomes (fig. 5C).
Ultrastructural characterization of synaptosomes and localization
of JNK2 protein.
The localization of JNK2 at the presynaptic site was
also confirmed by electron microscopy technique. We evaluated the
ultrastructure of synaptosomes by analyzing corticals from mice. The
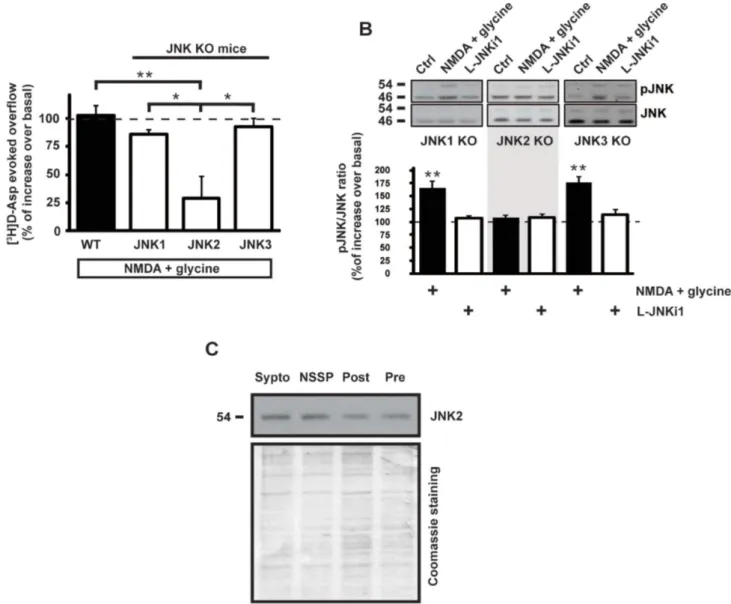
Figure 5
|
NMDA-evoked glutamate release and NMDA-induced JNK phosphorylation are inhibited in JNK2 KO. (A) NMDA stimulus was used to evoke glutamate release from wild-type and JNK KO mice cortical synaptosomes that were preloaded with radioactive tracer. In synaptosomes from JNK2 KO mice the effect of NMDA (100 mM) 1 glycine (1 mM) is inhibited indicating that JNK2 presynaptic protein is the responsible of this mechanism. Results are presented as percent of glutamate overflow released under NMDA stimulus compared to the base line of each condition. Means 6 s.e.m., n 5 4 experiments run in triplicate (three superfusion chambers for each experimental condition). **p , 0.01 vs WT; *p , 0.05 vs JNK1 KO or JNK3 KO, Tukey’s test. (B) Synaptosomes from cortex of JNK KO mice were stimulated with NMDA (100 mM) 1 glycine (1 mM). The pJNK/JNK ratio has been evaluated. Representative cropped WB with relative quantification showing pJNK/JNK ratio in JNK1 KO, JNK2 KO or JNK3 KO mice during treatments are reported as shown in blots. Results are expressed as percentage versus control (at 100). Means 6 s.e.m., n 5 3,**p , 0.01 vs 100% of control, Tukey’s test. (C) Cortical synaptosomes synaptic fractionation was prepared from wild-type mice to show that JNK2 is also presynaptic located. Lanes loading includes total synaptosomes (Sypto), non-synaptic soluble proteins (NSSP), post-synaptic fraction (Post), pre-synaptic fraction (Pre). Cropped representative WB.typical morphology of synaptosomes was clearly observed by electron
microscopy (fig. 6A) and show mainly vesicles of 0.2–0.8 mm diameter
that contain the complete presynaptic terminal (further distinguished
by the conspicuous presence of neurotransmitter-filled vesicles,
mitochondria, smooth endoplasmic reticulum, microtubules and
neurofilaments); a synaptic cleft (about 20–30 nm); a postsynaptic
component is distinguishable by presence of amorphous electrondense
material containing black granules along the corresponding plasma
membranes so-called ‘postsynaptic density’ (PSD)
9.
Immunocytochemical analysis on synaptosomes shows the
pres-ence of JNK
2protein both in pre- and post-synaptic structure
(fig. 6B).
JNK2 colocalizes with presynaptic markers in mice cortical
synaptosomes.
Confocal microscopy experiments were performed to
assess the colocalization of JNK2 with two well-known markers
of the presynaptic machinery. Synaptotagmin-1 (SYT 1) is localized
in synaptic vesicles and it triggers calcium-induced exocytosis
37.
Synaptosomal-associated protein 25 (SNAP-25) is a membrane
protein with a cytosolic domain that contributes in the formation of
the exocytotic fusion complex (SNARE complex), where it assembles
with syntaxin-1 and synaptobrevin
38. The double immunofluorescence
staining for JNK2/SYN 1, (fig. 7A–F) or JNK2/SNAP-25 (fig. 7J–O)
showed a high proportion of JNK2 immunoreactive synaptic puncta,
indicating a widespread distribution of JNK2 while a complex
colocalization pattern was characterized by different degrees of
alternating single and double labeling in synaptosomal puncta. For
quantitative analysis, to avoid interference from fluorescent dots
aspecifically bound on the glass, image analysis was selectively
performed by analyzing only the synaptosomal strucures identified
through the transmitted light channel. Protein colocalization,
including the evaluation of the colocalized threshold area, were
analyzed by using two colocalization coefficients (Pearson’s and
Manders), and visual inspection of the spatial relations (Plot Profile)
between the two immunoreactive fluorescence signal intensities.
JNK2 colocalizes with both SYT 1 (13.00 6 1.35%) and SNAP-25
(15.00 6 2.21%) with respect to the total synaptosomal area (fig. 7G).
The percentage difference (17%) was not significant suggesting that
JNK2 does not preferentially colocalize with SYT 1 or SNAP-25. The
Pearson’s coefficient was 0.62 6 0.07 and 0.69 6 0.08 respectively,
indicating that in all the synaptosomal structures JNK2
immu-noreactivity
colocalizes
with
both
synaptosomal
proteins
(colocalization is considered positive for values ranging 0.5–1)
(fig. 7H). Also in this case, the percentage difference was not
significative (about 10%) suggesting that JNK2 does not correlate
preferentially with SYT 1 or SNAP-25. Although Manders’s
coefficients are less efficient compared to Pearson’s coefficient, for
colocalization analysis, they can be used to evaluate the reciprocal
association ratio between fluorescence markers. All Manders’s
coefficients were above 0.5 (association is considered positive for
values ranging 0.5–1), with the exception of the JNK2 presence in
the SYT 1 signal which was lower (0.36 6 2.21) (fig. 7P–R).
Interestingly,
the
percentual
difference
for
both
Manders
coefficients
were
significatively
higher
for
JNK2/SNAP-25
immunofluorescence respect to JNK2/SYT 1, (34% and 12%,
respectively, t-test ***p , 0.001) suggesting a preferential
interaction of JNK2 with SNAP-25. Plot profiles traces showed a
rather heterogeneous fluorescence distribution for both JNK2/SYT
1 and JNK2/SNAP-25 double immunofluorescence (fig. 7I–S).
Traces displaying associated spatial increases and decreases of
fluorescence intensity (indicating colocalization; fig. 7 yellow
arrows pointing up) were alternated to traces characterized by a
disjoint trend (indicating lack of colocalization; fig. 7 yellow
arrows
pointing
down).
Associated
and
disjoint
traces
homogenously could be followed for about 0.5 micron which can
be a reasonable estimation for a single presynaptic size (0.5–1.5
micron). This suggests that presynaptic structures display only
colocalization or single staining for the analyzed markers.
JNK2 isoform modulates presynaptic NMDA-dependent glutamate
release.
Electrophysiological recordings were also performed in
transgenic mice in order to confirm which JNK isoform was
involved in NMDA-dependent glutamate release. For this, we
recorded mEPSC from 8 neurons of JNK1 KO mice, 7 neurons of
JNK2 KO mice and 6 neurons of JNK3 KO mice. We found that
perfusion with D-AP5 induces an increase of the cumulative
inter-event interval distribution in JNK1 KO (***p , 0.001, K-S test, JNK1
KO vs. D-AP5; fig. 8A) and JNK
3KO mice (***p , 0.001, K-S test,
JNK3 KO vs. D-AP5; fig. 8A) and an increase of their median values
(**p , 0.01, Student’s t-test, control vs. JNK1 or JNK3 KO; fig. 8B). In
both genotypes, the mEPSC amplitude was never affected by D-AP5
perfusion (p . 0.05, K-S test, JNK1 or JNK3 KO vs. D-AP5; fig. 8A;
p . 0.05, Student t-test, control vs. JNK1 or JNK3 KO; fig. 8B). Notably,
the decrease of glutamate release due to D-AP5 was specifically
prevented in JNK2 KO mice. Indeed, perfusion with D-AP5 did not
produce significant changes neither in mEPSC iei (p . 0.05, K-S test,
Figure 6
|
(A) Electron microscope analysis of a synaptosome.Synaptosomes from wild-type mice’s cortex show a pre-synaptic element which contains mitochondria (m) and numerous synaptic vesicles (asterisk) and a post-synaptic element characterized by a synaptic junction with a postsynaptic density (arrows). (B,C) Mice cortex synaptosome immunolabelled with JNK2 antibody. Immunogold particles are visible and appear relatively numerous around vesicles of the pre-synaptic element and they are also diffused in the cytoplasm of the post-synaptic element (arrows). Scale bar: 200 nm.
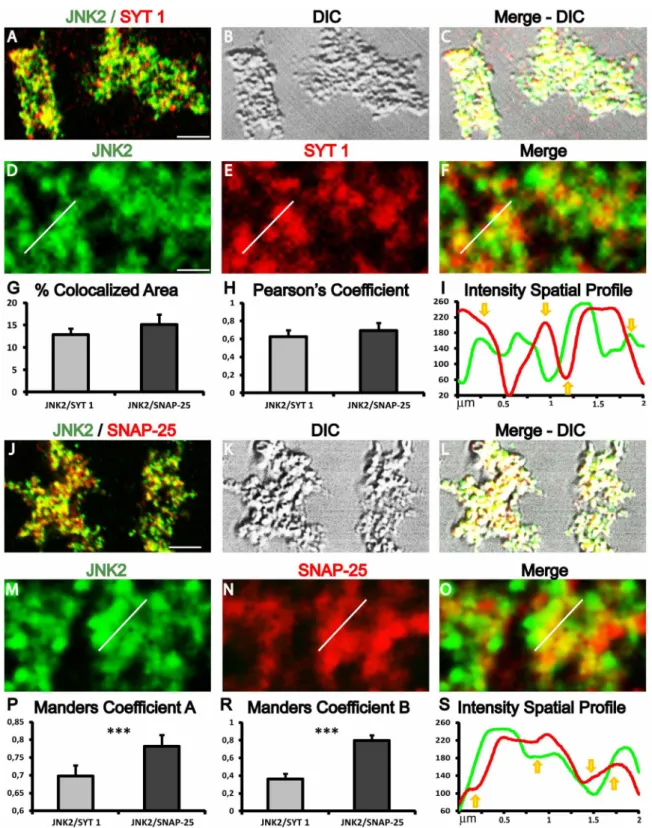
Figure 7
|
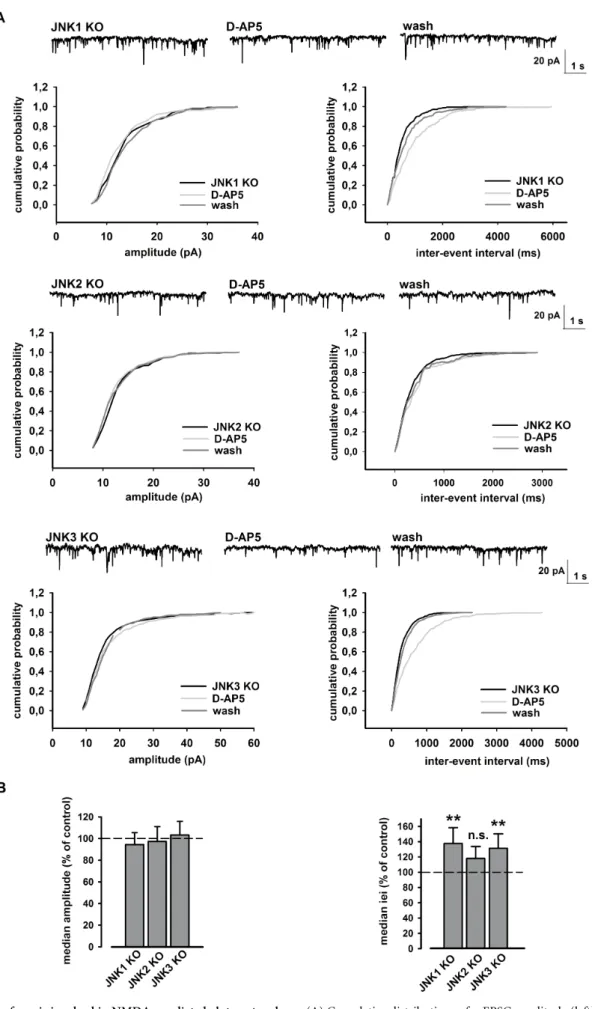
Synaptosomal JNK2 expression and colocalization with presynaptic markers. Confocal images and colocalization analysis of JNK2/SYT 1 (A– F) and JNK2/SNAP-25 (J–O) double labelling. (A) Fluorescence green/red channels merge of JNK2/SYT 1 double staining. (B) Transmitted light (DIC channel) view of JNK2/SYT 1 double staining. (C) Fluorescence and transmitted light channel merge. (D) JNK2 green channel immunofluorescence. (E) SYT 1 red channel immunofluorescence. (F) Fluorescence green/red channels merge of JNK2/SYT 1 double staining. (G) Histogram showing the percentages of colocalized area compared to the total immunofluorescent area. (H) Histogram showing Pearson’s coefficients. (I) and (S) Traces of fluorescence intensity spatial profiles through the white line shown in D–E for JNK2/SYT 1 and in M–O for JNK2/SNAP-25 immunofluorescences. Yellow arrows indicate a qualitative visual evaluation of the correlative colocalization features. Arrows pointing up indicate a positive correlative colocalization (associated trend), while arrows pointing down display the absence of correlative colocalization (disjoint trend). (J) Fluorescence green/red channels merge of JNK2/SNAP-25 double staining. (K) Transmitted light (DIC channel) view of JNK2/SNAP-25 double staining. (L) Fluorescence and transmitted light channel merge. (M) JNK2 green channel immunofluorescence. (N) Snap25 red channel immunofluorescence. (O) Fluorescence green/red channels merge of JNK2/SNAP-25 double staining. (P) Histogram showing the percentages of Manders coefficient A. (R) Histogram showing Manders coefficient B. Data are derived from three independent experiments. In each experiment five microscopic fields for each experimental group were analyzed. Scale bar A and J 5 6 mm; D and M 5 0.7 mm.Figure 8
|
JNK2 isoform is involved in NMDA- mediated glutamate release. (A) Cumulative distributions of mEPSC amplitude (left) and iei (right) recorded from a single JNK isoform KO neuron in response to D-AP5 (50 mM). The traces on top are obtained from same neuron, in control conditions, during D-AP5 application and at D-AP5 washout. (B) Histograms of the median values expressed as percentage versus control (100%) of mEPSC amplitude (left) and iei (right) from n 5 8 JNK1 KO, n 5 7 JNK2 KO and n 5 6 JNK3 KO neurons in response to D-AP5. **p , 0.01 (t-test).JNK2 KO vs. D-AP5; fig. 8A; p . 0.05, Student’s t-test, control vs. JNK2
KO; fig. 8B) nor in amplitude (p . 0.05, K-S test, JNK2 KO vs. D-AP5;
fig. 8A; p . 0.05, Student’s t-test, control vs. JNK2 KO; fig. 8B). Overall
these electrophysiological data suggest that only the JNK2 isoform
mediates presynaptic release of glutamate under our experimental
conditions.
Discussion
Here we report that JNK2 protein is implicated in the control of the
presynaptic NMDA-evoked glutamate release in cortex. JNK has
been widely demonstrated to be downstream target of postsynaptic
NMDA receptors
39. Importantly, the NMDAR activity is linked to
the presence of JNK interacting protein 1 (JIP1) protein
28. Therefore
this intracellular signaling pathway involves the combined
inter-action of three partners: NMDAR, JIP1 and JNK. Although there is
general consensus that NMDA receptors are located only at the
post-synaptic site, few are the evidences that NMDAR are also present at
the presynaptic site where they control neurotransmitter release
26,40.
However it has never been directly demonstrated, at the presynaptic
site, that the NMDAR activity is mediated by the interaction with
JIP1 and JNK. To date, only few works have proposed a presynaptic
role for JNK. In PC12 cells it has been shown that JNK, activated by
nerve growth factor (NGF), controls Ca
21-evoked release due to
direct phosphorylation of synaptotagmin-4 (SYN4)
41. However, this
protein is known to be located either pre or postsynaptically. Recent
findings suggested that JNK can be stimulated by NGF via
presynap-tic p75
NTRreceptor
16. Furthermore, JNK3 has been shown to be
involved in the molecular organization of the presynapse
42. Using
presynaptic release assay, together with biochemical, imaging and
electrophysiological experiments, here we identify for the first time
that JNK is also present at presynaptic sites. Specifically we defined
that JNK plays an essential and specific role in controlling glutamate
release mediated by presynaptic NMDAR in cortical nerve endings.
Release experiments were performed on synaptosomes in a
super-fusion system
13where each event affecting glutamate release is
attrib-utable only to the functional presynaptic compartment. To inhibit
JNK protein activity we have used a commercial cell-permeable
pep-tide (L-JNKi1) containing an effector part, JNK binding domain
(JBD), linked to a cargo sequence, i.e. the 10 amino acid long arginine
rich domain of the HIV-1 Tat protein (48–57). The effect of L-JNKi1
at the presynaptic compartment could be justified since we have
demonstrated, for the first time, the presynaptic expression of both
JIP1 and JNK by using a synaptic fractionation protocol.
Our biochemical experiments on isolated cortical presynaptic
terminals show that, among the applied stimuli, only NMDA induces
JNK phosphorylation. This effect was slightly but not significantly
reduced by L-JNKi1 since, as already published for D-JNKi1
43,44,
L-JNKi1 does not block JNK activation but its downstream effect. In
addition, using synaptosomes fractionation analysis, we showed that
NMDA stimulus increases JNK phosphorylation at the presynaptic
fraction, confirming the presynaptic activation of JNK.
L-JNKi1 prevented the NMDA-, but nor the KCl- or
AMPA-evoked glutamate release. This peptide competes with the JNK
bind-ing domain (JBD) disruptbind-ing the interaction between JIP1 and JNK,
consequently the downstream activity of JNK is blocked
31. Our data
strongly suggest that presynaptic JNK signaling pathway might be
selectively engaged following NMDA receptor activation. This
obser-vation is further supported by the measurement of vesicle exocytosis
by using a well established method
45,46. By means of a fluorescent dye
(Synaptogreen) preloaded in presynaptic vesicle, it is possible to
follow the decrease of fluorescence when the dye is released in the
extracellular space. We observed a reduction in fluorescence
intens-ity during exposure to NMDA which was prevented by L-JNKi1,
indicating once again that presynaptic JNK controls NMDA-evoked
release. The peptide effect is not imputable to the Tat-containing part
that does not produce any effect on glutamate release. In fact, either
HIV-1 Tat or 20-mer Tat (41–60) show a potentiating effect of the
NMDA responses
47,48, while smaller Tat peptide (41–60) augmented
acetylcholine release
49. In line with these findings, here we show that
Tat (41–60) and Tat (31–50), containing the 48–57 aa sequence, did
not affect glutamate release.
An additional experiment to evaluate the exocytosis in cortical
synaptosomes has been done using time-lapse imaging. Among the
stimuli used only NMDA-evoked Synaptogreen exocytosis was
reduced by L-JNKi1 application which corroborate our previous
results. In addition, also our electrophysiological findings conducted
in mouse cortical slices revealed a functional role of JNK in mediating
the NMDA-induced glutamate release.
In support of our data a more stable form of L-JNKi1, D-JNKi1,
reduced excitotoxicity and protected against cerebral ischemia
44,50,
and albeit only postsynaptic activity was studied, a presynaptic effect
cannot be ruled out.
In order to identify which JNK isoform is involved in
neurotrans-mitter release during NMDA stimulation we also employed JNK
transgenic knock-out mice
21. JNK3 deletion leads to protection from
excitotoxicity
51and hypoxia
52, while JNK1 and JNK2 seem to be
important for apoptosis during brain development
19. Using
knock-out mice for single JNK isoforms, we report that JNK2 is the critical
player involved in this presynaptic phenomenon. Notably JNK2 KO
mice display a dramatic reduction of NMDA-evoked release, being
associated with a decreased NMDA-elicited JNK activation, as
demonstrated by western blot experiments.
Electron microscopy experiments were performed on cortical
synaptosomes and, as previously reported
9, the synaptosomal
mor-phology was well preserved. Whereas JNK1
53and JNK3
42have been
associated with a synaptic presence and function, on the other hand
JNK2 was only reported to be localized between the cytoplasm and
the nucleus
54. Here, by immunogold staining, we have clearly
iden-tified the presence of JNK2 at both post- and pre-synaptic site. These
results were confirmed and extended in confocal microscopy where a
quantitative approach allowed to get more information of JNK 2
expression pattern. Colocalization experiments indicate that JNK2
is expressed in synaptic puncta in high proportion. This observation
supports our functional data demonstrating that JNK2 can interfere
with the SNARE complex machinery thereby controlling glutamate
release. Finally, also our electrophysiological recordings highlight
that JNK2 KO mice display reduced miniature EPSCs attributable
to activation of presynaptic NMDA receptors.
Altogether our data led us to conclude that JNK is also localized at
presynaptic site being able to control glutamate release evoked by
NMDA stimulus.
We here describe that specifically the isoform 2 of JNK cooperates
with NMDA receptors in regulating glutamate release. In the
experi-ment in which the synaptic exocytosis was measured, the inhibition
of JNK activity reduces neurotransmitter release when NMDA is
applied. This leads to speculate that the mechanism by which
NMDA controls glutamate overflow might pass through an
inter-action between JNK2, presynaptic JIP1 and other proteins of the
release machinery. This aspect needs further investigation in future
work.
In light of the mounting evidence indicating the involvement of
JNK signaling in different diseases
55, the present findings highlight a
presynaptic localization and function of JNK2. This protein will
represent a novel and selective target to modulate release-regulating
NMDA autoreceptors, whose activation reinforces glutamate release
from the presynaptic component of asymmetric synapses then
con-trolling excitatory transmission in CNS.
Methods
Animals and brain tissue preparation.C57BL6/J and JNK knock-out (KO) (JNK1 – JNK2 – JNK3)21mice, 5 months old male and female, were killed by decapitation in accordance with the guidelines established by the European Communities Council (Directive 2010/63/EU of 22 September 2010) and accepted by the Italian Ministry of
Health and approved by the Ethical Committee on animal experiments of EBRI ‘‘Rita Levi-Montalcini’’ Foundation (Rome, Italy). Brains were rapidly dissected out on ice in order to collect cortical tissues. All the procedures necessary to prepare the brain fractions were done at 0–4uC.
JNK knock-out animals.Adult male and female of transgenic JNK KO (JNK1 – JNK2 – JNK3) mice were obtained by R.J. Davis from University of Massachusetts. They have been generated by knocking down each member of the JNK family (JNK1, Ref. 35; JNK2, Ref. 56; JNK3, Ref. 51) and maintained as homozygotes on a C57BL/6 genetic background.
Synaptosome preparation.Purified synaptosomes were prepared as previously described11,13,57. Briefly, the tissue was homogenized in 10 volumes of 0.32 M sucrose, buffered to pH 7.4 with Tris-(hydroxymethyl)-amino methane [Tris, final concentration (f.c.) 0.01 M] using a glass/Teflon tissue grinder (clearance 0.25 mm); the homogenate was centrifuged at 1,000 3 g for 5 min to remove nuclei and debris and the supernatant was gently stratified on a discontinuous Percoll (Sigma Aldrich, Italy) gradient (2%, 6%, 10% and 20% v/v in Tris-buffered sucrose) and centrifuged at 33,500 3 g for 5 min. The layer between 10% and 20% Percoll (synaptosomal fraction) was collected and washed by centrifugation. The synaptosomal pellets were resuspended in a physiological solution (Standard Medium) with the following composition (mM): NaCl, 140; KCl, 3; MgSO4, 1.2; CaCl2, 1.2; NaH2PO4, 1.2; NaHCO3, 5; HEPES, 10; glucose, 10; pH 7.2–7.4.
Synaptosomal glutamate release.Cortical synaptosomes were incubated for 45 min at 37uC in a rotary water bath in the presence of [3H]D-aspartate ([3H]D-ASP (final concentration 50 nM). When indicated, L-JNKi1 (2 mM) was added in the incubation medium for 30 min. After the labeling period, synaptosomes were maintained and superfused with physiological solution at 37uC layered in a Superfusion System (Ugo Basile, Comerio, Varese, Italy) for 48 min.
After 36 min of re-equilibration period, four consecutive 3 min fractions (termed b1 to b4) were collected. N-Methyl-D-aspartic acid (NMDA) (100 mM) and glycine (1 mM), (S)-a-Amino-3-hydroxy-5-methyl-4-isoxazolepropionic acid ((S) AMPA) (50 mM), or (HIV-1)-encoded transactivator of transcription (Tat) 41–61 (2 nM) and Tat 31–51 (2 nM) were applied at the end of the first fraction collected (b1) and maintained in the superfusion medium till the end of the superfusion period. In NMDA experiments the medium was replaced, at t 5 20 min, with a Mg21-free ions solution to permit NMDAR activation. In KCl experiments synaptosomes were transiently (90 s) exposed, at t 5 39 min, to high K1containing medium (8 mM). In these experiments, fractions were collected according to the following scheme: two 3 min fractions (basal release), one before (t 5 36–39 min) and one after (t 5 45– 48 min) a 6 min fraction (t 5 39–45 min; evoked release). Fractions collected and superfused synaptosomes were counted for radioactivity. The amount of radioactivity released into each superfusate fraction was expressed as a percentage of the total synaptosomal tritium content at the start of the fraction collected (fractional efflux). Agonist and high K1-induced effects were estimated by subtracting the neurotrans-mitter content into the fractions corresponding to the basal release from those cor-responding to the evoked release.
Measurements of synaptic vesicle exocytosis. Spectrophotometer measurements. Synaptogreen (SIGMA-ALDRICH, Italy), also known as FM1-43, was used to measure synaptic vesicle fusion with the plasma membrane as previously described45,46. In brief, synaptosomes (0.3 mg/mL) were incubated in 2 ml of Standard Medium for 2 min at 37uC in mild agitation. Synaptogreen (50 mM) was added and after 1 min stimulation with NMDA (100 mM) and glycine (1 mM) was applied to load the fluorescent dye. After 3 min, synaptosomes were washed twice to remove non-internalized Synaptogreen in Standard Medium containing 1 mg/mL BSA. Synaptosomes (200 mg of proteins) were then resuspended in 2 mL of Mg21 -free Standard Medium, and incubated in a stirred and thermostated cuvette maintained at 37uC in a RF-5301PC spectrofluorophotometer (Shimadzu, Japan). Release of accumulated Synaptogreen was induced by the addition of NMDA (100 mM) and glycine (1 mM) after 10 min of re-equilibration, and measured as the decrease in fluorescence upon release of the dye into solution (excitation 510 nm, emission 625 nm) for 6 min after stimulus. Data points were obtained at 2 s intervals, and data presented as the Ca21-dependent decrease in FM1-43 fluorescence. The synaptosomes were pre-incubated, when indicated, with L-JNKi1(Sigma-Aldrich, USA) for 30 min before depolarization with NMDA and glycine. The average of the fluorescence of the last 20 registered points are compared to the one at the stimulus point. The value is expressed as percentage of decreased fluorescence after stimulus for each trace.
Microscopy measurements.Synaptosomes were seeded on coverslips in Standard Medium for staining procedures. FM1-43 loading into synaptic vesicles was per-formed as described above for spectrophotometer measurements and placed on a time-lapse system mounted on an inverted fluorescence microscope (TiE; Nikon, Japan), equipped with an incubation chamber (Okolab), a cooled CCD camera (Clara; Andor), Perfect Focus System to avoid z-axis focus fluctuations and a Niss Elements imaging software (Nikon). Video recordings were performed with a 40 3 oil objective (N.A 1.4) for 6 (30 mM KCl) or 30 min (NMDA 100 mM 1 glycine 1 mM) by taking 14 bit images every 2 s at room temperature (25uC). Fluorescence was recorded and video images were analyzed by using the Spot module of the ImarisSuite 7.6H software (Bitplane A.G., Zurich, Switzerland) by selecting a 1.5 mm radius diameter of
fluor-escent puncta. Fluorescence intensity was measured in 15–20 randomly selected synaptosomes within the microscopic field. The criteria for fluorescence puncta inclusion in the data analysis were the spherical shape ranging between 0.5–1.5 micron and the stimulation-dependent destaining response. Destaining time courses were generated by normalization of each fluorescence spot trace. Quantification of FM1-43 responses was accomplished by calculating the average percentage of fluorescence loss. A group of control experiments was run to test the specificity of Synaptogreen loading and destaining. Ca21free medium drastically reduced the dye loading and inhibited the stimulus-induced dye release. The Synaptogreen photo-bleacing rate was also measured in absence of the stimulus and compared to the stimulated Synaptogreen destaining traces for each experimental group. Stimulation of synaptosomes in biochemical experiments.Stimulation of synaptosomes was performed in batch as previously reported27. Re-suspended synaptosomes were divided into 0.2 ml aliquots and gently agitated at 37uC until stimulation. Following 20 min mild agitation at 37uC, JNK inhibitor L-JNKi1 (2 mM) or NMDA receptor inhibitor D-AP5 (50 mM) were added as indicated and left for 30 min at 37uC before stimulus and till the end of the experiments. Synaptosomal suspensions were subjected to differential stimulation (see Results for details) with either NMDA (100 mM) 1 glycine (1 mM) or AMPA (100 mM) for 10 min at 37uC. KCl (8 mM) stimulus was added for 90 seconds after which 0.2 ml of warm medium containing inhibitors, where needed, was added.
The experiments were terminated by adding 0.6 ml of cold HEPES buffer and immediate centrifugation at 12,000 3 g to pellet the synaptosomes. In NMDA stimulation experiments, external Mg21ions were omitted to avoid the functional inactivation of the receptor.
The final pellets were lysed in ,100 ml of Lysis Buffer solution (LB) made up of 1% Triton X-100 (Serva, Germany), complete protease inhibitor cocktail solution (Serva, Germany), phosphatase inhibitor cocktail solution (Serva, Germany) and the fol-lowing components (mM): TRIS acetate, 20; sucrose, 0.27; EDTA, 1; EGTA, 1; Na Orthovanadate, 1; NaF, 50; Na Pyrophosphate, 5; Na b-glycerophosphate, 10; DTT, 1.
Protein concentrations were then determined by Bradford assay and the samples were directly analyzed by immunoblotting following resuspension in Laemmli buffer. Ultrastructural fractionation.As reported in Ref. 9, after stimuli or just after preparation, synaptosomes were pelleted and resuspended in 300 mL HEPES buffer (4uC; pH 7.4) and 50 mL was removed and kept as a total. Synaptosomes were pelleted by centrifugation (16 000 g; 5 min; 4uC) and resuspended in 300 mL 0.32 m sucrose and 0.1 mm CaCl2. Protease inhibitors were used in all extraction steps.
Synaptosomal solution was further diluted 1510 in ice-cold 0.1 mm CaCl2and then mixed with an equal volume of 2 3 solubilisation buffer (2% Triton X-100, 40 mm Tris, pH 6.0; 4uC). Following 30 min incubation at 4uC the insoluble material (synaptic junctions) was pelleted by centrifugation (40 000 g, 30 min, 4uC). The supernatant (NSSP) was decanted and proteins precipitated with 6 volumes of acetone at 220uC and centrifuged (18 000 g; 30 min; –15uC). The synaptic junction pellet was resuspended in 10 volumes of 1 3 solubilisation buffer (1% Triton X-100, 20 mm Tris, pH 8.0; 4uC) and incubated for 30 min at 4uC and then centrifuged (40 000 g, 30 min, 4uC). The pellet contained the insoluble postsynaptic density and the supernatant contained the presynaptic active zone. The protein in the supernatant (presynaptic fraction) was acetone precipitated and collected as above. Proteins were then treated for Western Blot (WB) analysis.
Immunofluorescence.Immediately after preparation synaptosomes were seeded on coverslip coated with Poly-L-Lysine (50 mg/ml), washed twice with PBS and fixed in 2% (w/v) freshly prepared paraformaldehyde in PBS for 10 min at room temperature. After four washes synaptosomes were permeabilized with 0.05% (v/v) Triton X-100/ PBS for 5 min, washed and incubated overnight in a mix solution of the following primary antibodies: rabbit JNK2 (Santa Cruz, USA) and mouse anti-Synaptotagmin I (Santa Cruz, USA), or rabbit anti-JNK2 and mouse anti-SNAP25 (SMI 81) (Covance, USA). All primary antibodies were diluted 15200 in 0.05% (v/v) Triton X-100/PBS at 4uC. Unbound antibody was removed by four washes 10 min each with PBS at room temperature. Bound antibody was detected by incubation with donkey anti-rabbit Alexa 488 (15500) and donkey anti-mouse Alexa 555 (15600) conjugated secondary antibodies (Invitrogen, USA) at 4uC for 2 h. After three washes with PBS at room temperature, coverslips were mounted on slides with
HydromountTMmounting gel. Controls were performed by omitting the primary antibodies.
Confocal microscopy and image analysis.Slides were examined under a confocal laser scanning microscope (Leica SP5, Leica Microsystems, Wetzlar, Germany) equipped with 4 laser lines and a transmitted light detector for differential interference contrast (DIC; Nomarski) imaging. Confocal acquisition setting was identical between slides. Bright field images of the synaptosomes were corrected for homogeneities of the brightness across the image by using Adobe Photoshop high-pass filter. Contrast of synaptosome edges was enhanced with ImageJ CLAHE (Contrast Limited Adaptive Histogram Equalization; http://rsbweb.nih.gov/ij/ plugins/clahe/index.html) filter plugin. For production of figures, brightness and contrast of images were globally enhanced by using linear histogram correction and images were slightly oversaturated. Image analysis was performed by using Imaris Suite 7.4H or Image J 1.4 (imagej.nih.gov/ij/) softwares on seven different images derived from each group. Image analysis was performed under visual control to determine thresholds that subtracts background noise and takes into account
synaptosomes structures. For all image-processing steps, the images were compared with the original raw data to make sure that no structures were introduced that were not seen in the original data series or that structures present in the original data series were not removed. To determine fluorescent signal colocalization between different channels the ImarisColoc module was used. Before colocalization analysis, a median filter was applied to the images to reduce the background noise and source channels threshold were established by automatic thresholding of the P Value. The degree of channels colocalization was analyzed by considering the following indexes: the % of dataset colocalized (colocalized area), thresholded Manders’s coefficient A and B, Pearson’s coefficient in colocalized area. To evaluate the amount of the total synaptosomoal area several masks, by using Imaris Surface module, were manually drawn enclosing the entire synaptosomes visualized through the light transmitted channel. Inside these masks, to evaluate the relative immunofluorescent areas a mask for each channel was automatically drawn using the Imaris Surface module. To evaluate the spatial relations between channels intensity we used the ImageJ tool Plot Profile to create a plot of fluorescence intensity values across a line drawn on the image.
Samples preparation for electron microscopy.Synaptosomal fraction was fixed in 2.5% glutaraldehyde (Electron Microscopy Science-EMS) in 0.05 M phosphate buffer pH 7.4 for 3 hours at room temperature, post-fixed in 1% osmium tetroxide (Electron Microscopy Science-EMS), dehydrated in graded acetone and embedded in Spurr (Epoxy resin, EMS). For a morphological analysis, semithin sections (1 mm thick) were cut on a Reichert-Jung Ultracut ultramicrotome and stained with toluidine blue. Ultrathin sections were cut and stained with uranyl acetate and lead citrate, then examined with a Zeiss electron microscope.
For post-embedding immunolabeling, sections (80 nm) were placed on 200-mesh formvar carbon nickel grids (EMS), etched in 1% sodium periodate for 60 min and in H2O2 1% for 15 min. Residual aldehyde groups were quenched with 0.05 M glycine in PBS, pH 4 for 20 min. After 30 minutes incubation in blocking buffer (phosphate buffer solution pH 7,4 added with 5% bovine serum albumin), the samples were incubated with polyclonal anti-JNK2 antibody (1520; SC-827 NH2-terminal S. Cruz) in phosphate-buffered saline added with 1% bovine serum albumin (incubation buffer) overnight at room temperature. After washing, samples were incubated in incubation buffer with goat anti-rabbit secondary antibody conjugated to 10-nm gold particles (1510; AURION Immuno Gold Reagents & Accessories, Wageningen, the Netherlands) for 3 hours at room temperature. Samples were washed in incubation buffer, then in distilled water and counterstained with saturated uranyl acetate solution in H2O for 1 hour. Grids were air-dried and viewed under the electron microscope.
Electrophysiology.C57BL6/J or JNK KO mice (2–3 months old) were anesthetized with halothane and killed by decapitation. The brain was rapidly removed from the skull, and combined entorhinal-hippocampal slice were cut (250 mm) in cold artificial cerebrospinal fluid (ACSF) using a vibratome, according to the method described by Jones and Heinemann58. ACSF composition was (mM): NaCl, 124; KCl, 3.0; MgCl
2, 1.0; CaCl2, 2.0; NaH2PO4, 1.25; NaHCO3, 26; glucose, 10; saturated with 95% O2, 5% CO2(pH 7.4). After an incubation period of 1 h in ACSF at 33.5uC, slices were maintained at room temperature or transferred to a submerged recording chamber (2.5–3 ml min-1, 33.5uC), on the stage of an upright microscope (Eclipse FN1, Nikon, Italy), equipped for infrared video microscopy (Hamamatsu, Japan).
Layer II neurons of the EC were recorded in whole-cell patch-clamp configuration using 1.5 mm borosilicate glass electrodes (3–4 MV) pulled with a vertical puller (PP-83 Narishige, Japan) in voltage-clamp mode59. Filling solution containing (in mM): CsMeSO4, 130; HEPES, 5; EGTA, 0.5; MgCl2, 1; NaCl, 1; CaCl2, 0.34; QX-314, 5 and MK-801, 1; adjusted to pH 7.3 with CsOH. Unless otherwise stated, neurons were held at 270 mV. Current signals were filtered at 2 kHz and digitized at 10 kHz using a Multiclamp 700 B differential amplifier linked to a Digidata 1440A, operated by the pClamp10 software (Molecular Devices, USA). No series resistance compensation was implemented, in order to keep a low signal-to-noise ratio, however, series res-istance and whole-cell capacitance were monitored continuously during the experi-ment and recordings were discarded if series resistance changed by more than 15% from control conditions. Spontaneous synaptic events were analyzed offline using the pClamp10 software package (Molecular Devices, USA). The spontaneous events were detected from 3 min trace records, through an algorithm based on the minimization of the sum of squared errors between data and a template function. Single template waveforms were created by averaging a number of spontaneous events following a visual inspection of a representative trace in each cell. The template-matching threshold was set between 5 and 5.5, providing a good balance to avoid detection of false events.
Western Blot.Equal amount of proteins (,15 mg for each condition) were resolved by 10% SDS-polyacrylamide gels and blotted onto PVDF membrane (Serva, Germany). The resulting blot was blocked for 1 h at room temperature using Tris-buffered saline-Tween (t-TBS) (M) Tris, 0.02; NaCl, 0.15; Tween 20, 0.1%) containing 5% skimmed milk. The membranes were then incubated overnight at 4uC with specific antibodies: rabbit phospho-SAPK/JNK (Thr 183/Tyr185) (p-JNK) 15500 (Cell Signaling, USA) this antibody recognizes altogether the phosphorylated bands (46 and 54 kDa) of JNK1, JNK2 and JNK3, rabbit SAPK/JNK 151000 (Millipore, Italy) this antibody recognizes altogether the bands (46 and 54 kDa) of JNK1, JNK2 and JNK3, mouse b-actin 1530000 (Sigma Aldrich, Italy), mouse anti NR1 151000
(Millipore), mouse anti NR2a and NR2b 151000 (Millipore), rabbit anti GluA1 and GluA2 151000 (Millipore).
After 50 min of wash in t-TBS, the blots were incubated for 1 h at room temper-ature with peroxidase-conjugated goat anti-rabbit or anti-mouse IgG secondary antibodies (UCS Diagnostic).
After 50 min of washes in t-TBS bands immunoreactivity was detected by enhanced chemiluminescence (ECL; WESTAR, Cyanagen, Italy). In all experiments where an evaluation of phosphorylated proteins was required, pan antibodies were applied on the same membranes after stripping procedure (stripping buffer from SignaGen, USA).
Statistical Analysis.In release experiments, analysis of variance was performed by ANOVA followed by Newman-Keuls multiple-comparison test, when comparing only a single treatment group a Student’s two-tailed t-test was used. Data were considered significant for p , 0.05 at least. Appropriate controls with enzyme inhibitors were always run in parallel.
Statistical analysis for biochemical experiments was performed with GraphPad PRISM 4 (GraphPad Software, USA). Values shown represent the mean 6 SEM of a different number of separate experiments (as indicated in figure legends). One-way or Two-ways ANOVA followed by Tukey’s test was carried out when intergroup com-parisons were required.
Changes in miniatures events amplitude or inter-event interval was determined by comparison of their cumulative distributions, with the Kolmogorov-Smirnov (K-S) test, or by comparison of their median values, using the 2-tailed Student t-test. The threshold for statistical significance was set at p , 0.05.
1. Hack, N. & Bala´zs, R. Selective stimulation of excitatory amino acid receptor subtypes and the survival of granule cells in culture: effect of quisqualate and AMPA. Neurochem. Int. 25, 235–41 (1994).
2. Yang, X.-R. et al. Involvement of MAPK pathways in NMDA-induced apoptosis of rat cortical neurons. Sheng Li Xue Bao 64, 609–16 (2012).
3. Collingridge, G. L. & Lester, R. A. Excitatory amino acid receptors in the vertebrate central nervous system. Pharmacol. Rev. 41, 143–210 (1989).
4. Headley, P. M. & Grillner, S. Excitatory amino acids and synaptic transmission: the evidence for a physiological function. Trends Pharmacol. Sci. 11, 205–11 (1990).
5. Rothman, S. M. & Olney, J. W. Excitotoxicity and the NMDA receptor--still lethal after eight years. Trends Neurosci. 18, 57–8 (1995).
6. Choi, D. W. & Rothman, S. M. The role of glutamate neurotoxicity in hypoxic-ischemic neuronal death. Annu. Rev. Neurosci. 13, 171–82 (1990).
7. Meldrum, B. & Garthwaite, J. Excitatory amino acid neurotoxicity and neurodegenerative disease. Trends Pharmacol. Sci. 11, 379–87 (1990). 8. Corlew, R., Brasier, D. J., Feldman, D. E. & Philpot, B. D. Presynaptic NMDA
receptors: newly appreciated roles in cortical synaptic function and plasticity. Neuroscientist 14, 609–625 (2008).
9. Feligioni, M., Holman, D., Haglerod, C., Davanger, S. & Henley, J. M. Ultrastructural localisation and differential agonist-induced regulation of AMPA and kainate receptors present at the presynaptic active zone and postsynaptic density. J. Neurochem. 99, 549–60 (2006).
10. Pinheiro, P. S. et al. Presynaptic kainate receptors are localized close to release sites in rat hippocampal synapses. Neurochem. Int. 47, 309–16 (2005).
11. Grilli, M. et al. In vitro exposure to nicotine induces endocytosis of presynaptic AMPA receptors modulating dopamine release in rat nucleus accumbens nerve terminals. Neuropharmacology 63, 916–26 (2012).
12. Musante, V. et al. Presynaptic mGlu1 and mGlu5 autoreceptors facilitate glutamate exocytosis from mouse cortical nerve endings. Neuropharmacology 55, 474–82 (2008).
13. Pittaluga, A., Feligioni, M., Longordo, F., Luccini, E. & Raiteri, M. Trafficking of presynaptic AMPA receptors mediating neurotransmitter release: neuronal selectivity and relationships with sensitivity to cyclothiazide. Neuropharmacology 50, 286–96 (2006).
14. Perkins, D., Gyure, K. A., Pereira, E. F. R. & Aurelian, L. Herpes simplex virus type 1-induced encephalitis has an apoptotic component associated with activation of c-Jun N-terminal kinase. J. Neurovirol. 9, 101–11 (2003).
15. Sclip, A. et al. c-Jun N-terminal kinase regulates soluble Ab oligomers and cognitive impairment in AD mouse model. J. Biol. Chem. 286, 43871–80 (2011). 16. La Rosa, L. R. et al. Age-related changes of hippocampal synaptic plasticity in
AbPP-null mice are restored by NGF through p75NTR. J. Alzheimers. Dis. 33, 265–72 (2013).
17. Davis, R. J. Signal transduction by the JNK group of MAP kinases. Cell 103, 239–52 (2000).
18. Gupta, S. et al. Selective interaction of JNK protein kinase isoforms with transcription factors. EMBO J. 15, 2760–70 (1996).
19. Kuan, C. Y. et al. The Jnk1 and Jnk2 protein kinases are required for regional specific apoptosis during early brain development. Neuron 22, 667–76 (1999). 20. Weston, C. R. & Davis, R. J. The JNK signal transduction pathway. Curr. Opin. Cell
Biol. 19, 142–9 (2007).
21. Brecht, S. et al. Specific pathophysiological functions of JNK isoforms in the brain. Eur. J. Neurosci. 21, 363–77 (2005).
22. Yamasaki, T., Kawasaki, H. & Nishina, H. Diverse Roles of JNK and MKK Pathways in the Brain. J. Signal Transduct. 2012, 459265 (2012).