Università degli Studi della Tuscia di Viterbo
Dipartimento per la Innovazione dei sistemi Biologici, Agroalimentari e Forestali (DIBAF) Via S. Camillo de Lellis, 01100 Viterbo, Italy
Corso di Dottorato di Ricerca in Ecologia Forestale - XXIV ciclo Coordinatore: Prof. Paolo De Angelis
Tesi di Dottorato di Ricerca in Ecologia Forestale Tutor: Dr. Mauro Centritto
Autore: Emanuele Pallozzi Marzo 2012
Acknowledgements
First and foremost I offer my sincerest gratitude to my supervisor Dr. Mauro Centritto who has supported me throughout these three wonderful and intense years of interesting and worthwhile work.
I would like to express my gratitude to Dr. Enrico Brugnoli and Dr. Massimo Zacchini for hosting me at the IBAF institute of CNR, allowing me to perform my experiments.
It was easier to succeed in achieving my objectives with a great team work, it would have been quite impossible without Dr. Alessio Fortunati and Giovanni Marino and their priceless friendship. And only with the huge help of Prof. Tsonko Tzonev we were able to accomplish our results.
It is impossible not to mention Mauro Medori, Arianna Morani, Paola Tassone and Ettore D’Andrea for their friendship and continual stimulation in giving my best.
I also want to thank Dr. Francesco Loreto for his precious collaboration, Dr. Violeta Velikova, Prof. Tariq Mahmood, Dr. Carlo Calfapietra, Isabel Nogues and Fernando Migliaccio for their important collaboration in my work.
Dr. Silvano Fares was vital with his clear lessons and valuable help with PTR-MS, Maria Rita De Paolis was very kind helping me with examinations and statistics, Valentina Iori was my muffin pusher and Daniele Bianconi was unexpectedly calm in sharing our office.
Coffee breaks (and it was a great coffee, made by Sabrina, Daniela and Nicoletta) were an extraordinary relaxing corner while sharing stories with Chiara Rossini.
Technician are the pulsing heart of every institute, their support was determining. Led by captain Giuseppe Santarelli, I want to mention all of them in strictly alphabetical order: Alessandro Tomassetti, Anna Mariani, Cesarino Nicoletti, Ermenegildo (Dino) Magnani, Fabrizio Lelli, Fabrizio Morvillo, Leandro Brunacci, Marco Giorgetti, Pierangelo Bertolotto and Valerio Muzzini. It was a pleasure for me to work with Giorgio Matteucci and his team (Bruno, Mario, Flavia, Marco M., Marco B., Andrea and Antonia) and I want to thank them for the precious information about forest environment.
I want also to thank Laura Passiatore, Fabrizio Pietrini, Manuela Galli, Daniela Lippi, Daniela Di Baccio and Federico Brilli.
Thanks to the guys of IBBA institute (Giulio, Donato, Silvia, Nadia, Francesco, Giovanni, Elisabetta, Adelaide, Giovanna and Chiara) for the nice time spent with them.
English is easier with Adrian!
Field measurements in Follonica were unforgettable, thanks to Dr. Claudio Cantini, Alessandra and Andrea of IVALSA/CNR institute. Every moment spent there was special.
Each of you left your mark.
Lastly, and most importantly, I wish to thank my father and Daniela who supported me in this incredible journey.
Table of Contents
Chapter 1 – Introduction ... 1
1.1 BVOCs (Biogenic Volatile Organic Compounds) ... 1
1.2 Solar irradiance ... 6
1.3 Ultraviolet radiation and its effect on plants ... 7
1.4 Blue light ... 11
1.5 Aim of the study and outline of the thesis ... 12
Chapter 2 – Treatment facilities, plants and methods of analysis ... 13
2.1 Plants description ... 13
2.1.1 Populus x euroamericana ... 13
2.1.2 Quercus ilex L. ... 14
2.1.3 Citrus reticulata ... 14
2.1.4 Nicotiana tabacum L. ... 15
2.2 Gas exchange and chlorophyll fluorescence measurements ... 15
2.2.1 Mesophyll conductance calculation ... 16
2.3 Proton Transfer Reaction – Mass Spectrometry (PTR-MS) ... 17
2.4 Gas Chromatography – Mass Spectrometry (GC-MS) ... 20
2.5 BVOCs quantification in Citrus reticulata ... 20
2.6 Leaf reflectance measurements ... 22
2.7 Light System ... 22
2.8 Biochemical analysis... 23
2.10 Statistics ... 25
Chapter 3 – Effect of UV-B radiation on wild-type and transgenic Nicotiana tabacum plants. ... 26
3.1 Introduction ... 26
3.2 Matherial and methods ... 27
3.3 Results and discussion ... 28
Chapter 4 – Response to acute UV-A radiation in Populus x euroamericana plants ... 40
4.1 Introduction ... 40
4.2 Material and methods ... 41
4.3 Results and discussion ... 44
Chapter 5 – Study on BVOC emission, photosynthesis and mesophyll conductance in response to blue light ... 54
5.1 Introduction ... 54
5.2 Materials and methods ... 56
5.3 Results and discussion ... 57
Chapter 6 – Discussion ... 58
1
CHAPTER 1 – Introduction
1.1 BVOCs (Biogenic Volatile Organic Compounds)
All plants produce a vast and diverse assortment of volatile compounds such as nitric oxide, carbon monoxide, and non-methane volatile organic compounds, the so-called biogenic volatile organic compounds (BVOC). The great majority of these substances, traditionally referred to as secondary metabolites, do not appear to participate directly in growth and development, but their functions are being elucidated with increasing frequency. Despite BVOC emissions represents only 1-1.5% of total carbon exchanged between biosphere and atmosphere: i.e. ~1.5 Pg year-1 (Welp, 2011) of the total C cycle (circa 120-175 Pg year-1), BVOC emissions have received increased scientific attention in the last two decades because BVOCs are highly reactive and, thus, may profoundly influence the chemical and physical properties of the atmosphere. In fact BVOCs can remove hydroxyl radicals (∙OH) in the atmosphere quickly, indirectly causing accumulation of greenhouse gases like methane (Brasseur & Chatfield, 1991; Di Carlo et al., 2004). Moreover BVOCs can react with anthropogenic NOx emissions in presence of UV radiation, causing the formation of
photochemical smog, i.e, tropospheric ozone and secondary organic aerosols (Chameides et al., 1988; Kavouras et al., 1998).
Terpenoids perhaps are the most structurally varied class of plant natural products. The smallest terpenes contain a single isoprene unit (the five-carbon units that make up the terpenoids); as a group, they are named hemiterpenes (half-terpenes). C10 terpenoids, although they consist of two isoprene units, are called monoterpenes. The monoterpenes are best known as components of the volatile essences of flowers and of the essential oils of herbs and spices. The terpenoids that derive from three isoprene unit contain 15 carbon atoms and are known as sesquiterpenes (i.e., one and one-half terpenes). Like monoterpenes, many sesquiterpenes are found in essential oils. In addition, numerous sesquiterpenoids act as phytoalexins, antibiotic compounds produced by plants in response to microbial challenge, and as antifeedants that discourage opportunistic herbivory. The abscisic acid is structurally a sesquiterpene. The diterpenes, which contain 20 carbons (four C5 units), include phytol (the hydrophobic side chain of chlorophyll), the gibberellin hormones, the resin acids of conifer and legume species, phytoalexins, etc.
The best known hemiterpene is isoprene (2-methyl-1,3-butadiene), a volatile, highly reactive non-methane hydrocarbon (NMHC) released from photosynthetically active tissues. Isoprene is the most abundant phytogenic VOC and is emitted in copious quantities by many forest species (Kesselmeier
2 & Staudt, 1999; Fall, 1999; Guenther et al., 1999). Isoprene is produced enzymatically, released from photosynthetically active tissues in the light and emitted through stomata to the atmosphere (Sharkey & Yeh, 2001). The enzyme isoprene synthase is present in the leaf plastids of numerous C3 plant species. Isoprene biosynthesis is light dependent and is closely linked with carbon metabolism at ambient CO2 concentration (Monson & Fall, 1989; Loreto & Sharkey, 1990). By
feeding 13CO2 to leaves it has been demonstrated that about 72-91% of the carbon in the isoprene
molecule originates from recently assimilated photosynthetic intermediates and that the remaining carbon is derived from alternative sources (Sanadze et al., 1972; Delwiche & Sharkey, 1993; Karl et al., 2002; Affek & Yakir, 2003; Funk et al., 2004; Schnitzler et al., 2004; Brilli et al., 2007). Temperature is a major factor controlling isoprene emission, with two- to four-fold higher rates of emissions for each 10 °C increase in temperature (Sharkey & Yeh, 2001; Fares et al., 2011). Thus, rising temperature will likely outweigh the inhibitory effects of elevated [CO2] on isoprene
emission (Rosenstiel et al., 2003; Centritto et al., 2004; Fares et al., 2011), leading to future increased ozone formation which, in turn, will negatively affect plant photosynthesis and growth. The principal function of isoprene biosynthesis in plants remains unclear, but isoprene acts as a thermoprotective molecule, potentially stabilizing chloroplast membranes during high temperature events (Singsaas et al., 1997; Singsaas and Sharkey 2000; Behnke et al. 2007). Because isoprene production is enhanced by both high temperatures and light, it has been proposed to maintain photosynthetic capacity during rapid leaf temperature fluctuations caused by sun flecks in the canopy (Sharkey and Singsaas 1995; Behnke et al. 2010). Several experiments showed in fact that isoprene can protect plants against short high-temperature episodes (Singsaas et al., 1999; Singsaas & Sharkey, 1998) and it can interact with the phospholipid bilayer of membranes to maintain membrane stability during high temperature events (Siwko et al. 2007).
Despite isoprene can react with NOx, producing dangerous hydroperoxides in the atmosphere
(Hewitt et al., 1990), in planta isoprene seems also to act as an antioxidant protecting plants against ozone (Loreto & Velikova, 2001). When the oxidation potential becomes high, such as under acute or prolonged ozone exposures, isoprene quenches ozone-dependent ROS, attenuating the damage at the membrane level and probably the consequent damage at biochemical and physiological levels (Loreto & Velikova, 2001). This antioxidant function should be even more important during simultaneous light and heat stress, when thermotolerance and reactive oxygen quenching mechanisms are needed (Peñuelas et al. 2005). Many studies have also pointed out the importance of BVOCs in plant-insect-environment interaction, highlighting how these compounds, both
3 induced or constitutive, can attract specific species and can also be a powerful deterrent against pathogens and herbivores (Gershenzon & Dudareva, 2007; Brilli et al. 2009).
Methanol and acetaldehyde emissions are generally associated to changes in the cell wall structure and demethylation of pectin (Galbally & Kirstine, 2002). This can be caused by growth processes, mechanical wounding and other stress occurrence. Considerable but transient emission of methanol in the atmosphere is therefore associated to cell wall damage occurring because of wounding (Karl et al., 2001). Methanol formation in leaves may also be associated with as expansion growth, i.e. cell wall loosening during cell expansion (Nemecek-Marshall et al., 1995), and in senescing leaves, because of irreversible decomposition of cell walls (Fall, 2003). Acetaldehyde is principally formed by the enzymatic oxidation of ethanol, which is formed in roots under anoxic conditions and is then translocated to leaves through the transpiratory stream (Kreuzwieser et al., 1999). Consistently, large fluxes of acetaldehyde have been observed when roots are flooded and are exposed to anoxia (Kreuzwieser et al., 2000). Furthermore, acetaldehyde is also emitted following wounding (Fall et al., 1999) and after ozone stress episodes (Cojocariu et al., 2005).
BVOC emissions are generally closely linked to carbon assimilation in many forest and agriforest species, which are the main BVOC emitters, but they play a contrasting role in the biosphere-atmosphere interaction. In fact, forest and agriforest vegetation is a dominant sink for the atmospheric CO2 and ties about 90% of the globe’s biomass carbon. Thus, it plays, by mean of
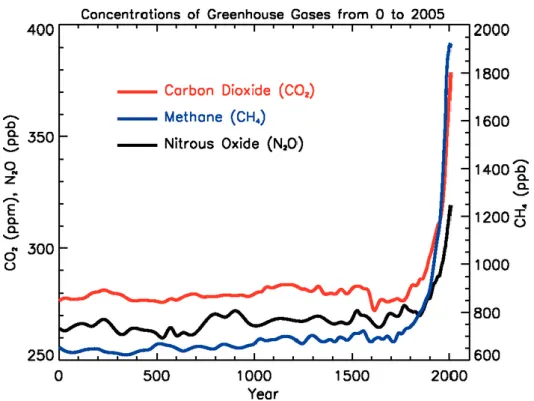
photosynthesis, a key role in mitigating global change. In contrast, BVOCs have an important, negative impact in atmospheric chemistry, because they play a major role in the production of tropospheric ozone and aerosols. BVOCs rapidly react with anthropogenic and natural compounds and particularly with nitrogen oxides in the atmosphere leading to the formation of tropospheric ozone and photochemical smog. Furthermore, BVOCs affect the residence time of other greenhouse gases (including methane), and may cause the formation of secondary aerosols, a component of PM10 in the atmosphere. This emphasizes the importance of biogenic emissions, and inventories of BVOC emissions are, thus, a key issue in atmospheric sciences. Moreover, given the importance of both BVOC emissions and carbon assimilation for the biosphere-atmosphere interactions, the consequences of climate change (rising [CO2] and temperature, Fig. 1.1) for the biogeochemical
carbon cycle and for the atmospheric chemistry are potentially extremely large. Thus, a thorough understanding of BVOC synthesis mechanisms and plant and ecosystem responses to climate change is required if future emissions are to be reliably predicted.
Climate change has been going on since the earth first existed, but it has been accelerated by human activities starting from the industrial revolution (Donaghy, 2007). The use of fossil fuels to produce
4 energy has caused an increasing in the atmospheric concentration of carbon dioxide (CO2). The
global atmospheric CO2 concentration increased from a pre-industrial value of about 280 ppm to
379 ppm in 2005 (IPCC, 2007a). The annual CO2 concentration growth rate, along the previous 10
years, was 1.9 ppm per year. This increment in CO2 atmospheric concentration is the most
important factor that causes global temperature increase: because of its chemical and physical characteristics CO2 is able to absorb thermic infrared radiations so that more infrared radiation is
reflected back to the Earth by the atmosphere, leading to an increased temperature of the surface of the Earth (Mitchell, 1989).
Figure 1.1: atmospheric concentration of important long-lived greenhouse gases over the last 2,000 years. Increases since about 1750 are attributed to human activities in the industrial era (IPCC 2007: Working Group I: The Physical Science Basis).
Tropospheric ozone is a highly reactive gas that damages any living tissue with which it comes in contact. It has been increasing at a faster rate than CO2. Prior to large-scale emissions of pollutants,
ozone concentrations were relatively low, however, since the Industrial Revolution concentrations have increased several-fold. While ozone is a naturally occurring constituent of the atmosphere, fossil fuel combustion has increased the emission of the precursor to ozone formation by more than an order of magnitude from pre-industrial concentrations (Fowler et al., 1998). In order for ozone to
5 form, both volatile organic compounds (VOC) and nitrogen oxides (NOx) must exist in the presence
of sunlight. Both anthropogenic activities and natural processes release VOCs to the atmosphere, including fuel consumption, byproducts of industrial processes, forest fires, natural geologic emissions (Etiope & Ciccioli, 2009) and secondary compounds released from vegetation. The release of NOx occurs naturally as a result of biological activity in soils, lightning, forest fires, etc,
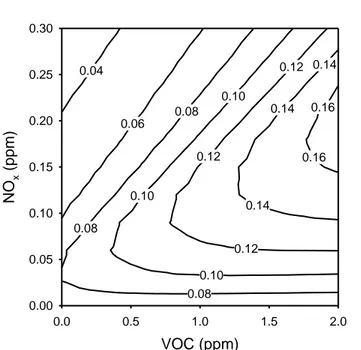
but the release as a result of anthropogenic activities far exceeds that from natural sources (Fowler et al., 1998). Ozone formation is relatively complex and is dependent on the relative concentrations of the precursors. For example, maximum ozone formation will occur with optimal concentrations of NOx for a given concentration of VOCs (Fig. 1.2) (Bernacchi et al., 2012). Higher or lower
concentrations of either of these will result in a decrease in the formation of ozone. Ozone concentrations are predicted to continue increasing over the next 50 years with average concentrations reaching 20% over current, although changes in ozone formation are variable. Some locations are experiencing rapid increases in ozone formation while other locations are experiencing decreases (Forster et al., 2007).
6 0.14 0.16 0.16 0.14 0.12 0.10 0.08 0.12 0.14 0.10 0.12 0.08 0.06 0.10 0.04 0.08 VOC (ppm) 0.0 0.5 1.0 1.5 2.0 NO x (ppm ) 0.00 0.05 0.10 0.15 0.20 0.25 0.30
Figure 1.2: an ozone isopleth graph modeled for Champaign, IL USA on August 15, 2008. The lines on the plot show the predicted ozone concentration (ppm) for a given concentration of the two main precursors, nitrogen oxides (NOx)
and volatile oxygenic compounds (VOC). Note that for a given concentration of VOC (from Bernacchi et al., 2012).
1.2 Solar irradiance
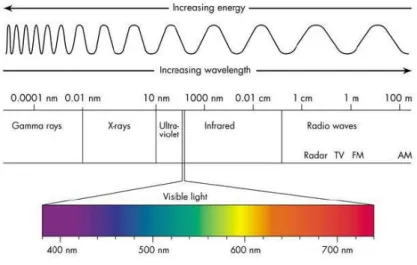
Solar irradiance is the radiation emitted by the sun that has been transmitted through the atmosphere of the earth (Fig. 1.3). Radiation can affect plants in various ways. First, the radiant energy absorbed by a plant affects tissue temperature and, consequently, rates of metabolic processes and energy exchanges such as transpiration. Second, the visible fraction of the incident solar radiation can be utilized in the synthesis of reduced carbon compounds (i.e., photosynthesis). Thirdly, energy of specific wavelengths in the solar spectrum can be used by plant as cues for “growth behaviour”, e.g., the red:far-red ratio that can influence plant form and dry matter distribution among plant components, and the diurnal duration (photoperiod) of incident radiation, which can influence rate of development.
Short-Wave Radiation (280-3000 nm): short-wave radiation or solar radiation is the energy of wavelengths in the solar spectrum. Approximately 50% of the energy in the solar spectrum is photosynthetically active radiation (PAR). Short-wave radiation includes parts of the ultraviolet (UV) spectrum: UVB = 280-320 nm and UVA = 320-400 nm. Short-wave radiation also includes part of the near infrared (IR) spectrum (700-3000 nm).
7 Long-Wave Radiation (3000-10000 nm or 3-10 µm): in addition to short-wave radiation from the sun, long-wave radiation contributes to the radiation balance of plants. Long-wave radiation or terrestrial radiation is emitted by atmospheric gasses in the sky (water vapour and CO2, for instance)
and by objects on earth. Long-wave radiation is also called thermal radiation.
Figure 1.3: electromagnetic spectrum chart.
1.3 Ultraviolet radiation and its effect on plants
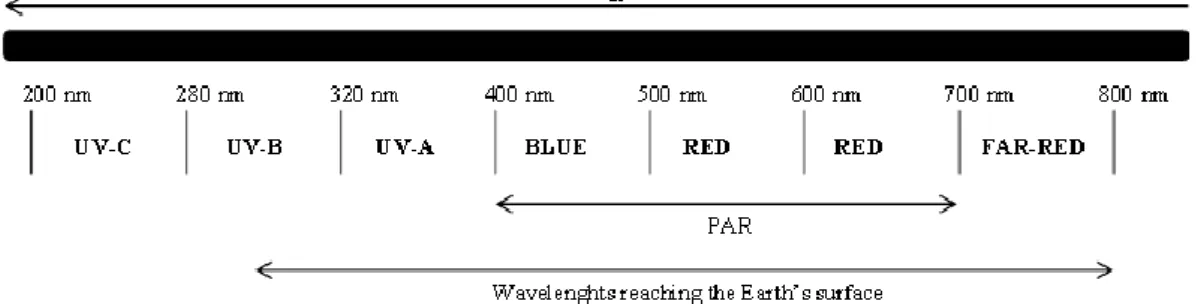
7% of the electromagnetic emission from the sun is in the range of UV radiation (200-400 nm). This radiation is modified and reduced during its passage through the atmosphere before reaching the terrestrial surface: shortwave UV-C radiation (100-280 nm) is completely absorbed by atmospheric gases; UV-B radiation (280-320 nm) is absorbed by stratospheric ozone and only a small portion continues its run to the terrestrial surface, whereas UV-A radiation (320-400 nm) is weakly absorbed by ozone (Frohnmeyer & Staiger, 2003) (Fig. 1.4).
8
Figure 1.4: the solar spectrum perceived by higher plants. PAR, photosynthetically active radiation. (Modified from Frohnmeyer & Staiger, 2003).
Global climate changes involve continuous reductions in the protective stratospheric ozone layer (Gurney et al. 1993). This degradation is a concern because this layer is the primary attenuator of solar ultraviolet (UV) radiation. Moreover, although ozone is a very minor constituent of the atmosphere, it is the only gas of the atmosphere that absorbs appreciably at wavelengths shorter than 300 nm (Caldwell et al. 1989). A reduced ozone shield allows more UV radiations to reach the ground, with the largest fractional increase occurring in the shorter-wave UV-B region (Caldwell & Flint, 1997) (Fig. 1.5).
9 Although UV radiation is a small fraction of the total solar radiation that reaches the ground, it has the greatest energy per unit wavelength and, consequently, the greatest potential to damage the biosphere. UV radiation has large effects on living organisms because it is absorbed by macromolecules like proteins and nucleic acids (Jansen et al. 1998); on plants it includes damage to DNA and membranes, alteration in transpiration and photosynthesis and changes in growth, development and morphology (Teramura & Sullivan, 1994). UV radiation could potentially affect a variety of ecological processes in numerous different ways, involving also nutrient cycling and terrestrial carbon cycle. Several evidence suggests that UV radiation modifies the terrestrial carbon balance through changes in CO2 capture (photosynthesis), carbon storage (organic carbon pools)
and release (respiration and photodegradation) (Zepp et al., 2007). UV radiation has been shown to inhibit photosynthesis because of the sensitivity of photosynthetic machinery (Albert et al., 2008) and by the alteration of gene expression, which is critical to photosynthesis (Ballare et al., 1996; Casati & Walbot, 2004; Izaguirre et al., 2003; Savenstrand et al., 2002).
A variety of indirect effects of UV radiation on the terrestrial carbon balance have also been recently elucidated. It is well documented that the chemical composition of plants is altered under UV exposure due to changes in nutrient content and tissue composition (Rozema et al., 1997). Although UV radiation can affect the terrestrial carbon balance by influencing photosynthesis, organic carbon pools and litter decomposition, the magnitude and the direction and the significance of UV radiation on every part of carbon cycle are still not fully understood. Moreover, the combined effect of UV radiation and other climate change factors like nitrogen deposition, altered precipitation patterns and enriched carbon dioxide in the atmosphere, don't seem to be additive, resulting in complex and possibly synergistic interactions that are difficult to predict.
Considering that solar radiation cannot be accurately and experimentally represented, UV supplementation studies are difficult to relate to the field. Many supplementation studies use square-wave systems (i.e. uniform intensity throughout exposure period), not keeping count of the diurnal cycle of UV radiation. Studies that investigate aspects of plant development and growth should be carefully designed with lamps which can simulate UV levels that peak at solar noon. This may be important for many aspects of plant development, including germination, growth, and biomass allocation (Caldwell et al., 1998; Bjorn et al., 1999). Casati & Walbot (2003) performed a field experiment on maize plants and reported a significant down-regulation of genes associated with photosynthesis under elevated UV. This decreased expression of genes that are involved the in photosynthetic process is consistent with recent studies, both in laboratory and in field, that have shown similar effects of UV radiation in other species (Ballare et al., 1996; Izaguirre et al., 2003;
10 Savenstrand et al., 2002). Furthermore, Albert et al., (2008) documented UV-B effects on high arctic Vaccinium uliginosum exposed to ambient and 60% reduced UV-B radiation: net photosynthesis was 28% higher in treatments with less UV-B radiation. This difference was attributed to an overall reduction in the ability of plants under ambient UV-B to process light energy: photosystem II (PSII) has often been documented as particularly sensitive to UV exposure (Bornman, 1989; Teramura & Sullivan, 1994). These results suggest that photosynthesis may be reduced substantially as a consequence of increasing levels of UV-B radiation which could potentially result in alterations in the plant carbon pool.
Moreover, many studies showed different results in UV-B sensitivity between species: plants at lower latitudes or higher altitude, where UV intensity is higher, have more functional adaptive mechanisms than those from higher latitudes or lower altitude (Sullivan et al. 1992). Studies on the impact of either acute or chronic UV radiation on BVOC emission even on a single-species scale are few and show contrasting results. The first published study on the effects of both chronic and acute UV-B radiation on isoprene emission in emitting and non-emitting species, was performed by Harley et al., (1996): they showed that chronic UV-B exposure significantly increased isoprene emission in Quercus gambelii but not in Mucuna pruriens, both strong isoprene emitting species. Furthermore, when M. pruriens and A. platanoides were exposed to high acute UV-B exposure, there were no apparent effects on either photosynthesis or isoprene emission. More recently, long-term effects of UV enhancement on BVOC emission were analysed on a pristine, mixed-species subarctic peatland ecosystem. Tiiva et al., (2007) found that enhanced UV-B significantly increased the emission of isoprene during the warm periods of the second growing season, and at the end of the fourth growing season.
On the other hand, the authors did not detect significant UV-B effect on the emissions from subarctic fen ecosystem, during the warm period in the third growing season. Then, in a follow-up study on the same subarctic peatland ecosystem, Faubert et al. (2010) showed no overall UV-B effect on the isoprene and monoterpene emissions, apart from toluene and 1-octene. Furthermore, both Tiiva et al. (2007) and Faubert et al. (2010) found no effects of UV-A radiation (320-400 nm) on BVOC emissions from the subarctic fen ecosystem. In addition, long-term increase in UV-B radiation did not affect terpene concentration in leaf and wood of Pinus sylvestris and Picea abies seedlings (Turtola et al., 2006), monoterpene and sesquiterpene emissions from P. abies (Blande et al., 2009). Similarly, Winter & Rostás (2008) found no differences in qualitative and quantitative composition of induced volatiles in soybean grown under ambient or attenuated UV radiation.
11 1.4 Blue Light
Plants rely heavily upon the surrounding light environment to direct their growth and development. Apart from the effect of photosynthetic photon flux density (PPFD), quality of light also affects other developmental and biochemical processes such as germination, flowering (Taiz & Zeiger, 2002) and stomatal regulation (Taylor & Assmann, 2001). Several different photoreceptor families mediate the effects of light on plant development. i.e. phytochrome molecule is the photoreceptor for red light responses, absorbing the red (600–700 nm) and far-red (700–750 nm) regions of the solar spectrum, while cryptochromes and the phototropins are involved in absorption of light in the blue (390–500 nm) and UV-A (320–390 nm) regions (Christie & Briggs, 2001), affecting chlorophyll formation, photosynthesis processes, stomata opening and raising the photomorphogenetic response.
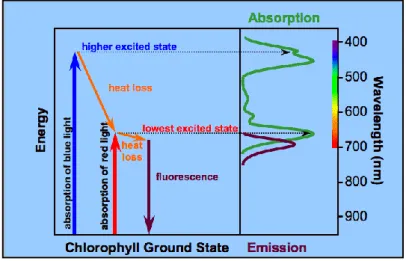
The green pigment, chlorophyll, plays a central role in photosynthesis. The fact that it is green means that it absorbs blue and red light and reflects green when it is illuminated by white (all PAR wavelengths) light.
Figure 1.6: The absorption of light relates to electron excitation states (Koning, 1994).
The absorption spectrum in Fig. 1.6 shows two absorption maxima in the blue and red portions in the spectrum. In the same figure, the energy diagram shows how an electron can be elevated to a higher energy level in the electron cloud of chlorophyll by absorbing a high energy photon. Blue is at the high-energy end of the spectrum, so light of this wavelength is responsible for this much excitation and explains the absorption peak in the blue. Red wavelengths are lower in energy and
12 only boost the electron to a lower energy level than can blue light. This stable excitation state is responsible for the red absorption peak.
Despite the enormous knowledge acquired to date on the photoregulation of plant development under red/far-red, blue (Leicht & Silander Jr, 2006; Christophe et al., 2006), and UV light, very little work has been done on the specific effect light quality.
1.5 Aim of the study and outline of the thesis
The following aims are addressed:
To investigate the seasonal effects of acute UV-A radiation treatments on Populus x euroamericana focusing on the effects on isoprene emission.
To study the effects of high doses of UV-B radiation on the BVOC emission of wild type and isoprene-emitting transgenic Nicotiana tabacum L. plants.
To determine the effect of blue light on isoprenoid emissions of Populus x euroamericana, a strong isoprene emitter, Quercus ilex, a species with a small storage pool for monoterpenes, and Citrus reticulata, a species with a large storage pool for monoterpenes, in experiments carried out in both Estonia and Italy.
13
CHAPTER 2 – Treatment facilities, plants and methods of analysis
2.1 Plants description
Three tree species, Populus x euroamericana, Quercus ilex L. and Citrus reticulata, and isoprene-emitting transgenic tobacco (Nicotiana tabacum L.) were studied. Populus x euroamericana is a strong isoprene emitter, whereas Quercus ilex and Citrus reticulata are monoterpene emitters with a small and a large storage pool for monoterpenes, respectively (Schurgers et al., 2009). Tobacco plants were transformed with an isoprene synthase gene (IspS) extracted from poplar (Populus alba) to obtain plants emitting isoprene at levels comparable to a naturally emitting species (Vickers et al., 2009).
2.1.1 Populus x euroamericana
Populus is a genus of woody deciduous flowering plants in the Salicaceae. It is a slender plant, which can reach heights of 25-30 m. Poplar trees are native of the Northern Hemisphere. Western balsam poplar (California poplar) was the first tree to have its full DNA coded in the year of 2006. Poplars are large emitters of isoprene with rates often exceeding 5-10% of the carbon fixed photosynthetically. The emission of isoprene is widespread in poplar species, with no reported exceptions (Kesselmeier & Staudt, 1999). We used populus x euroamericana for our experiments, it is an hybrid born from crosses between black European poplar (Populus nigra) and American black poplar (Populus deltoides), also known as Canadian poplar which can grow up to 35 cm in diameter in just 10 years, reaching a height of about 30 m.
One-year-old Populus x euroamericana saplings, propagated from physiologically mature trees growing in a clonal provenance trial in Italy, were transplanted before budburst into 6 dm3 plastic pots containing standard potting compost (sand:peat:loam mixture 1:5:3) and grown outdoor near Monterotondo (RM), Italy (42.1° N latitude; 123 m above sea level), under natural sunlight conditions. The plants were regularly watered to pot water capacity and fertilized with Hoagland solution once a week in order to supply mineral nutrients at free access rates.
14
2.1.2 Quercus ilex L.
Quercus ilex is an oak (i.e., holm oak) in the Fagaceae. The genus Quercus is native to the northern hemisphere, and includes deciduous and evergreen species extending from cool temperate to tropical latitudes in Asia and the Americas. Quercus ilex is an evergreen species developing in shrub and forest communities. Holm oak is widely distributed in the Mediterranean basin, with the exception of Egypt, particularly in the west, i.e. Italy to the iberian peninsula to Morocco and Algeria. It is a tree of medium size (up to 30 m). It can be found easily in the plane of the evergreen bush and, where conditions permit, up to 700-1000 m above sea level, where it forms pure woods (oak forests) or mixed (thickets) with pine, cork oak, arbutus, mock privet, laurel, mastic, oak, flowering ash, and other plants.
In Italy, holm oak is particularly common in the islands and along the Tyrrhenian and Ionian coasts. On the Adriatic coast populations are more sporadic. Small populations are also present in the Po valley along the shores of lakes, the Euganean hills, in Friuli and in Mesola wood in Ferrara.
Quercus ilex is a strong emitter of monoterpenes despite the absence of storage organs (Staudt et al., 1993). Quercus ilex saplings were potted into 10 dm3 pots containing commercial soil. All saplings were grown outdoor in Monterotondo Scalo (RM), Italy (42°04´N; 12°36´E) under natural sunlight conditions, regularly watered to pot water capacity when needed and fertilized with a supply of mineral nutrients at free access.
2.1.3 Citrus reticulata
Citrus reticulata (mandarin) is a citrus in the Rutaceae, commonly known as citrus family. Mandarin is a small, sometimes spiny, tree with slender branches and lance shaped shiny evergreen leaves. Mandarin is native to South-East Asia, and grows up to 7 meters in height. The lanceolate to ovate-lanceolate leaves are dark green and will reach up to 4 cm long by half as wide. Spines will reach up to 5 cm long and are very rigid and sharp. Mandarin is a monoterpene emitter with a large storage pool.
Citrus reticulata saplings were potted into 6 dm3 pots containing commercial soil. All saplings were grown in a Percival AR-95 HIL growth chamber (CLF PlantClimatics) of the University of Tartu (Estonia), under controlled conditions of 600 mol m-2 s-1 photon flux density, 25/20C of day/night temperature, 65% of relative humidity, and 12 h of photoperiod. Pots were regularly
15 watered to pot water capacity when needed and fertilized with a supply of mineral nutrients at free access.
2.1.4 Nicotiana tabacum L.
Seeds of wild-type and transgenic tobacco plants were provided by Vickers of the Department of Biological Sciences, Essex University, England. Wild-type Nicotiana tabacum plants do not naturally emit isoprene as they lack the isoprene synthase gene which converts dimethylallyl diphosphate (DMADP) to isoprene and pyrophosphate (Silver & Fall, 1991; 1995). Vickers et al. (2009) engineered Nicotiana tabacum L. plants with an isoprene synthase gene extracted from poplar (Populus alba), obtaining isoprene-emitting plants at levels comparable to a naturally emitting species. They produced and screened several different lines of emitting plants. After screening three strong isoprene-emitting lines, we finally chose for our experiments the line 6 as it resulted the best emitter.
Tobacco plants (Nicotiana tabacum cv. Samson NN and transgenic lines derived from this genotype) were potted in 3.6 dm3 pots containing standard potting compost (sand:peat:loam mixture 1:5:3) and maintained in a controlled greenhouse at 20-25 °C and 40-50% relative humidity (RH) near Monterotondo (RM). Plants were regularly watered to pot water capacity and fertilized with Hoagland solution once a week in order to supply mineral nutrients at free access rates.
2.2 Gas exchange and chlorophyll fluorescence measurements
Photosynthetic rate (A), leaf intracellular CO2 concentration (Ci), stomatal (gs) and mesophyll (gm)
conductance, were measured with an infrared analyser (IRGA) (Licor 6400XT, Lincoln, NE, USA), portable photosynthesis and fluorescence system for Quercus ilex, Populus x euroamericana and Nicotiana tabacum. Full expanded leaves were enclosed into a 2 x 3 cm cuvette with transparent Propafilm® top window with an unfiltered gallium arsenide phosphide PAR (photosynthetic active radiation) sensor placed in the chamber close to the leaf lamina.
Synthetic air, free of contaminants and pollutants, was provided to the leaf in the cuvette. It was controlled through a mass flow controller which allowed us to mix nitrogen, oxygen and carbon dioxide simulating the ambient gaseous conditions (20% O2, 80% N2, 380 µmol mol-1 CO2), but not
16 was controlled by circulation of water from a thermostated water bath and maintained between a range of 45%-60%. Leaf temperature was set at 30°C and kept stable during all measurements. Chlorophyll fluorescence was measured with a pulse-amplitude-modulated fluorometer (MINI-PAM, Heinz Walz GmbH, Effeltrich, Germany) simultaneously to gas exchange measurements by putting the sensor a fibre optic was mounted to the top of the cuvette at an angle of 45°. The optic fibre was placed about 1 cm from the leaf without shading it.
Gas exchange measurements for Citrus reticulata were performed in the University of Tartu (Estonia). An open two-channel gas-exchange system described in detail in (Copolovici & Niinemets, 2010) with a thermostatted 1.2 L glass chamber was used. The gas flow rate through the system was 1.4 L min-1, CO2 and H2O exchange was monitored with an infrared dual-channel gas
analyzer operated in differential mode (CIRAS II, PP-systems, Amesbury, MA,USA). One leaf was enclosed in the chamber. The CO2 concentration inside the chamber was 385 ± 10 mol mol-1, leaf
temperature was set to 30 °C and relative humidity at 60%. The photosynthetic quantum flux density was varied between 0 and 900 mol m-2 s-1. For the blue light experiment the source from IMAGING-PAM M-Series (Heinz Walz GmbH, Effeltrich, Germany) was used.
2.2.1 Mesophyll conductance calculation
Mesophyll conductance to CO2 was calculated using the variable J method (Harley et al., 1992) as
where Jf was calculated as: ⁄ , where F/F’m is the photosystem II
operating efficiency, PPFD is the photosynthetic photon flux density, α is the overall leaf absorbance measured with an integrating sphere (LiCor 1800-12S) throughout the experiment and the factor 0.5 was chosen because we assume that light is equally distributed between the two photosystems (Loreto et al., 1994). Measurements of dark respiration (Rd) were made after
maintaining leaves in darkness for 10 minutes. The CO2 compensation point to photorespiration
(Γ*), calculated with the Rubisco specific factor estimated by Galmés et al. (2005), was used in the gas exchange algorithms for hybrid poplar, tobacco, and holm oak respectively. Because * is a remarkably conservative parameter (Harley et al., 1992) we assumed that the value used in the gas
𝑔 𝐴
𝐶 − 𝛤 ( + 8(𝐴 + 𝑅 )) − 4(𝐴 + 𝑅 )
17 exchange algorithm did not affect the estimation of gm. Although diffusion leaks through chamber
foam gaskets were taken into account and corrected for according to the manufacturer’s suggestions (Li-Cor Inc., 2004), it was impossible to rule out the occurrence of other measurement errors (Flexas et al., 2008). However, Centritto et al. (2009) have recently calculated gm by using both the
variable J method and carbon isotope discrimination in recently synthesized sugars in water-stressed rice genotypes, and found that the two methods yielded congruent estimations of gm, confirming the reliability of the technique based on simultaneous measurements of gas exchange and fluorescence parameters.
2.3 Proton Transfer Reaction-Mass Spectrometry (PTR-MS)
Biogenic volatile organic compounds (BVOCs) emitted were monitored online by connecting the outflow of a cuvette to a proton transfer reaction-mass spectrometer system (PTR-MS, Ionicon, Innsbruck, Austria). Details on the theory and practice of the PTR-MS technique are reported by Lindinger et al. (1998). Briefly, PTR-MS utilises low-energy chemical ionisation to simultaneously monitor a suite of volatile organic compounds in air. Proton transfer from H3O+ is a soft ionization
method (keeping fragmentation rates rather low as compared to e.g. electron impact ionization often used in GC-MS instruments) thus minimizing coincidences in the mass spectra and improving the identification capability. Samples do not need to be prepared before the measurement thus whole-air samples can be introduced directly into the drift tube allowing for VOC flux measurements. The response time of the instrument is less than 100 ms and the sensitivity is 5-10 ppb.
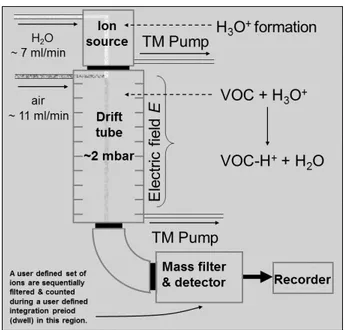
It is necessary to create ions since these charged particles can be steered and filtered using magnetic and electric fields and radio frequencies (Fig. 2.1). The protons are generated from water. Protonated water H3O+ interacts with the gas (R) to be analysed. During this interaction a proton transfers from the hydronium to the gas molecule, which leads to a protonated and therefore ionized molecule (RH+) and a neutral water molecule (H2O). This process generates a high concentration of
H3O+ ions as well as protonated water as dimers (H2O)2H+ and trimers (H2O)3 H+ that are detected
at m/z 19, 37 and 55, respectively. The proton transfer reaction is energetically possible for all VOCs with a proton affinity higher than that of water (166,5 kcal/mol) while it doesn’t occur to the major components of air (N2, O2, CO2) due to their lower proton affinity.
18
Figure 2.1: Schematic view of the PTR-MS (PTR-MS tutorial, Lancaster University, 2004).
H3O+ ions are produced in a hollow cathode discharge ion source from pure water vapour, in such a
high purity that no mass filter is needed to preselect the hydronium ions. The ion source includes a small drift region where water molecules collide with other ions (H3O+, O2+, H+, etc.) producing
more H3O+ ions. Most of the water vapour in the ion source is removed by a turbo-molecular pump
that also produces the pressure condition needed. The reagent ions are driven by an electric field and they enter the drift tube through a Venturi inlet, through which the sample air is pumped. In the drift tube sample air and H3O+ ions are mixed at 2 mbar pressure.
An important factor influencing fragmentation and clustering is given by the E/N ratio (E is the electric field; N is the number density of the gas in the drift tube) and it is expressed in units of Townsend (1 Td = 10-17 cm2 V−1 s−1). We set the ionization energy in a range of 120 - 140 Td as it is a good compromise to avoid production of water clusters on the one hand and breaking up of product ions due to collisions with neutral species in the drift tube on the other hand. E/N can be modulated between 80 and 140 Td. Low ionization energy promotes the formation of H2O·H3O+
ions that become the main source for H+ transfer. It is necessary in the analysis of some compounds like alcohols, esters and esters from membrane lipids that have more affinity for H2O·H3O+ than for
H3O+ ion. Only a small amount of energy is transferred during the ionization process therefore
fragmentation is suppressed and the obtained mass spectra are easily interpretable, but high H2O·H3O+ concentration can affect the relative humidity in the sample and then the analysis
19 compounds with the same molecular weight. The higher energy transferred causes an higher fragmentation level and the resulting characteristic fragment ions are detected at a different mass. Protonated molecules are concentrated in the Collision Dissociation Chamber (CDC) to avoid the development of hydrate complexes (clusters) and then they are selected in a quadrupole (MS) against their characteristic m/z ratio. The CDC separates the high pressure in the drift tube (2 mbar) from the high vacuum pressure in the detection region. A second turbo-molecular pump works to keep a pressure of about 2*10-5 mbar by decreasing the interaction between molecules. The detection efficiency of all ions is not the same, 100% efficiency is reached only for the molecules with a m/z of 80-100. A correction factor, typical for every quadrupole, must be calculated for molecules detection out of this range. The flux of molecules selected by the quadrupole is converted into an electric signal and then amplified by a SEM (Secondary Electron Multiplier). Once filtered, ions of a specified mass are counted using an ion counter that integrates the electric signal and gives the result in count per second (cps).
The water vapour flow into the ion source was controlled at 8 ml/min. The drift voltage was set at 600V. U2 and U3 voltages in the drift tube were set at 120V and 80V respectively. Mass spectral data were analysed with Balzers Quadstar 422 v.6.02 (Balzers AG) software and then processed utilizing Microsoft Excel (Microsoft Inc.). Several BVOCs were monitored during the experiments: methanol (m/z 33), involved in expansion and degradation of the cell wall (Nemecek et al., 1995); acetaldehyde (m/z 45) derived from fatty acid oxidation as a consequence of leaf damaging (Brilli et al. 2011); isoprene (m/z 69), total monoterpenes (main fragment m/z 81 and protonated molecular ion of mass m/z 137).
BVOC concentration in the sample air can be directly calculated without calibration, starting with the expression below:
[ 𝐶] [ 𝐶 ]
[ ]
where k is the proton transfer reaction rate coefficient and t is the reaction time. Alternatively the instrument can be calibrated with a gasses of known concentration. Considering that using the above formula can take to errors caused by the difficult on valuing some parameters, we used certified standard gasses to evaluate quantitatively the PTR-MS signal.
20
2.4 Gas Chromatography - Mass Spectrometry (GC-MS)
PTR-MS measurements were validated with a gas chromatography-mass spectrometry (GC-MS) system. Compounds were thermally desorbed from tenax tubes (Agilent) at 275°C for 10 min and cryo-focused in a cold trap at -10°C and desorbed worming up to 300°C with max heating rate (°C/sec). Then, desorbed compounds were injected trough a transfer line in a MS-5HP column with an internal diameter (id) of 0.25 mm (J&W Scientific USA, Agilent Technologies). The column temperature was held first at 40°C for 1 min, increasing to 210°C at a rate of 5°C/ min and rising to a final temperature of 250°C at a rate of 20°C/min. The carrier gas was helium with constant pressure.
The samples were analysed by Gas Chromatography–Mass Spectrometry (GCMS-MSD 5975C, Agilent). Terpenes were identified comparing the retention time and the fragmentation spectra with respect to those obtained by the chromatograms of pure standard. Terpenes were then quantified from the corresponding peak area using, for each compound of interest, a calibration curve.
2.5 BVOC quantification in Citrus reticulata
Measurements of gas exchange and isoprenoid emissions were carried out on leaves exposed to either actinic or blue light using an open two-channel gas-exchange system described in detail in (Copolovici & Niinemets, 2010). A and stomatal conductance (gs) were measured on whole-leaves
of mandarin enclosed in a thermostatted 1.2 dm3 glass chamber. The gas flow rate through the system was 1.4 L min-1, and CO2 and H2O exchange was monitored with an infrared dual-channel
gas analyzer operated in differential mode (CIRAS II, PP-systems, Amesbury, MA,USA). The CO2
concentration inside the chamber was 385 ± 10 mol mol-1, leaf temperature was set to 30 °C and relative humidity at 60%. The photosynthetic quantum flux density was varied between 0 and 900 mol m-2 s-1. The actinic light was provided by four 50 W halogen lamps, whereas the blue light was provided by from IMAGING-PAM M-Series (Heinz Walz GmbH, Effeltrich, Germany). Leaves were exposed to a synthetic air flux, free of contaminants and pollutants, comprising N2, O2
and CO2 in atmospheric concentrations (80%, 20% and 380 ppmv respectively). To measure
isoprenoid emissions, the chamber outflow was diverted into a silcosteel cartridge packed with 200 mg of Tenax (Markes International Limited, UK). A volume of 2 L of air was pumped through the trap at a rate of 200 mL min-1. The measurements were replicated four times.
21 The silcosteel cartridges were analysed by using an Shimadzu 2010 plus GC-MS instrument (Shimadzu Corporation, Kyoto, Japan) as presented in detail in Toome et al. (2010). The GC was supplied with a Shimadzu TD20 automated cartridge desorber. The GC was equipped with a splitless injector and a ZB-624 capillary column (60 m in length, 320 µm i.d. and 1.8 µm film thickness) (Zebron, Phenomenex, Torrance, CA, USA). Helium was used as carrier gas. The concentration of each volatile was calculated by comparison with the peak area of a gaseous standard. The GC-MS was calibrated using authentic standards (GC purity, Sigma-Aldrich, St. Louis, MO, USA). The compound identification was made using the NIST spectral library and based on retention time identity with the authentic standards. GC peak retention time was substantiated by analysis of parent ions and main fragments on the spectra. The absolute concentrations of VOC's were calculated based on an external authentic standard consisting of known amount of VOCs.
22
2.6 Leaf reflectance measurements
Leaf reflectance was measured by using a portable spectrometer (ASD FieldSpec 3, Analytical Spectral Devices, Inc., USA), operating in the spectral range between 350 to 1025 nm. The instrument scans the visible and near infrared spectrum, measuring in parallel intervals of 1.4 nm and estimating values of irradiance at singular wavelengths through a linear interpolation routine. The spectrometer was equipped with an optic fibre probe with an angular field of view of 25°. The instrument automatically calculates the reflectance value as a ratio between the incident radiation reflected from the surface target and the incident radiation reflected by a reference panel (Spectralon, Labsphere, Inc., USA). This material can be regarded as a Lambertian reflector. In our experiments, reflectance spectra were collected from a distance of 5 cm from the adaxial leaf surface with an angle of 60°, to avoid shading the analysed leaf surface. Each spectral signature was recorded as the average of 100 scans to reduce instrumental noise; a further check of the stability of the reflected signal was performed by measuring the reflectance of the reference panel at the beginning and end of each session. Reflectance spectra were pre-processed by using the ViewSpecPro (ASD) software. Photochemical Reflectance Index (PRI) was calculated as:
𝑅 𝑅 − 𝑅 𝑅 + 𝑅
(Gamon et al., 1990; Gamon et al., 1997), where R531 is the reflectance at 531 nm, that is affected by the xanthophyll cycle status, and R570 indicates reflectance at 570 nm, that is a reference waveband that normalizes the value of the index.
2.7 Light System
Light was provided by a computer controlled light system that combines four lamps with 4 cm2 arrays of RGBA LEDs (ENFIS Ltd, Swansea, UK), able to generate different monochromatic lights within the visible spectrum as well as actinic light and also allowing to specify an opacity value for a colour. This system is driven by LE Sentinel V2.2 software that allows to set proportions of the three main light compounds (red, green and blue) as well as the opacity and the intensity. To enable measurements of blue light-saturated photosynthetic rates, illumination of the leaf cuvette by RGBA LEDs was supplemented with light provided by an auxiliary blue light led lamp (450-475 nm) (Vinci Fine Instruments, Monterotondo, Italy).
23 The light system is combined with a lamp with 4 cm2 arrays UV-A LEDs (100 W, peak wavelength at 365 nm, range 335-395 nm), which intensity can be also controlled by the same software of RGBA LEDs and the UV-A intensity at leaf level was measured with a quantum-photoradiometer and thermometer DO 9721 (Delta Ohm S.r.l., Italy) equipped with a LP 9021 UV-A radiometric probe. An Manhood 31 UV-B lamp (Vinci Fine Instruments, Monterotondo, Italy) was used in the experiments with tobacco. The UV-B lamp has a spectral distribution in range of 250-365 nm, with a peak wavelength at 310 nm, including, therefore, also a small portion of UV-A radiation. Because it was not possible to modulate the UV-B intensity, the amount of the UV-B radiation reaching plants was determined in function of the their distance from the light source. A DO 9721 photoradiometer equipped with a LP 9021 UV-B probe was used to measure the UV-B radiation reaching leaves.
2.8 Biochemical analysis
Leaf samples were immediately plunged into liquid nitrogen in order to stop any biological activity and then stored at -80 °C until used. Biochemical measurements included the determination of reduced ascorbate (ASC), dehydroascorbate (DHA), total glutathione, oxidized glutathione (GSSG). In order to prepare the leaf extracts used in the determination of the antioxidant defence activities, leaf tissue (about 100 mg wet weight) was dissolved in 1,5 ml 3% perchloric acid acid, and the mixture was centrifuged (5000 rpm, for 20 min) at 4°C. The pH was adjusted to 7 by adding 300-400uL of a sodium carbonate solution. ASC/DHA content was determined using the spectrophotometer method described by Takahama & Oniki (1992). For ASC, initial absorbance of a 50 μL aliquot of extract was measured at 265 nm in 100 mM K-phosphate buffer (pH 6.1), then measured again 1 min after the addition of ascorbate oxidase (1 U mL-1). DHA content was determined in another 50 μL aliquot. Initial absorbance was recorded as for ASC, and then the sample was measured again following the addition of 2 mM DL-dithiothreitol (DTT). An extinction coefficient of 14 mM-1cm-1 for ASC at 265 nm was used in calculations (Nakano and Asada 1981). Total glutathione was determined enzymatically. A 0.39 mL of 100 mM phosphate buffer (pH 7.4) containing 5 mM EDTA, 0.025 mL of 10 mM DTNB, and 0.08 mL of 5 mM NADPH was added to 0.05 mL of leaf extract solution. After equilibration for 3 minutes at 25°C, the reaction was started by adding 2 units of glutathione reductase. The formation of 2-nitro-5-thiobenzoic acid was continuously recorded at 412 nm with a UV-vis spectrophotometer. The total amount of glutathione in the samples was determined from a standard curve obtained by plotting the known amount of GSH versus the rate of change of absorbance at 412 nm. Samples for GSSG determination were
24 incubated at room temperature with 20 μl of 4-vinyl pyridine per 1000 μl sample for 1 h. Incubation with 4-vinyl pyridine conjugates any GSH present in the sample so that only GSSG is recycled to GSH without interference by GSH.
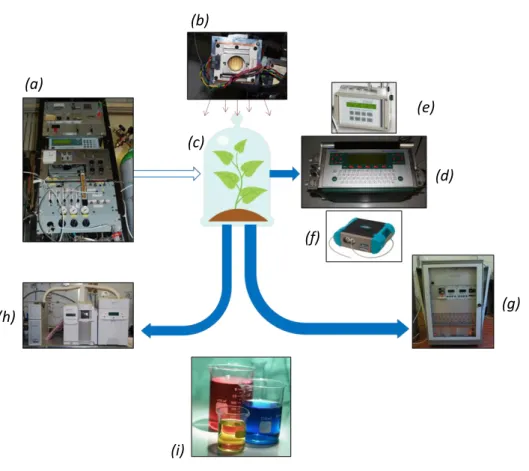
The full experimental system is summarized in Fig. 2.2.
Figure 2.2: Schematic representation of the experimental system used: (a) synthetic air generator, (b) light system, (c) plant cuvette, (d) infrared gas analyser, (e) fluorometer, (f) spectroradiometer, (g) PTR-MS, (h) GC-MS, (i) biochemical analysis.
2.9 In situ estimation of a flavonoid and chlorophyll index with a portable fluorimetric sensor
Estimation of flavonoids and chlorophylls was performed by Dr. Giovanni Agati in the Institute of Applied Physics (IFAC) of CNR in Sesto Fiorentino (Italy). Epidermal flavonoids were optically estimated in vivo using the portable fluorimetric sensor Multiplex 3 (Mx) (FORCE-A, Orsay, France) (Ben Ghozlen et al., 2010; Agati et al., 2011). MS measures the chlorophyll (Chl)
(a) (b) (d) (f) (e) (g) (h) (c) (i)
25 fluorescence in both the red, at the 680-690 nm (RF), and far-red, at 730-780 nm (FRF), bands sequentially excited at 4 different excitation wavelengths in the UV-A (385 nm), and in the blue (460 nm), green (525 nm) and red (625 nm) spectral regions. The fluorescence signals were integrated over a 8 cm circular area. For the present experiment, the Chl fluorescence signals FRFR, excited with red (R) light, and FRFUV, excited with ultraviolet (UV) radiation, were used to calculate the flavonoids (FLAV) and chlorophyll indices in the first layers of mesophyll as: FLAV = FRFR/FRFUV, and CHL = FRFR/RFR, where RFR is the red emission excited under red light. The origin of these indices is detailed elsewhere (Bilger et al., 1997; Buschmann, 2007; Ben Ghozlen et al., 2010). The adaxial and abaxial surfaces of newly developed leaves (three individual leaves per plant) were measured once a week from middle of July 2010 to middle of September 2010 on three different plants.
2.10 Statistics
The data presented are means of minimum five measurements made on different plants ± S.E. When needed, means were statistically analysed by ANOVA test, and then they were grouped by significantly homogeneous subsets.
26
CHAPTER 3 – Effect of UV-B radiation on wild-type and transgenic Nicotiana tabacum plants.
3.1 Introduction
The depletion of the stratospheric ozone over the past several decades has resulted in enhanced levels of ultraviolet-B (UV-B) radiation (280-320 nm) reaching the biosphere (Gwynn-Jones et al., 1999; Madronich et al., 1998). Although the production and consumption of ozone-depleting chemicals (e.g. Chlorofluorocarbons (CFCs), halons) has fallen as a result of Montreal Protocol, CFCs can remain in the upper atmosphere with a half-life ranging from 50 to 150 years. Thus, decreased ozone levels could not be recovered to the pre-1970 levels until 2050 (WMO, 1995; UNEP, 2002).
UV-B radiation has many direct and indirect effects on plants. Damage may occur in different ways, including the direct destruction of the genetic material DNA, deactivation of enzymes, disruption of membranes, denaturation of several cell structures and generating highly reactive chemical agents. (Teramura & Sullivan, 1994). Although biological repair mechanisms exist, mutations may remain as errors in the repair processes and, in addition, the repair mechanisms themselves may be deactivated by high UV doses (Mpoloka, 2008). Reductions in photosynthetic rate and capacity because of the sensitivity of photosynthetic machinery have been described for a number of tree species (Albert et al., 2008). Adverse physiological and developmental effects may well be brought about by UV-B indirectly through alterations to the production and concentrations of plant hormones and other growth regulators. Furthermore, UV-B acts as an additional stress exacerbating the detrimental effects caused, for example, by drought, soil contamination or disease (Rozema, 1997).
Because UV-B radiation can damage the photosynthetic apparatus, UV-B can also alter the secondary metabolism of plants (Wellmann, 1983; Caldwell & Flint, 1994) including biogenic volatile organic compound (BVOC) emissions. Studies on the interaction between UV radiation and BVOC emission showed contrasting results. Tiiva et al. (2007) showed that isoprene emissions on mixed-species subarctic peatland ecosystem appear to be higher under enhanced UV-B radiation during the warm periods of the second growing season, and at the end of the fourth growing season, but they did not find significant UV-B effect on the emissions during the warm period in the third
27 growing season. Harley et al. (1996) found that isoprene emission on Mucuna pruriens was not affected by chronic exposure to UV-B.
There is an increasing body of literature concerning the role of isoprene in relieving environmental stresses (see for a review: Vickers et al., 2009). As a tool for studying the role of isoprene, Vickers et al. (2009) transformed tobacco (Nicotiana tabacum L.) with isoprene synthase gene extracted from Populus alba and obtaining plants emitting isoprene at levels comparable to a naturally emitting species. They demonstrated that isoprene emission plays a protective role against several abiotic stresses like heat, combined heat/light and ozone-induced oxidative stress, allowing plants to respond better to oxidative stress caused by ozone, minimizing potential damage and preventing the over-accumulation of ROS. The mechanisms by which a protective function of isoprene is achieved is still unclear, but the most likely explanation is that because isoprene is embedded in the organelle membranes it can increase their stability by preventing membrane lipid denaturation following oxidative stress (Sharkey & Singsaas, 1995; Loreto & Velikova, 2001; Sharkey, 2005).
In this study, wild-type and transgenic isoprene-emitter plants of Nicotiana tabacum were exposed to acute doses of UV-B radiation in order to analyse their effects on photosynthetic parameters and BVOC emissions. Measurements were performed at several different intensities from low values of 3 W m-2 to strong dose of 15 W m-2. Here we show only results obtained at 3 W m-2, 9 W m-2 and 15 W m-2 because they considered more relevant.
3.2 Material and methods
Photosynthesis and BVOC emission were simultaneously measured in laboratory under controlled conditions: steady-state photosynthesis (A) and stomatal conductance (gs) were measured with a LI-6400 IRGA, by enclosing a portion of a single fully expanded leaf in a 6 cm2 cuvette with Teflon top window. A stable 300 µmol m-2 s-1 flow of synthetic air in atmospheric concentrations, free of contaminants and pollutants, was provided to the leaves. Measurements were taken on leaves exposed to saturating photosynthetic photon flux density (PPFD) of 1000 µmol m-2 s-1 of actinic light with relative humidity in the leaf cuvette ranging between 45-55%. BVOCs were online monitored by a PTR-MS connected to the exhaust line of the leaf cuvette. The PTR-MS was set in a single ion mode to record trace of protonated masses of isoprene (m/z 69) and methanol (m/z 33).
Plants were irradiated for 90 minutes by positioning the UV-B lamp perpendicularly to the full extended leaf. UV-B intensity was measured with a DO 9721 photoradiometer equipped with a LP
28 9021 UV-B probe. Gas exchange, BVOCs, leaf reflectance and image fluorescence were analysed before starting and at the end of the UV-B treatments, as well as 24 and 48 hours after the irradiation.
Leaf samples were collected for biochemical analyses. Samples from the fifth node (from the apical meristem) were cut and frozen immediately in liquid nitrogen. Samples (4 plants per treatment) were taken before, immediately after, and 48h after UV-B irradiation, respectively.
3.3 Results and discussion
Stratospheric ozone layer shields the entire Earth from much of the harmful ultraviolet radiation that comes from the sun. While high energy UV-C radiation is completely absorbed and low energy UV-A is weakly absorbed by stratospheric ozone, UV-B is mostly absorbed by stratospheric zone but a substantial part reaches the Earth. Over the past few decades, there has been a depletion of the stratospheric ozone layer due to emissions of halogen-containing compounds of anthropogenic origin. This has resulted in a concomitant increase in solar ultraviolet-B radiation (Mpoloka, 2008). The successful implementation of the Montreal Protocol is having a marked effect on climate change, leading to the decrease of the atmospheric concentration of ozone depleting substances (McKenzie et al., 2011). However, despite the success in limiting the stratospheric ozone depletion, levels of UV irradiances that reach the Earth’ surface are expected to be still elevated in the coming decades. The highest UV-B dose rate was found in Lhasa, Tibet, and it is 3.96 W m-2 (Norsang et al., 2009). Vickers et al. (2009) demonstrated that isoprene emission plays a protective role against several abiotic stresses like, including oxidative stress, minimizing potential damage and preventing the over-accumulation of ROS. To investigate isoprene ipotetical role in protecting the plant against increasing UV-B radiation we performed the experiment on both wild-type tobacco (a non-emitting species) and on transgenic isoprene-emitting tobacco plants.
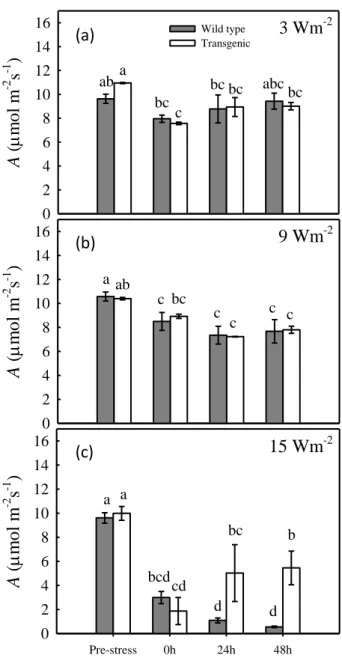
Tobacco plants were treated with UV-B radiation at 3, 9 and 15 W m-2 intensities for 90 minutes to study the UV-B dose-response relationships. Photosynthesis (Fig. 3.1) was lightly affected by exposition at 3 W m-2 (Fig. 3.1a), decreasing by about 31% in transgenic plants and ~17% in wild-type plants. A recovered partially 24 hours after the end of the treatment and almost completely 48 hours after the treatment. Similarly, reduction in photosynthesis was observed when the plants were treated with 9 W m-2 UV-B radiation (Fig. 3.1b), but in this case A did not recover 48 hours after the irradiation. Photosynthetic responses in transgenic and wild-type plants were not significantly different in both low (3 W m-2) and intermediate (9 W m-2) intensity treatments. In contrast,
29 exposition to very high intensity of 15 W m-2 (Fig. 3.1c) not only caused higher damages to the photosynthetic apparatus immediately after the stress, but caused a different response in emitting and non-emitting plants. Emitting plants partially recovered from the stress, while non-emitting plants experienced a persistent damage to the photosynthetic apparatus. This significant strong decline may indicate that damages at metabolic level occurred at high intensity of UV-B treatments.
15 Wm-2 Pre-stress 0h 24h 48h A ( m o l m -2 s -1 ) 0 2 4 6 8 10 12 14 16 3 Wm-2 Pre-stress 0h 24h 48h A ( m o l m -2 s -1 ) 0 2 4 6 8 10 12 14 16 Wild type Transgenic a abc ab bc bc bc bc c a a b bcd bc cd d d 9 Wm-2 A ( m o l m -2 s -1 ) 0 2 4 6 8 10 12 14 16 a ab bc c c c c c
Figure 3.1: Photosynthesis in transgenic isoprene-emitter (grey bars) and wild-type plants (white bars) tobacco plants exposed to 3 (a), 9 (b) and 15 W m-2 (c) intensity UV-B radiation for 90 minutes. Measurements were made before, immediately after, 24h and 48h after the UV-B treatments. Results are means of 4 replicates ± 1 SEM. The letters a to d indicate differences at P < 0.05 in response to the UV-B treatments.
(a)
(b)
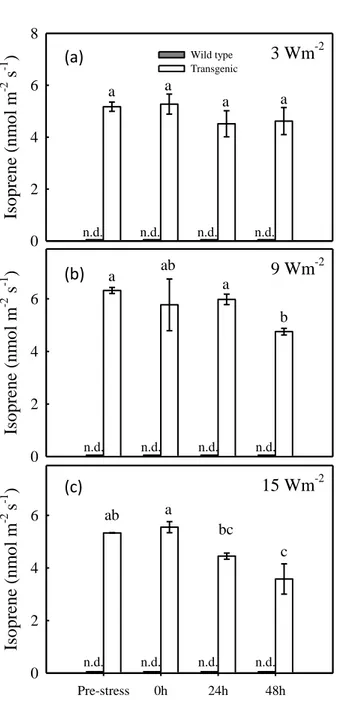
30 Transgenic tobacco plants were produced by transformation, inserting the isoprene synthase gene (IspS) extracted from poplar (Populus alba), obtaining plants emitting isoprene at levels comparable to a naturally emitting species (Vickers et al., 2009). As expected, isoprene was not detected in non-emitting plants (Fig. 3.2). When treated with low intensity UV-B (3 W m-2) (Fig. 3.2 a), isoprene emission remained stable. Differently, a significant decrease in isoprene emission was detected 48 hours after the treatment, when plants were irradiated with 9 W m-2 intensity (Fig. 3.2 b). Similarly, a comparable decrease was observed after treatment at 15 W m-2 (Fig. 3.2 c). In both 9 and 15 W m-2 treatments, decrease in isoprene emission was detected after 24 hours after the end of the UV-B irradiation.
31 Is o p rene ( n m o l m -2 s -1 ) 0 2 4 6 8 Wild type Transgenic n.d. n.d. n.d. n.d. 3 Wm-2 a a a a Pre-stress 0h 24h 48h Is o p rene ( n m o l m -2 s-1 ) 0 2 4 6 n.d. n.d. n.d. n.d. a ab a b 9 Wm-2 Pre-stress 0h 24h 48h Is o p rene ( n m o l m -2 s -1 ) 0 2 4 6 n.d. n.d. n.d. n.d. ab a bc c 15 Wm-2
Figure 3.2: isoprene emission in transgenic isoprene-emitter tobacco plants (grey bars) and in wild-type plants (white bars) exposed to 3 (a), 9 (b) and 15 W m-2 (c) intensity UV-B radiation for 90 minutes. Results are means of 4 replicates ± 1 SEM. The letters a to c indicate differences at P < 0.05 in response to the UV-B treatments.
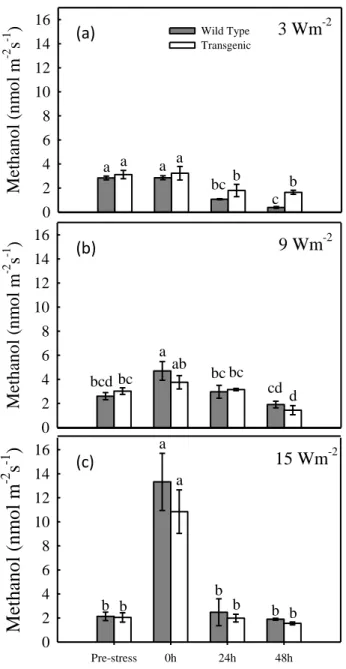
Methanol emission was also very responsive to increasing UV-B irradiances. Exposure at 3 W m-2 did not cause emission bursts from treated tobacco leaves and low basic levels of methanol remained stable during the whole experiment (Fig. 3.3 a). When plants were exposed to 9 W m-2 intensity UV-B, we detected a higher quantity of methanol emitted immediately after the irradiation (Fig. 3.3 b). However, the increase in emission was significant in wild-type plants only. Differently, remarkable quantities of methanol were emitted soon after exposure to the strong UV-B intensity of 15 W m-2 (Fig. 3.3 c). Values about 6 and 5.5 times higher than pre-stress were detected in
wild-(c) (b) (a)