ABSTRACT
This research was carried out at CoRFiLaC in collaboration with the CoRFiLaC research group and technical staff.
The understanding of how cows chew their feed might be one fundamental previous step necessary to study if, and how feed particle size could alter efficient feeding, milk production and composition and animal health. Our main objective was to learn some rules, of how feed particle size is reduced during the ingestive mastication in dairy cattle, in order to get an idea about rumen mat consistency from diet particle size and intake. We measured lengths distributions of feed and respective bolus particles which are potentially contributing to rumen mat formation, estimated an approximate dry matter proportion of this sample fraction, and evaluated differences in chewing behaviour between dry and lactating cows.
Poppi et al. (1985) reported that particles retained on a 1.18 mm screen, using a vertical sieving technique, are highly resistant to passage from the rumen in cattle. As vertical sieving techniques divide particles by their widths rather than their lengths and Mertens (1984) reported constant lengths to widths ratios varying from 3.4:1 for corn silage to 10:1 for alfalfa and bermudagrass hay, we concluded that particles resistant to passage out of the rumen might have lengths probably not shorter than 5 mm. We focussed on the analysis of particle lengths ≥ 5 mm. Analyses were performed using an image analysis technique. A mean length (ML) was calculated considering only particle lengths ≥ 5 mm. In order to determine the mass of particles ≥ 5 mm, we found that a screen with 1.6 mm openings, using a horizontal wet sieving technique, separated best the particles ≥ 5 mm from those of smaller dimensions. The dry proportion of samples on that screen was called PROP_1.6.
We performed two experiments. In the first experiment, 6 rye grass hay treatments differing in particle lengths, one corn silage, one grass silage and one TMR sample were fed to four dry and four lactating, rumen fistulated, dairy cows after rumen were emptied, and boli, rumen mat and feces were sampled. Rye grass hay treatments were as follows: rye grass cut at 50 mm lengths and dried to hay, long rye grass hay, chopped rye grass hay retained on the Penn State Particle Separator (PSPS) screens of 19 mm, 8 mm, 1.18 mm and on the bottom pan. In the second experiment we selected 10 total mixed ration (TMR) samples from Sicilian dairy farms. We divided TMRs into fractions by sieving them through four sequential sieves of 19 mm, 8 mm, 2.5 mm and 1.18 mm. All fractions and the unprocessed TMRs were fed to three dry dairy, rumen fistulated cows, after rumen were emptied, and boli were sampled. Feed (with exception of the long rye grass hay, rye grass cut at 50 mm lengths and dried, chopped rye grass hay retained on the 19 mm and the 8 mm
particles retained were separated, imaged and ML was calculated. Dry matter (DM) and contents of crude protein (CP) and neutral detergent insoluble fiber (aNDF) were determined in the feed
samples.
The longest ML of a TMR particle the cows were able to swallow was about 18 mm. This was nearly twice the longest ML of rye grass hay bolus particles, which could be swallowed at ML ≤ 10 – 11 mm.
As a difference to TMR particles, all rye grass hay fractions probably stimulated chewing to some extent. Even the smallest rye grass hay particles retained on the PSPS bottom pan were apparently reduced in PROP_1.6 although this fraction is not defined physical effective (Kononoff and Heinrichs, 2003). Ingestive chewing reduced PROP_1.6 of the unprocessed TMRs. Eating reduced also PROP_1.6 of TMR fractions retained on screens with openings of at least 2.5 mm, but not PROP_1.6 of the TMR fractions passing that screen. Eating reduced ML of TMR fractions retained on screens with openings of at least 8 mm, but neither ML of particles which had passed the 8 mm screen, nor ML of the unprocessed TMRs were reduced significantly (p > 0.05). The sum of TMR residues on the two upper PSPS screens with 19 and 8 mm openings might underestimate TMR physical effective fiber (pef), while the sum of residues from all three PSPS screens might overestimate TMR pef. We suggest the use of a sequential sieve set containing a 19 mm, a 8 mm sieve and an additional screen with 2.5 mm openings, instead of the additional screen with 1.18 mm openings, for diet evaluation on the farm.
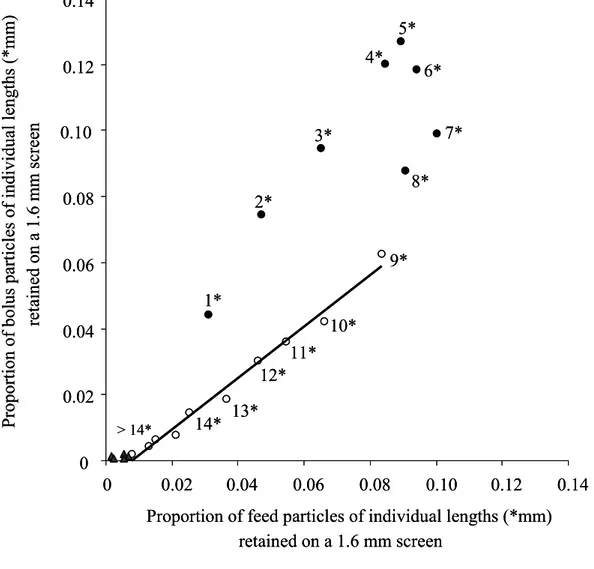
Feed and bolus PROP_1.6 were highly correlated (R2 = 0.94, 65 observations), when unprocessed TMRs and TMR fractions were fed, with y = 0.79x + 0.03 and y being bolus and x feed PROP_1.6. Rye grass hay particles and most silage samples were apparently chewed more intensely and having lower bolus PROP_1.6. Feed and bolus ML were highly correlated (R2 = 0.86, 47 observations), when unprocessed TMRs and TMR fractions were fed and feed ML ≤ 20 mm, with y = 0.76x + 2.08 and y being bolus and x feed ML. Most silages apparently fitted this regression, too. When rye grass hay was fed and feed ML ≤ 20 mm, feed and bolus ML were correlated with R2 = 0.43 at 21 observations, with y = 0.24x + 6.13 and y being bolus and x feed ML. Rye grass hay and TMR particles with ML > 20 mm were apparently chewed to constant lengths, with feed particle size not being related to bolus particle size. Chopped rye grass hay particles with ML > 20 mm were particles retained on the 19 and the 8 mm PSPS screen, whereas TMR with ML > 20 mm were retained only on the 19 mm screen. Only particle size of feeds with ML under this threshold might be able to influence parameters such as rumen retention time, intake and rumen degradation of feed, if these parameters were related to bolus particle size.
Rye grass hay was chewed more intensely compared to TMR particles. Rye grass hay particles were dry, while TMR treatments contained 36 – 48% water. Rye grass hay particles contained 12 – 14 (% DM) CP and 54 – 59 (% DM) aNDF, whereas CP and aNDF of TMRs were 14 – 24 and 20 – 48 (% DM), respectively. During eating, chemical parameters influenced more reduction of ML of longer compared to shorter particles, but reduction of PROP_1.6 was more affected in the shorter particles. For each % decrease in sample DM bolus ML increased
approximately 0.2 mm, under the particular condition where feed particles ML ranged between 14.7 and 43.7 mm, CP content ranged between 12.8 and 13 (% DM) and aNDF content ranged between 47.5 and 51 (% DM).
Chewing behaviour of dairy cows was not altered by physiological stage nor by the
interaction of treatment feed by physiological stage. Bolus PROP_1.6 and ML from dry cows were not different from lactating cows. Even though dry and lactating cows received different diets, PROP_1.6 and ML of rumen mat and feces were alike. Approximately 26% and 36% dry matter of rumen mat was retained on a 1.6 mm screen in dry and lactating cows, respectively. Rumen mat particles retained on that screen and ≥ 5 mm, had ML of 8.6 mm in dry and 10.3 mm in lactating cows. There was a trend for higher PROP_1.6 of fecal particles from dry cows compared to lactating cows (p = 0.105), but ML of 7.4 and 7.9 in dry and lactating cows, respectively, were not statistically different.
The lengths of the longer particle fraction from TMR, which was retained on a 1.6 mm screen, were reduced to a higher extent during rumination compared to the longer fraction of ingested particles from rye grass hay. Only approximately 38% or less of TMR DM is constituted by particles potentially retained in the rumen. However, these particles might need a longer time for rumination compared to chewed hay particles.
In both, dry and lactating cows, proportions of rumen mat particles > 4 and > 6 mm, respectively, at individual lengths, retained on a 1.6 mm screen, were highly correlated to
proportions of bolus particles. Rumen mat ML can be estimated from lengths distribution of bolus particles retained on a 1.6 mm screen.
TABLE OF CONTENTS
List of Figures………vii
List of Tables………xiii
Acknowledgements………...xiv
CHAPTER 1 – General Introduction History of Feed Particle Size Evaluation in Nutrition of Dairy Cows.……….1
Effects of Feed Particle Size on Diet Utilization and Cow Performance Reported in Literature....……….11
Factors Affecting Chewing Behaviour of Cows……….16
Research Objectives………19
CHAPTER 2 - How Do Dairy Cows Chew their Feed? - Part I: Particle size analysis of feed and ingested bolus particles from rye grass hays with different particle lengths distributions, from a grass and a corn silage sample and from a sample of a total mixed ration INTRODUCTION ………...26
MATERIALS AND METHODS ..………...27
RESULTS AND DISCUSSION ………...32
CONCLUSION………..39
CHAPTER 3 - How Do Dairy Cows Chew their Feed? - Part II: Do lactating cows chew their feed differently from dry cows? How is rumen mat particle size related to bolus and fecal particle size in dry and lactating cows? INTRODUCTION…...………..65
MATERIALS AND METHODS ...………...66
RESULTS AND DISCUSSION .. ………67
CONCLUSION ………...73
CHAPTER 4 - How Do Dairy Cows Chew their Feed? - Part III: Particle size analysis of feed and ingested bolus particles from fractions of total mixed rations which are differing in particle length and composition. How is chemical composition of feed related to particle size reduction during chewing? INTRODUCTION………..………93
MATERIALS AND METHODS ...…………...………94
RESULTS AND DISCUSSION.………98
CONCLUSION……….105
List of Figures
Figure 2.1. Determination of sample particle size – Horizontal wet sieving of the sample through a sieve with 1.6 mm openings,
• determination of particle lengths distribution of sample retained, with particular attention on particles ≥ 5 mm and
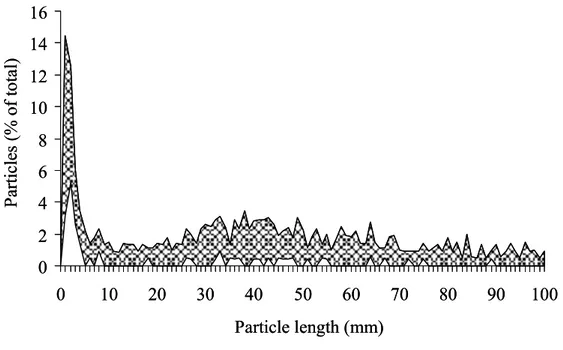
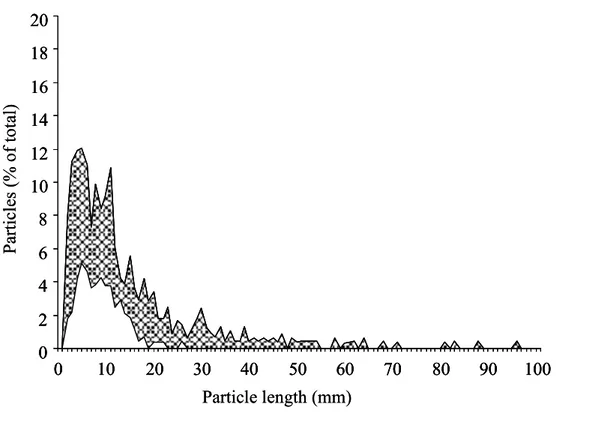
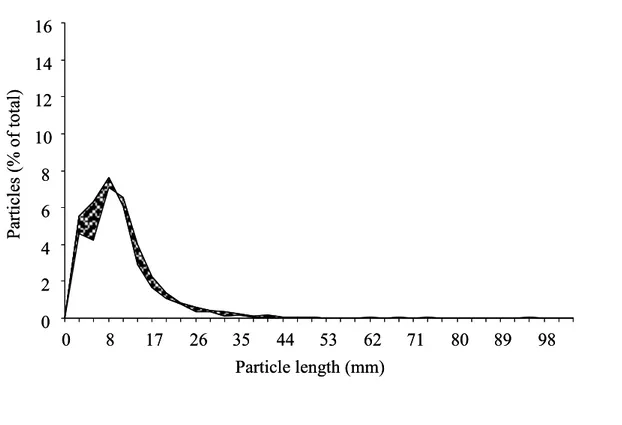
• sample dry matter proportion retained………...41 Figures 2.2. Variability of particle lengths distribution within and between treatments – Image analysis of treatments (a – g).
Figure 2.2.a. Rye grass particles cut at 50 mm length and dried to hay………42 Figure 2.2.b. Rye grass hay particles retained on a 19 mm screen………42 Figure 2.2.c. Rye grass hay particles passing a 19 mm screen but retained on a 8 mm screen….43 Figure 2.2.d. Rye grass hay particles passing a 8 mm screen but retained on a 1.18 mm screen –
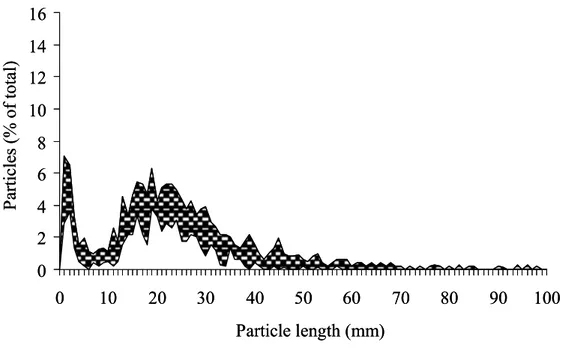
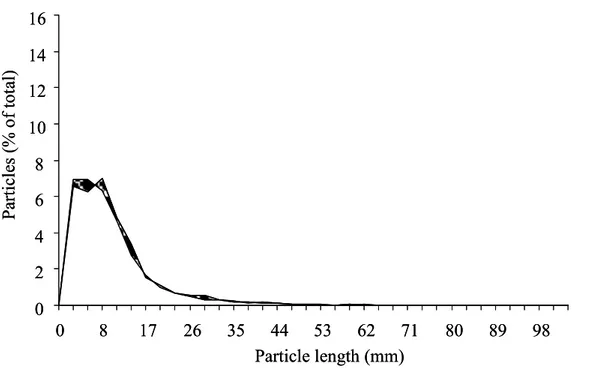
Image analysis after elimination of small particles by sieving treatment feed through a 1.6 mm screen………...43 Figure 2.2.e. Grass silage - Image analysis after elimination of small particles by sieving
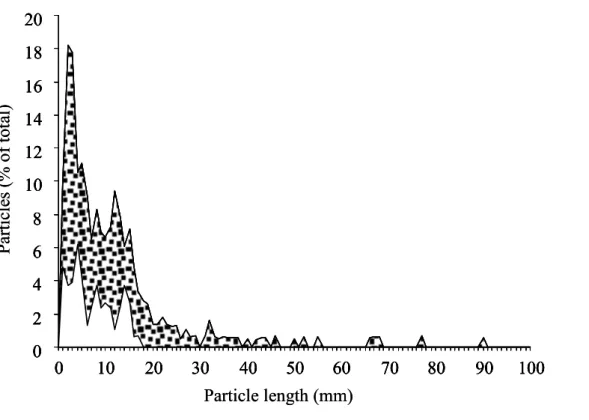
treatment feed through a 1.6 mm screen……….44 Figure 2.2.f. Corn silage - Image analysis after elimination of small particles by sieving
treatment feed through a 1.6 mm screen……….44 Figure 2.2.g. TMR - Image analysis after elimination of small particles by sieving treatment feed
through a 1.6 mm screen……….45 Figures 2.3. Mean* reduction of particle lengths during ingestive mastication (a – g) – Image
analysis of treatment particles (d – g) and respective boli (a – g) after elimination of small particles by sieving through a 1.6 mm screen.
* Mean distribution within 3 mm intervals and means of eight animals were considered.
Figure 2.3.a. Difference in particle lengths distribution between rye grass particles cut at 50 mm length and dried and their respective bolus particles………..46 Figure 2.3.b. Difference in particle lengths distribution between rye grass hay particles retained
on a 19 mm screen and their respective bolus particles………..46 Figure 2.3.c. Difference in particle lengths distribution between rye grass hay particles passing a
19 mm screen but retained on a 8 mm screen and their respective bolus particles…………47 Figure 2.3.d. Difference in particle lengths distribution between rye grass hay particles passing a 8 mm screen but retained on a 1.18 mm screen and their respective bolus particles……….47 Figure 2.3.e. Difference in particle lengths distribution between grass silage particles and their
Figure 2.3.f. Difference in particle lengths distribution between corn silage particles and their
respective bolus particles………48
Figure 2.3.g. Difference in particle lengths distribution between TMR particles and their respective bolus particles………49
Figures 2.4. Lengths distribution of rye grass hay particles relative to respective bolus particles (dry and lactating cows averaged, a - g) - Image analysis after elimination of small particles by sieving through a 1.6 mm screen. Figure 2.4.a. Rye grass particles cut at 50 mm length and dried to hay versus respective bolus particles………...50
Figure 2.4.b. Rye grass hay particles retained on a 19 mm screen versus respective bolus particles……….51
Figure 2.4.c. Rye grass hay particles passing a 19 mm screen but retained on a 8 mm screen versus respective bolus particles………52
Figure 2.4.d. Rye grass hay particles passing a 8 mm screen but retained on a 1.18 mm screen versus respective bolus particles...53
Figure 2.4.e. Grass silage particles versus respective bolus particles...54
Figure 2.4.f. Corn silage particles versus respective bolus particles...55
Figure 2.4.g. TMR particles versus respective bolus particles...56
Figure 2.5. 1 - Cumulative lengths distribution of bolus particles retained on a 1.6 mm screen………...57
Figure 2.6. How many of the particles retained on a 1.6 mm screen are shorter than 5 mm?...58
Figures 2.7. Three theoretical examples (a – c) of how feed particle lengths and distributions might influence ingestive chewing, rumination, rumen fill and intake. I assumed that the frequency of chews needed before a certain feed can be swallowed depends on the longest particles in the mouth. I made further the following assumptions in order to simplify the cases and highlight the principles: • Particle lengths are proportional to volume. • Particles are broken into half during one chew. Figure 2.7.a. Example 1. Different proportions of feeds of different lengths are mixed together. Feeds differ in proportion of particles of individual lengths. ¾ Mean particle length: A > B. ¾ Ingestive chewing: A = B. ¾ Rumination: A > B, rumen fill: A > B, intake: A < B………...59 Figure 2.7.b. One feed has longer particles compared to the other. This is the case in our
experiment, where treatment feeds were particle residues on screens after a sequential sieving procedure. In reality, this case could occur when one feed is mixed longer in the mixer wagon compared to the other.
¾ Mean particle length: A > B. ¾ Ingestive chewing: A > B.
¾ Rumination: A = B, rumen fill: A = B, intake: A = B………..60 Figure 2.7.c. Both feeds have the same mean length, but differ in distribution. One feed has a wider
distribution of particle lengths compared to the other. ¾ Mean particle length: A = B.
¾ Ingestive chewing: A > B.
¾ Rumination: A < B, rumen fill: A < B, intake: A > B………..61 Figures 3.1. Mean particle distribution of bolus relative to mean rumen mat and fecal samples of four dry cows and four lactating cows. - Image analysis after elimination of small particles by sieving through a 1.6 mm screen.
Figure 3.1.a. Dry cows which were fed basically with long rye grass hay………75 Figure 3.1.b. Lactating cows which were fed with TMR………...76 Figures 3.2. Lengths distribution of dry cows rumen mat particles relative to long rye grass hay bolus and fecal particles- Image analysis after elimination of small particles by sieving through a 1.6 mm screen.
Figure 3.2.a. Rumen mat particles versus bolus particles...77 Figure 3.2.b. Rumen mat particles versus fecal particles...78 Figures 3.3. Lengths distribution of lactating cows rumen mat particles relative to TMR bolus and fecal particles- Image analysis after elimination of small particles by sieving through a 1.6 mm screen.
Figure 3.3.a. Rumen mat particles versus bolus particles...79 Figure 3.3.b. Rumen mat particles versus fecal particles...80 Figure 3.4. Example of how feed particle lengths and distributions might influence rumen fill,
intake, bolus, rumen mat and fecal particle length and distribution.
I assumed that the frequency of chews needed before a certain feed can be swallowed depends on the longest particles in the mouth.
I made further the following assumptions in order to simplify the cases and highlight the principles:
• Particles are broken into half during one chew, maximum length of particles to be swallowed, maximum length of particles passing to feces.
Feed A: TMR, different proportions of feeds of different lengths are mixed together. Feed B: Long hay.
¾ Mean feed particle length: A < B. ¾ Bolus mean particle length: A < B. ¾ Intake: A > B.
¾ Rumen mat particle length: A = B.
¾ Fecal mean particle length: A < B………..81 Figures 3.5. Variability of particle lengths distribution within rumen mat samples of four dry cows and four lactating – Image analysis after elimination of small particles by sieving through a 1.6 mm screen.
Figure 3.5.a. Dry cows which were fed basically with long rye grass hay………..83 Figure 3.5.b. Lactating cows which were fed with TMR………..83 Figures 3.6. Variability of particle lengths distribution within fecal samples of four dry cows and four lactating – Image analysis after elimination of small particles by sieving through a 1.6 mm screen.
Figure 3.6.a. Dry cows which were fed basically with long rye grass hay………..84 Figure 3.6.b. Lactating cows which were fed with TMR……….84 Figure 3.7. Comparison between dry and lactating cows rumen mat particle lengths distribution –
Image analysis after elimination of small particles by sieving through a 1.6 mm screen. Dry cows: long rye grass hay plus concentrate supplement.
Lactating cows: TMR...85 Figure 3.8. Comparison between dry and lactating cows fecal particle lengths distribution – Image analysis after elimination of small particles by sieving through a 1.6 mm screen.
Dry cows: long rye grass hay plus concentrate supplement.
Lactating cows: TMR...86 Figure 3.9. Comparison between mean* dry and lactating cows bolus particle lengths distribution –
Image analysis after elimination of small particles by sieving through a 1.6 mm screen. * Mean particle proportions of all treatment feeds……….87 Figures 3.10. Comparison between individual dry and lactating cows bolus particle lengths
distribution (a – h). 1 - Cumulative lengths distribution of bolus particles retained on a 1.6 mm screen from image analysis.
Figure 3.10.b. Rye grass particles cut at 50 mm length and dried to hay………..88
Figure 3.10.c. Rye grass hay particles retained on a 19 mm screen………..89
Figure 3.10.d. Rye grass hay particles passing a 19 mm screen but retained on a 8 mm screen………89
Figure 3.10.e. Rye grass hay particles passing a 8 mm screen but retained on a 1.18 mm screen………...90
Figure 3.10.f. Grass silage………..90
Figure 3.10.g. Corn silage………..91
Figure 3.10.h. TMR....………91
Figures 4.1. Variability of particle lengths distribution within TMR treatments – Image analysis of (a – e) after elimination of small particles by sieving through a 1.6 mm screen. Figure 4.1.a. Unprocessed TMR………107
Figure 4.1.b. TMR particles retained on a 19 mm screen………...108
Figure 4.1.c. TMR particles passing a 19 mm screen but retained on a 8 mm screen…………108
Figure 4.1.d. TMR particles passing a 8 mm screen but retained on a 2.5 mm screen………...109
Figure 4.1.e. TMR particles passing a 2.5 mm screen but retained on a 1.18 mm screen……..109
Figures 4.2. Mean* reduction of particle lengths during ingestive mastication – Image analysis of individual treatment TMR particles and respective boli (a – d) after elimination of small particles by sieving through a 1.6 mm screen. * Mean distribution within 3 mm intervals and, regarding the boli, means of three animals were considered. Figure 4.2.a. Unprocessed TMR………110
Figure 4.2.b. TMR particles retained on a 19 mm screen………...111
Figure 4.2.c. TMR particles passing a 19 mm screen but retained on a 8 mm screen………...111
Figure 4.2.d. TMR particles passing a 8 mm screen but retained on a 2.5 mm screen………..112
Figure 4.2.e. TMR particles passing a 2.5 mm screen but retained on a 1.18 mm screen...112
Figures 4.3. Lengths distribution of individual TMR treatment particles relative to respective bolus particles - Image analysis after elimination of small particles by sieving through a 1.6 mm screen. Figure 4.3.a. Unprocessed TMR...113
Figure 4.3.b. TMR particles retained on a 19 mm screen………114
Figure 4.3.c. TMR particles passing a 19 mm screen but retained on a 8 mm screen……….115
Figure 4.3.d. TMR particles passing a 8 mm screen but retained on a 2.5 mm screen………116
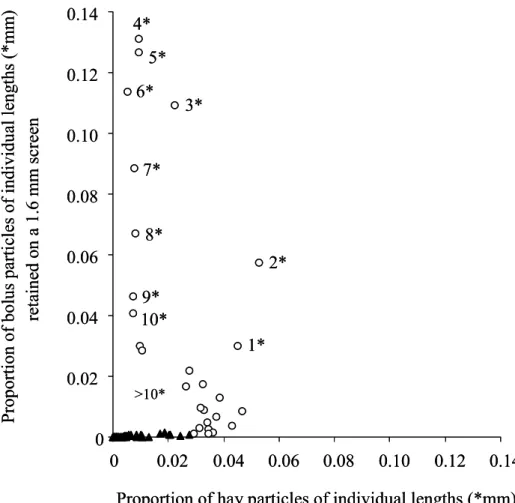
Figure 4.3.e. TMR particles passing a 2.5 mm screen but retained on a 1.18 mm screen………...117 Figures 4.4. Overall particle size reduction during the ingestive mastication.
Figure 4.4.a. Feed versus bolus dry matter proportions
of particles retained on a 1.6 mm screen………..118 Figure 4.4.b. Feed versus bolus mean lengths. Mean lengths were calculated from particles retained on a 1.6 mm screen and ≥ 5 mm………...119 Figures 4.5. Effect of chemical parameters (dry matter – DM, neutral detergent insoluble fiber – aNDF) on bolus mean particle length* (mm) relative to feed particle size.
Figure 4.5.a. Effect of feed DM on bolus mean particle length*.
* Mean length of particles retained on a 1.6 mm screen and ≥ 5 mm………..120 Figure 4.5.b. Effect of feed aNDF on bolus mean particle length*.
* Mean length of particles retained on a 1.6 mm screen and ≥ 5 mm………..121 Figures 4.6. Effect of chemical parameters (dry matter – DM, neutral detergent insoluble fiber – aNDF) on bolus dry matter proportions on a 1.6 mm screen relative to feed particle size.
Figure 4.6.a. Effect of feed DM on bolus dry matter proportions on a 1.6 mm screen………122 Figure 4.6.b. Effect of feed aNDF on bolus dry matter proportions on a 1.6 mm screen…………123 Figure 4.7. Effect of feed mean particle length* on bolus mean particle length* with feeds having
different dry matter (DM), but similar crude protein (CP) and neutral detergent insoluble fiber (aNDF) contents.
List of Tables
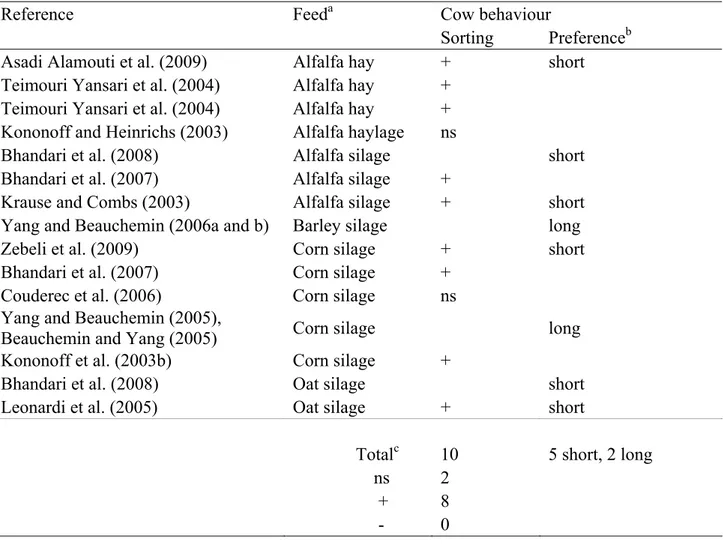
Table 1.1. Effect of diet particle size on sorting behaviour and preference of cows……….20 Table 1.2. Effects of diet particle size on dry matter intake (DMI), milk yield and composition, on
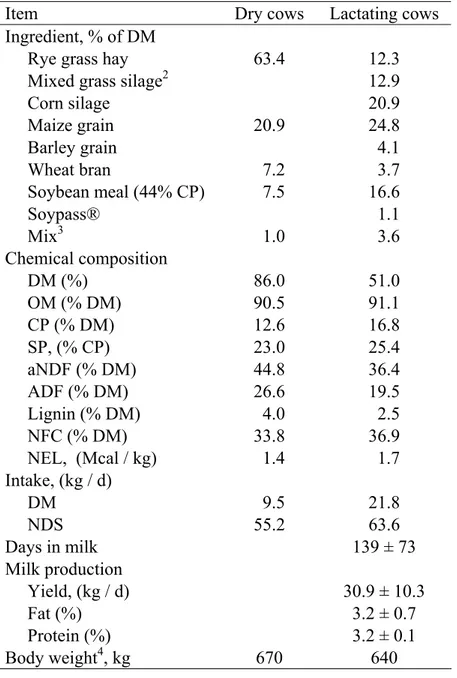
ruminal pH, chewing time and total tract digestibility in literature………21 Table 1.3. How could feed particle size influence milk production?...25 Table 2.1. Ingredient, chemical composition of diets, and intake, milk production and body weight
of dry and lactating cows………62 Table 2.2. Chemical composition of treatment feeds……….63 Table 2.3. Particle size reduction and number of chews during ingestive mastication - Least square
means (LSM) and standard error of mean (SEM) of
¾ proportional dry residues on a 1.6 mm screen (PROP_1.6),
¾ mean lengths (ML) of particles retained on a 1.6 mm screen and ≥ 5 mm,
¾ chews per grams dry matter (DM) ingested………...64 Table 3.1. Effect of physiological stage (dry versus lactating) of dairy cows on particle size of
bolus, rumen mat and fecal samples - Least square means (LSM) and standard error of mean (SEM) of:
¾ proportional dry residues on a 1.6 mm screen (PROP_1.6),
¾ mean lengths (ML) of particles retained on a 1.6 mm screen and ≥ 5 mm………92 Table 4.1. Feed ingredients, chemical composition and physical properties of TMRs as well as
respective milk production………...125 Table 4.2. Chemical composition of treatment feeds………...127 Table 4.3. Particle size reduction during the ingestive mastication – Dry matter proportion of
particles retained on a 1.6 mm screen (PROP_1.6) and mean length of these particles (≥ 5 mm considered) by image analysis………..128 Table 4.4. Percentage of 1 – 4 mm particles retained on a 1.6 mm screen………..129 Tables 4.5.Effect of chemical parameters (dry matter – DM, crude protein – CP, neutral detergent insoluble fiber – aNDF) on particle size reduction during ingestive mastication. - The test was performed on selected feeds, which had most similar particle sizea but different chemical characteristics (Rye grass hay versus TMR fractions).
Table 4.5.a. Effect of chemical parameters on bolus ML* (mm). Chemical parameters are not related to feed ML*.
Mean length of particles retained on a 1.6 mm screen and ≥ 5 mm………130 Table 4.5.b. Effect of chemical parameters on dry matter proportion retained on a 1.6 mm screen
Acknowledgements
I am grateful to Professor Giuseppe Licitra. He put trust in me and provided opportunities to study and to meet, work with and learn from extraordinary people like Professors Peter J. Van Soest, William H. Hoover, James D. Ferguson and David R. Mertens. All these people challenged my brain, invited me to logical thinking, and taught me something about nutrition of dairy cows and rumen function. I want to thank Stefania Carpino, who used to be not only a good colleague and superior for over 15 years, but also a good friend. Special thanks to my research group, to Giuseppe Azzaro, to Saro Petriglieri, to Carmelo Guardiano and his brother Gianluca. I know, I drove you crazy, once in a while, but I also think, that we made a very good team.
The support and encouragement of my husband has made this thesis possible. Thank you, Toti. Thank you, Rolf and Giuseppe, too, just for being around me.
CHAPTER 1
General Introduction
History of Feed Particle Size Evaluation in Nutrition of Dairy Cows
Research regarding possible effects of feed particle size in livestock production systems started probably when industry began to pellet forages. The Artificial dehydration of forage
increased chemical quality of forage because it allowed the harvest and conservation at an early and immature stage, independently from climatic conditions. The first device for artificial drying of forage, mentioned in literature, was developed already in 1894 by an English farmer named
Neilson. The Institute of Agricultural Engineering of the University of Oxford conducted a series of experiments on the artificial drying of hay crops in 1924 and 1925. During the following years several studies were performed in regard to exposure time and temperatures to use during the artificial drying procedure and the chemical quality of the forage product (Huffman, 1939). Pelleting and wafering processes were often combined to dehydration systems because reduced volume decreased costs of storage and shipping. Usually wafers consisted of highly compressed forage made from long or coarsely chopped material. On the other hand, to obtain pellets, forage was finely ground and compressed. At first, researchers saw an opportunity for a possible grain replacement by this new feed resource and started experiments in regard. Woodman et al. (1930), using dried grass protein cake, replaced all of the concentrate mixture and observed satisfactory milk and fat production. Farmers purchased finely ground forage because they were told that in this form forage was able to replace grain. Hope et al. (1950) found that milk production declined when 15, 30 or 45 per cent of the grain ration was replaced with a finely ground, dehydrated, cereal grass-legume mixture. Blosser et al. (1952) compared the value of dehydrated alfalfa in the ground, chopped, and pelleted forms when substituted for 30% of the grain ration. A slight advantage in milk yield was found for the dehydrated alfalfa pellets compared to the ground alfalfa, but yields for the chopped and dehydrated alfalfa were not different.
Farmers started to feed pellets and apparently, pelleting improved the value of fibrous feed for certain classes of livestock. Jensen and McGinnis (1952) demonstrated an advantage in pelleting laying diets containing high levels of alfalfa. Schneider and Brugman (1950) pelleted a ration containing 10 per cent alfalfa for growing fattening pigs and found that this ration produced significantly greater gains than the same ration unpelleted. Eaton et al. (1952) reported that calves fed artificially dried and pelleted hay gained more weight and ate more hay than calves fed field-cured field-baled hay or artificially dried and ground hay. Paladines et al. (1964) reported that
pelleted or finely ground, high-roughage rations improved the rate and efficiency of gain in growing fattening ruminants. Beardsley (1964) compiled data in a review of the effects of pelleting on intake, live weight gains and feed efficiency for several different forages fed to calves or yearlings and showed that, calculated on an individual comparison basis and averaged, pelleting a long hay increased the daily feed intake by 25%, increased daily gain by 98% and decreased feed required per unit of gain by 36%.
However, when finely ground or pelleted forages were fed to milking cows, the results on production were controversial. Some authors observed increased intake and production when pelleted forages were fed. Ronning et al. (1959) fed pelleted or chopped alfalfa hay to milk producing cows and observed that pelleting increased dry matter intake (DMI) and fat corrected milk (FCM) 4%, and that butterfat was unaffected. Brooks et al. (1962) fed Coastal bermudagrass either baled or ground and pelleted. Cows fed the pelleted Coastal bermudagrass produced more milk and FCM, had higher forage intake, gained more weight and milk with higher fat content than those fed the baled hay. Other authors found negative responses on production parameters. Milk fat was often reduced when fine ground and / or pelleted forages were fed. The production of milk with a low fat test by dairy cows fed a finely ground forage was first reported by Powell (1939).
Subsequently, numerous trials with ground or pelleted forage have been conducted to test this phenomenon. In the first of two trials conducted by Porter et al. (1953), milk yield was increased and there was a slight decrease in the butterfat percentage of milk, at the same time, when ground and pelleted alfalfa hay was fed. In the second trial, a real drop in butterfat percentage was observed but in this case, the consumption of roughage was much lower, apparently due to the hardness of the pellet used. Depression of fat % was also observed by Van Soest (1955) and Ensor et al. (1959) when finely ground hay was liberally fed. Jones et al. (1958) reported a drop in butterfat percentage from 4.1% on baled alfalfa hay to 4.0% on pelleted alfalfa hay, with the difference being
statistically significant. When forage was ground through 0.64 to 0.80 cm and through 0.95, 1.9, and 2.5 cm screens, slight depression in milk fat was observed by Appleman and Addis (1960) and by Haenlein et al. (1961), respectively.
The next step for research was to focus on possible explanations of these phenomena. Moore (1964) reassumed results from literature of these years in a symposium on forage utilization. The purpose of his presentation was to illustrate how the nutritive value of forage might be affected by its physical form. Cited from Moore (1964): “Compared to normal feeding practices when long or chopped hay is fed, the feeding of ground or pelleted forage results in more rapid prehension with less mastication. This results in less salivation with less secretion of buffer salts into the rumen. Since the feed particles are fine, there is less rumination and probably less stimulation of saliva
secretion. More rapid bacterial fermentation results with a rapid production of organic acids. There is an increased concentration of volatile fatty acids (VFA) and a consequent lowering of pH further intensified because of a lesser amount of buffer salts from saliva being present. The lowered pH may also increase the rate of absorption of organic acids from the rumen. Because the ground and pelleted forage is finer in particle size than long or chopped hay, this also results in an increased rate of passage from the reticulo-rumen which in turn lowers the amount of digestion which can take place in the rumen as well as the total digestibility of the dry matter (DM), particularly the cellulosic or crude fiber fractions. Because of the increased rate of passage of ground and pelleted forage from the rumen, more space becomes available for more feed which in turn results in greater consumption of feed DM.” Feed particle size might influences surface area of feed particles to be attached by rumen microorganisms, chewing and saliva production, intake and rumen retention time. All these parameters can affect microbial composition and growth in the rumen, production of volatile fatty acids and digestibility of feeds. Elliot and Loosli (1959), Palmquist and Ronning (1961) and King and Hemken (1962) measured a decline in milk fat percent that occurred with the feeding of ground, pelleted roughages and the changes in molar ratios of VFA in favour of
propionate relative to acetate. Baumgardt (1967) concluded that maximum efficiency of milk production should be achieved on rations which result in a ruminal acetate / propionate ratio of about 2.75. Blaxter and Graham (1956) and Rodrigue and Allen (1960) reported reduced digestibility, especially of the fiber fraction, the finer the forage was ground. However, limited digestibility was explained only several years later when microbiological measurements in rumen fluid were performed. Steward (1977) and Russell et al. (1980) showed that cellulolytic ruminal bacteria are sensitive to even modest declines in pH. Crawford et al. (1980) reported that protozoa in continuous cultures were maintained only at higher solids retention times of approximately 30 h and declined continuously when solids retention times were set at 22 and 14 h. All digestibilities tended to increase with increasing solids retention time and liquids dilution rate. However, most digestibilities reached a plateau at 22 h at dilution rates of 0.11 and 0.15 / h. Increasing SRT to 30 h resulted in little or no increase at these dilution rates.
Several authors proposed changes in feeding regimen in order to moderate milk fat
depression caused by pellet feeding. Palmquist et al. (1964) postulated that feeding hay pellets and grain at separate times provided a more even supply of rumen fermentation products for milk fat synthesis. Feeding pelleted forage four times rather than twice daliy (O’Dell et al. 1968, 1964) and feeding supplemental baled hay or corn silage to twice-daily-fed animals (O’Dell et al. 1964) prevented declines in milk fat. O’Dell et al. (1968) indicated that the critical grind size to effect milk fat depression was 0.64 cm. Chalupa et al. (1970) proposed that small quantities of
supplemental conventional forage (corn silage or baled hay) could alleviate the milk fat depression caused by feeding pellets as the sole forage.
Interests in regard of particle size of individual forages changed somewhat as soon as total mixed rations became the widespread adopted feeding system of dairy cows in the United States. First reports concerning the so called complete rations appeared in the mid 60’s. Until the late 50’ pasture was dominant forage for most dairy herds, followed by hay and silage. Cited from Coppock et al. (1981): “In the late 50’s and early 60’s, an important discovery was made concerning the ability of lactating dairy cows to respond to additional concentrates. As the average herd size increased in the 1960’s there was greater emphasis on labor efficiency. There seemed to be a
uniform tendency to feed all concentrates in the milking parlors, and parlors with associated feeding equipment were designed accordingly. As production increased and greater mechanization further reduced the time cows spent in the parlor, cows were not able to consume their required
concentrate. Some farmers added concentrate to the forage fed outside in a bunk in addition to parlor grain feeding. However, this often aggravates the problem of providing a correct protein-energy ratio across the complete production spectrum of the herd.” As a consequence, magnetically, transponder activated feeders or electronically controlled feeding systems were developed. Cows which ought to receive additional concentrate had a magnet, transponder or a cadmium plated key on the neck chain. Computer controlled feeders allowed individual concentrate feeding of each cow (Coppock et al. 1981). Another strategy to avoid grain feeding in the milking parlor was the feeding of cows with a complete or total mixed ration (TMR). It is defined as a quantitative mixture of all dietary ingredients, blended thoroughly enough to prevent separation and sorting, formulated to specific nutrient content, and offered ad libitum. This system was used much earlier for other livestock species, because dairy nutritionists felt that it was difficult to apply because of the wide range in energy requirements within a herd, and the consequent need for grouping of cows. Dairy farmers in the United States are feeding total mixed rations since the mid 60’s (Olson 1965, McCoy et al. 1966) and development of computerized diet formulation started about the same time (Howard et al. 1968, Chandler and Walker 1972). Nocek et al. (1986) compared feeding with TMR to
computer controlled feeder systems. The authors reported that the computer controlled feeder system was an effective method to allot grain in a freestall housing situation according to individual cow production. However, in the United States most dairy farmers adopted the TMR feeding. Silages in the TMRs were able to dilute and mask the flavour of unpalatable ingredients such as urea. Diet formulation for groups of cows might have been easier than diet formulation of
individual animals. The feeding system with TMR allowed the use of a wide range of concentrates and by-products at the same time, and diet formulation was not restricted to few components as it
might have been the case with computer controlled feeder systems. Long forage was not fed to cows in lactation anymore, because all ingredients were blended in the mixer wagon. In regard of particle size, the questions for farm management became how long forages should be chopped to produce good quality silages and how long feed ingredients should be blended in the mixer wagon to obtain optimal diet particle size. Diet particle size depended on both, initial particle size of feed ingredients, especially the forages, and mixing time. Farmers needed to consider that silages were further reduced in size during the mixing of the diet in the mixer wagon. The challenge for research was to define that diet particle size that was most efficient for nutrition of dairy cows.
Many research studies focussed on the understanding of the regulation of feed intake. Research Troelsen and Bigsby (1964) developed an artificial masticator to simulate particle breakdown in the rumen. Artificial mastication was carried out on samples from 14 hays that had been fed to sheep. Particle breakdown was highly correlated to feed intake. Van Soest (1966) suggested that the cell wall structure of plant materials is responsible for the volume occupied in the rumen by forage, even if partially digested and devoid of contents. Smith and Waldo (1969)
proposed a procedure to determine particle size breakdown in the gastrointestinal tract of ruminants. The authors suggested the use of neutral detergent as decribed by Van Soest (1966) prior to a
sieving procedure to allow particle size analysis of pelleted forages without the use of mechanical forces to disintegrate the pellets.
Balch (1950), Mertens (1973) and Waldo et al. (1972) have shown that digestibility is a function of the kinetics of digestion and passage. Intake of forages is related to fiber digestion because it is limited by the rate of disappearance of material from the digestive tract (Castle, 1956; Conrad et al.,1964; Crampton, 1957; Mertens, 1973; Thornton and Minson, 1972 ; Waldo, 1969). Based on these two concepts, Mertens and Ely (1979) developed a first dynamic, mathematical model which described the disappearance of forage fiber from the digestive tract of ruminants considering the kinetics of passage, particle size reduction and digestion. Cited from Mertens and Ely (1979): “The objective of many forage evaluation programs in animal science and agronomy is to assess forage quality for chemical and physical characteristics of the feed. Although many factors have been suggested and evaluated as determinants or indicators of forage quality, most have been discarded or found to be of limited use when used as the sole index of forage nutritive value. This suggests that accurate assessment of forage quality must include the interactions of the animal and its microorganisms with the chemical, morphological and physical properties of forages and the end products resulting from their utilization. Since it may not be feasible to measure and evaluate all relevant factors and interactions involved in forage quality in a single experiment, it was concluded that modeling and simulation can offer an excellent opportunity to delineate the role of animal and
plant characteristics in forage fiber digestion. A model of forage fiber digestion could provide information about digestibility and intake.”
Short diet particles are likely to increase intake but when roughage becomes limited in the diet because of the inclusion of grains or finely chopped forages, metabolic disorders often occured, even though the diet was adequate in all known nutrients. Lack of coarse material in the rumen reduced chewing activity (Balch et al, 1955; Sudweeks et al., 1980), reduced rumen motility diminished muscle tone (Colvin et al., 1978; Nocek and Kesler, 1980; Nocek et al., 1980). Some of the disorders resulting from low roughage intake were the fat cows syndrome (Morrow, 1976; Clark and Davis, 1980; Fronk et al., 1980), abomasal ulcers (Bide and Dotward,1975; Julien and Conrad, 1977), acidosis (Brent, 1976), rumen parakeratosis (Nocek and Kesler, 1980), displaced abomasums (Breukink and deRuyter, 1976), polioencephalomalacia (Brent, 1976), laminitis (Brent, 1976), ketosis (Fronk et al., 1980) and, in dairy cows, reduced milk fat percentage (Balch et al., 1955; Chalupa et al., 1970; Latham et al., 1974; Thomas, 1975; Murdock and Hodgson, 1979; Erdman et al., 1980). These diseases were not correlated directly to forage particle size itself but more to forage quantity and chemical composition of the diet. Only years later, forage particle size itself has been evaluated to possibly affect diseases such as left displaced abomasums (Shaver, 1990; Dawson et al., 1992, Shaver 1997) or subacute rumen acidosis (SARA) and laminitis (Stone 2004). Krause et al. (2002a, 2002b) fed lactating cows the same amount of fine or coarse alfalfa haylage with the same amount of either dry or high moisture corn. As expected, rumination and total chewing times were greater in the diets containing long haylage (Krause et al., 2002b), whereas effective ruminal digestibility of diet DM tended to be higher (P = 0.08) in the diets containing high-moisture corn (Krause et al.,2002a). Diets containing finer haylage particles and high-moisture corn reduced mean ruminal pH, the minimum daily pH, and both the time and area (time∗amount) below pH 5.8 compared with diets containing coarser haylage and dry ground corn (Krause et al.,2002b). The results from this study indicated that ruminal pH is influenced both by dietary components affecting chewing and salivary buffer secretion, and by those affecting ruminal carbohydrate fermentation. Forage particle size might be an important coparameter to influence occurrence and gravity of all diseases which are correlated to rumen pH and volatile fatty acid concentration and composition, because of its ability to regulate chewing activity, saliva flow to the rumen and buffering capacity. In the 70’s and 80’s, researchers knew from Balch et al. (1955) that chewing time and milk fat percentage of dairy cows were reduced as grain replaced long hay in the diet and that chewing time was reduced as particle size decreased. Chewing time became an indicator of roughage value. Sudweeks et al. (1975) studied effects of forage and concentrate types and amounts on chewing time and derived roughage indexes for those forages and concentrates. However, chewing changed
not only with forage quality (Welch et al. 1969), total DM, and forage intake (Sudweeks et al. 1980), but with particle length as well. In consequence, Santini et al. (1983) proposed to use adjusted forage intakes to predict roughage indexes. The adjusted forage intake was calculated by multiplying actual intakes of forages by mean particle length of the forage.
There was a need for a better description of particle size reduction including particle size distribution in feed, digestive tract and feces (Mertens and Ely, 1979). The concept of a critical particle size has been used in the development of models of digesta flow (Hungate, 1966; Baldwin et al., 1977; Ulyatt et al., 1976; Mertens and Ely, 1979). Particles that appear in feces have escaped the rumen and can be used to indicate the size of particles that do not need or stimulate chewing. Important studies have been performed in the 80’s to define this critical size. Poppi et al. (1985) concluded that particles retained on a 1.18 mm sieve had a high resistance to passage from the rumen of both cattle and sheep. Cardoza (1985) measured the particle size of feces from dairy cows fed 40 different combinations of forage and concentrate. He observed that <5% of fecal particles were retained on sieves with 3.35 mm apertures and that the median particle size of feces for dairy cows was retained on sieves with apertures of 0.4 to 1.18 mm. Mertens (1997) concluded that particles passing a 1.18 mm screen readily pass out of the rumen and provide little stimulus for chewing and defined only particles retained on this screen to be physical effective. There were already some previous concepts of effective fiber or roughage replacement values that could be used quantitatively to formulate rations that would maintain the production of milk fat. These effective fiber values were based on different standards, such as cottonseed hulls (Harris 1984), hay (Gleaves et al., 1973; Milligan et al. 1981), or alfalfa silage (Clark and Armentano, 1993; Swain et al., 1994). Mertens (1986) suggested that the role of physical characteristics of feeds would be elucidated more clearly if the differences in chemical fiber (NDF) among feeds were removed. He suggested a system for assessing the roughage value of feeds based on a theoretical standard (long grass hay containing 100% NDF). Mertens (1986) standardized the effectiveness values that had been proposed previously (Clark and Armentano, 1983; Harris, 1984; Swain et al., 1994) so that they would be on the long grass standard scale and used those values as roughage value adjustment factors that could be multiplied times NDF. However, nowadays, the term “physical effective fiber” or “physical effective NDF (peNDF)” usually refers to the concept presented by Mertens (1997). He proposed a laboratory method to assess physical effective NDF, which included the determination of the feed dry proportion on a 1.18 mm screen using a vertical sieving technique. The proportional dry residue had to be multiplied by the NDF content of the sample in order to obtain physical effective NDF. This parameter is used in current nutrition models, such as CPMDairy Version 3.0.8
(Cornell University, Ithaca, NY; University of Pennsylvania, Kennett Square, PA; and William H. Miner Agricultural Research Institute, Chazy, NY).
About the same time Mertens published his concept, Lammers et al. (1996), proposed a simple tool to use on the farm to assess feed particle size. The standard method for determining the particle size distribution of chopped forages was standard S424.1 of the American Society of Agricultural Engineers, ASAE (ANSI, 1993). The screens of the ASAE device had nominal openings in the screens of 19.0, 12.7, 6.3, 3.96, and 1.17 mm from the top to the bottom screen, respectively. It was designed for chopped forage material only. Sample drying and sieving procedure were expensive and time consuming. Lammers et al. (1996) designed a simplified separator with two screens and a bottom pan. The hole sizes were selected to match the expected distribution of feed particles based on results of samples in the ASAE device. Screens were needed to characterize the larger particles that were of interest and to separate the sample into measurable fractions. Because the larger particles were more important, the top screen was selected to measure the larger particles, and the bottom screen was selected to separate the remaining portion nearly equally. These hole sizes also gave two points that were far enough apart to increase the reliability of the slope of the particle size distribution line. The diameters of the hole sizes of the screens were 19 and 8 mm for the top and bottom, respectively, dividing the sample into three portions: material greater than 19 mm in length remaining on the top screen, material between 19 and 8 mm in length on the middle screen, and material less than 8 mm in length on the bottom pan. The authors
proposed a horizontal, manual sieving technique on the wet material, which could be used directly on the farm, avoiding a previous sample drying procedure. The sieving equipment was called Penn State Particle Separator (PSPS). Even though the original apparatus was widely accepted by nutritionists, most of a TMR’s concentrate (typically formulated at 40 to 60%), passed through the 8.0 mm sieve. As a result, an additional sieve containing a pore size of 1.18 mm was developed and pretended to more accurately describe the smaller particle fraction of TMRs (Kononoff et al., 2003a). The authors selected the pore size of 1.18 mm for this additional sieve relying on the 1.18 mm screen which was recognized to retain particles which don’t pass easily from the rumen (Poppi et al., 1985). However, the authors didn’t consider the fact that PSPS method provided a horizontal sieving technique, separating particles more likely by their lengths, whereas Poppi et al. (1985) used a vertical technique, where particles were more likely separated by their widths. The authors should have probably selected a screen with bigger openings in order to separate particles which are more likely to be retained in the rumen from the fraction which contains the smallest particles presumably passing to feces. In the Penn State Technical Bulletin, DAS 02-42 (Heinrichs and Kononoff, 2004) several recommendations are reported: “If corn silage is the sole forage, at least 8 percent of the
particles should be in the upper sieve of the separator, compared to a minimum of 3 percent when corn silage is not the sole forage. The chop length of corn silage must balance good packing and fermentation with extremely short, pulverized forage. This means 45 to 65 percent of the silage material should remain on the middle sieve and 30 to 40 percent on the lower sieve of the separator. If the last screen is used for corn silage, no more than 5 percent should be recovered in the bottom pan. As corn silage makes up a greater proportion of the ration, more material should remain in the middle two sieves and less in the top sieve and bottom pan. Up to 20 percent of haylage should remain on the upper sieve. The middle sieve should contain 45 to 75 percent of the haylage and the lower sieve 20 to 30 percent. As with corn silage, no more than 5 percent of the material should be retained on the bottom pan. Guidelines for TMRs for high producing dairy cows are 2 to 8 percent of the particles in the upper sieve, 30 to 50 percent in the middle and lower sieves, and no more than 20 percent in the bottom pan.” The PSPS, with or without the additional screen is widely used today and not only as a on farm tool, but also for research. However, it is probably not a good tool to describe mean particle length and has some more limitations when used for research. Cited from Mertens (2005): “Separation of undried feeds with gentle shaking is often incomplete because small particles adhere to large particles and this is especially true for small starch particles. In addition, the particle size distribution of undried forages and total mixed rations can be biased if larger and smaller particles have different DM concentrations.” Mertens (2005) recommended a vertical sieving procedure on dry material using a set of 9 sieves and a bottom pan. He required complete separation, which is defined by the shaking time needed to reach the maximum plateau weight of residue in the bottom pan. To minimize bridging of material on sieves, an adequate sample size should be used, no sieve should contain more than 25% of the total sample and additional sieves in the geometric progression should be added to meet this restriction. The top sieve should not retain significant material because it is impossible to calculate the average size of its retained particles because there is no sieve above it through which the particles have passed. If less than 2% of the material is retained on the top sieve, it is acceptable to estimate the size assuming a geometric progression of sieves. Similarly it is impossible to calculate the average geometric mean size of particles in the pan because the pan has an aperture of zero. However this problem is not as serious as for the top screen. The disadvantage of a vertical sieving technique is that it separates particles by the width. In consequence, the calculated mean size represents mean width and has to be converted to length. Igathinathane et al. (2009) confirmed length-based separation inconsistency as a definite feature of mechanical sieving. They concluded that the passing of particles slightly smaller than twice the opening dimension cannot be avoided. The maximum deviation observed in particle lengths was in excess of 17 times with respect to opening dimensions of standard sieves.Mertens et
al. (1984) reported that the length of sieved corn silage particles were about 3.4 times their width. The ANSI (1993) method used horizontal shaking and the diagonal dimension of the square opening (which is √ 2 times the square dimension) for determining mean particle length. Mertens (2005) suggested to multiply the mean particle size by 4.8 to approximately estimate the mean particle length. On the other hand, vertical sieving allows complete separation. Complete separation isn’t possible with a horizontal procedure as it is provided by the PSPS method. Some particles, which are longer than the sieve aperture will always fall through. The longer the sieving time the higher the probability that particles are divided by their width as well. Square or circular openings don’t prevent “falling through” or “nose diving” effect of lengthier particles passing through smaller sized sieve openings. In consequence, sieves with thicker walls were designed (ASABE Standards S424.1, 2007) to help restrict the easier passing of lengthier particles. However, Womac et al. (2007) observed this length-based separation inconsistency in particles size analysis of knife-milled ground corn stover, switchgrass, and wheat straw even, using ASABE design sieves
(ASABE Standards S424.1, 2007) with thicker walls. Their measurements of particle length with a digital caliper were roughly five times greater than the geometric mean dimensions calculated from sieving results. Based on their results, they emphasized that sieve analyses of irregular shaped particles offer only relative comparisons, and that actual dimensions of particles retained on sieves are not necessarily represented by sieve opening sizes above and below the sample. A horizontal technique can’t allow bouncing of particles, because then again separation would be more by
particle width rather than length. In order to obtain repeatable results the shaking must follow a very strict and detailed procedure. According to Kononoff at al. (2003a) the sieve has to be shaken horizontally five times in one direction, then rotated one fourth turn, and again shaken five times. The procedure has to be repeated for eight sets of five replications for a total of 40 shakes. One shake is considered as a forward and backward motion over a distance of 17 cm. Estimates of particle mean lengths calculated from particle residues on 2 or 3 screens only, are probably of poor accuracy anyway, especially when high residues on the top screen are measured.
A computer vision based image processing method can be considered as an alternative or even a replacement for sieve analysis. The square or circular openings of standard sieves, in the strictest sense, only allow “width-based separation” of particles. That is, these openings truly
restrict particles of width larger than the sieve opening dimension irrespective of particle orientation with respect to the openings (Igathinathane et al., 2008a). Igathinathane et al. (2009) determined the effect of number of virtual sieves by simulation with respect to sieveless analysis involving all distinct particles. The number “10” indicated the approximate number of sieves that can be handled generally in a single nest of mechanical sieve shakers. Only a close match to the results from
sieveless analysis was obtained from sieving results that used more than 50 simulated sieves (75 and 100 sieves). However, image analysis have some restrictions as well. The two basic
requirements of computer vision digital image based size and size distribution analysis are an input image and an image processing algorithm. Devices for image acquisition include digital cameras, charge-coupled device cameras (Visen et al., 2004) or flatbed scanners (Shahin et al., 2006; Igathinathane et al., 2008a,b, 2009). For better results with image preprocessing, clear contrast between particles and background is essential. The definition of length and width of a irregular shaped particle, as it might occur with forage particles, might not be an easy decision. Particle separation might be the biggest impediment for a precise particle size determination, especially when samples containing very small particles are examined. Arrangement of the particles with respect to one another other is another important aspect. A singulated arrangement of particles (disjoint particles without overlap or touching one another) makes the preprocessing algorithm simpler avoiding the need for specialized singularization algorithms like watershed or successive erosion and dilation (Shahin and Symons, 2005). Manual separation is labor intense and analysis of a reduced sample size might lead to lost in precision when samples are analyzed which contain particles heterogeneous in size and which are not well mixed. The definition of a sampling procedure and a minimum sample to analyze might become the crucial requirements for correct particle size analysis using image processing methods.
Effects of Feed Particle Size on Diet Utilization and Cow Performance Reported in Literature
A new aspect of feed particle size in regard of dairy cows’ nutrition emerged since TMR feeding has been adopted. Several available ingredients are mixed together at individual proportions in order to obtain necessary nutrient composition which ensures the optimal nutrition of the dairy cow. Each animal ought to eat each feed ingredient at the same proportion the ingredient goes to the diet. In consequence, the diet needs to be mixed very well and any type of feed sorting from the animal side should be avoided. The sorting of animals leads to unbalanced nutrition not only of the animals which sort but also of those which don’t sort. Feed sorting has been related to left displaced abomasum (Shaver, 1997), to ruminal acidosis and laminitis (Stone, 2004). In general, all diseases and responses in terms of production which are attributed to over or under nutrition of feed
components can occur when cows sort for individual ingredients of the diet. If ingestion was
selective large diurnal variation in acid production may result in ruminal disorders, which contribute to a rapid depression of DMI (Krause and Oetzel, 2006). Sorting behavior can be assessed by
each feed fraction retained on individual screens was calculated as the actual intake of each fraction expressed as a percentage or proportion of the predicted intake of that fraction (Leonardi and Armentano, 2003; Zebeli et al., 2009). Studies in which feed sorting has been considered are listed in table 1.1. In 8 out of 10 studies sorting behavior was related positively to feed particle size, in only 2 studies feed particle size was not significantly related to sorting. The longer the particles were the more sorting occurred. In most studies, cows selected in favor of the smaller particles, but not always. In 5 out of 7 studies, cows sorted against the long particles, but in 2 of the studies, the cows seemed to prefer the longer particles. Qualitatively, the cows are able to sort feedstuffs in their diets and usually the really eaten diet contains more concentrate and fine particle forages than the distributed diets. The major constituent of fine particles in the diet is grain of low particle size which is easily fermented by rumen microbiobia. The difference between bunk contents before and after distribution can reveal a lack of physical structure for the animals, at least during the first meal after distribution, when cows first eat fine particles. Moreover, sorting behaviour can largely vary among cows, and in a free-stall barn, where sorting cows are free to move to minimally sorted TMR, this sorting behaviour could be enhanced (Leonardi and Armentano, 2003). Adding long particle hay to the diet can be inefficient for chewing stimulation on these cows (Armentano and Leonardi, 2003).
Bhandari et al. (2008) fed a diet containing both alfalfa silage and oat silage, which were varying in chop length. There was no effect of diet particle size on chewing time and rumen pH, but rumen pH was low for all diets, even for the diets containing longer chopped forage. The duration of the rumen pH below 5.6 was greater than 120 min / d for all diets. Hence, it could not be excluded that these diets did not induce subacute ruminal acidosis (SARA). Also, the milk fat percentages of all diets were low and an inversion of the milk fat percentage and milk protein percentage occurred for all diets, which suggested SARA (Kleen et al., 2003; Stone, 2004). The authors explained the onset of SARA despite apparently adequate dietary NDF and particle size distribution by sorting of the cows against long feed particles in favour of short feed particles. On the other hand, cows with induced acidosis and given free choice alfalfa hay or pellets preferentially ate hay (Keunen et al., 2002), which was interpreted by the authors as an attempt to attenuate acidosis. Yang and Beauchemin (2005, 2006a, 2006b) observed similar cow behaviour, where cows selected longer rather than the shorter particles. The authors concluded that dairy cows may intentionally select long feed particles to meet their need for physically effective fiber when ruminal pH is low due to low intake of peNDF. How should diet particle size be to avoid sorting behaviour? Leonardi et al. (2005) reported that particles longer than 26.9 mm may be selected against by some cows. The authors suggested to achieve adequate mean particle length with the least amount of particles longer than 26.9 mm and the greatest amount of particles between 26.9 and 9 mm to obtain a uniform response across the entire herd. Asadi Alamouti et al. (2009) observed increased sorting of the diet against particles > 19mm, and in favour of those < 8 mm (p < 0.05), when diets with
long forage particles were fed. It might be difficult to exactly define possible diet particle size at which sorting behaviour is reduced to a minimum. However, if cows selected against particles > 19 mm, and particles smaller that size which are retained on the 8 mm PSPS screen are still considered to stimulate chewing, than the farmer should probably adapt chop lengths of forages for silage and mixing times of diet ingredients in the mixer wagon to obtain TMR particles which contain only very small amounts to be retained on the top PSPS screen and most possible particles to be retained on the second PSPS screen with 8 mm openings.
Since decades research studies have been performed to test influence of feed particle size on
milk yield, composition and animal health. There is some evidence that feed particle size could alter intake, saliva flow to the rumen and buffer capacity of the rumen, as well as digestibility. Smaller particles might require less chewing, and less saliva might be produced. Smaller particles might be reduced at a shorter time to a size which allows passage through the reticulo-omasal orifice and in consequence cows might be able to eat more, as free space in the rumen increases. Increased intake might allow longer particles to pass through the reticulo-omasal orifice. Luginbuhl et al. (1990) found mean rumen mat and fecal particle size increased when steers had higher levels of intake. Deswysen and Ellis (1990) measured longer particles in the dorsal sac and feces of heifers with higher intake. The authors of the latter study observed that higher voluntary intake was positively related with duodenal DM digesta flow per opening of the reticulo-omasal orifice. Explanation of digestion might be more complex. It probably depends on particle surface in the rumen plus retention time. Smaller feed particles in the rumen have bigger surface areas and may promote microbial attachment and nutrient degradation (Bowman and Firkins 1993). Nutrient availability in the rumen determines microbial composition and growth. On the other hand, smaller rumen
particles are more prone to pass out of the rumen than bigger ones (Poppi et al 1985). In other words, smaller rumen particles might deliver nutrient faster to rumen microbes, but microorganisms have less time for consumption. The opposite concepts apply to longer rumen particles. However, the longer particles might be able to trap smaller ones, and increase rumen retention time also for particles which would be small enough to pass out from the rumen easily. The chewing itself, and the buffer flow in consequence, might alter absorption of VFA through the rumen wall and might influence digestion as well. Cellulolytic ruminal bacteria are very sensitive to pH and cannot survive at low pH. The understanding of how feed particles are chewed and of what size ingested particles are might be important to comprehend whether and how feed particle size can influence cow performance, milk composition and animal health.
In table 1.2, 36 research studies are listed in which feed particle size has been evaluated to influence several parameters, such as chewing time, rumen pH, total tract digestibility, DMI, milk
yield and composition. Forage and diet particle sizes which were tested varied between studies as well as the forage type itself. Evaluated forages consisted in alfalfa hay, silage and haylage, and corn, oat and barley silage. In 18 studies, where eating time, in terms of minutes per kg DMI, has been measured, 8 studies reported positive correlation of particle size (eating lasted longer the longer the particles were), and 10 reported no significance. In 20 studies, where effects of diet particle size on rumination time, in terms of minutes per kg DMI, have been investigated, 15 were positively correlated to feed particle size and 5 were not significant. In 15 trials, where diet particle size effects on DM and organic matter (OM) total tract digestibility have been evaluated, 8 reported no significant effect, 4 reported DM and 5 OM digestibility to be higher when longer particle diets were fed, and 3 and 2 reported the opposite effect on DM and OM, respectively. In 16 studies, where NDF total tract digestibility has been measured, 5 reported no particle size effect, in 9 studies digestibility was higher when longer particles were fed and in 2 the opposite observations were made. In 11 experiments, where effects on CP total tract digestibility have been evaluated, 5 found no effect, 4 reported higher and 2 lower digestibility when longer diets were fed. Starch digestibility has been evaluated in 10 experiments, and in none of the studies effects of diet particle size were reported. Out of 28 studies, where rumen pH has been determined, 9 reported higher and 2 lower pH, when longer particles were fed, and in 17 studies no effect of diet particle size on rumen pH was observed. DMI was measured in 35 trials, in 13 lower and in 3 higher intake was observed when diet contained longer forages, 19 found DMI not altered by feed particle size. Particle size effects on milk yield have been evaluated in 36 studies. In 33 no effect was observed, 1 found increased and 2 decreased milk production when diets with longer particles were fed. In 36 studies changes in milk fat % were determined, with 24 showing no particle size effects, 10 reporting increased and 2 decreased fat %. Milk protein % and lactose % have been evaluated in 36 and 17 experiments, respectively. Protein % was affected by feed particle size only 5 times positively and 4 times negatively. Reduced milk lactose % was related to feeding of longer particles only in 1 study, in 16 studies no feed particle size effect has been observed. In the investigated studies, diet particle size apparently had most effects on rumination time / kg DMI (with 75% positive responses), followed by NDF total tract digestibility (56% positive responses), eating time / kg DMI (44% positive responses), DMI (37% negative responses) and milk fat % (28% positive responses). However, results of the cited literature are often contrasting. Nutrient requirements of the animals, as well as mass, chemical composition and physical from of the nutrients fed might interact and define as a whole concept the abovementioned responses. Threshold size of feed particles to influence these parameters might vary in base of chemical nutrient requirement and feeding, and effects of chemical nutrient feeding might vary in base of chemical nutrient requirement and feed