PROCESS OPTIMIZATION OF
A LIGNOCELLULOSIC
MULTI-PRODUCT BIOREFINERY
Aristide Giuliano
UNIONE EUROPEA UNIVERSITÀ DEGLI STUDI DI SALERNO
Department of Industrial Engineering
Ph.D. Course in Chemical Engineering
(XIV Cycle - New Series)
Thesis in Chemical Engineering
PROCESS OPTIMIZATION OF A
LIGNOCELLULOSIC MULTI-PRODUCT
BIOREFINERY
Supervisor
Ph.D. student
Prof. Diego Barletta
Aristide Giuliano
Scientific Referees
Prof. Massimo Poletto
Prof. Giancarlo Raiconi
Ph.D. Course Coordinator
Prof. Paolo Ciambelli
Articles on refereed journals:
Giuliano, Poletto, Barletta; Process optimization of a multi-product biorefinery: the effect of biomass seasonality; Chemical Engineering Research and Design (2015) DOI: 10.1016/j.cherd.2015.12.011
Giuliano, Cerulli, Poletto , Raiconi, Barletta; Flowsheet Optimization of a Multi-product Lignocellulosic Biorefinery. Part 1: MILP approach for a reference economic scenario (submitted to Industrial & Engineering Chemistry Research);
Giuliano, Poletto, Barletta; Flowsheet Optimization of a Multi-product Lignocellulosic Biorefinery. Part 2: Effect of Reaction Yield and of Economic Parameters (submitted to Industrial & Engineering Chemistry Research);
Articles on book series:
Giuliano, Cerulli, Poletto, Raiconi, Barletta; Optimization of a Multiproduct Lignocellulosic Biorefinery using a MILP Approximation; Computer Aided Chemical Engineering, 2014;
Giuliano, Poletto, Barletta; Process Design of a multi-product Lignocellulosic Biorefinery; Computer Aided Chemical Engineering, 2015;
Summary
Articles on refereed journals: ... III Articles on book series: ... III Table captions ... VI Figure captions ... IX Abstract ... XIV
1. Introduction ... 1
1.1 Biorefinery, Biofuels, Biochemicals ... 1
1.2 Process Synthesis methods ... 4
1.3 Process design and optimization of multi-product biorefineries ... 7
1.4 Biomass seasonality ... 9
2. Aim of the work ... 11
3. Superstructure... 13
3.3 Hydrolysis and fermentation ... 18
3.3.1 Acid hydrolysis and levulinic acid production ... 18
3.3.2 Enzymatic hydrolysis... 20
3.3.3 Hemicellulose dilute acid hydrolysis ... 21
3.3.4 Ethanol and succinic acid fermentations ... 22
3.4Separation and purification ... 23
3.4.1 Levulinic acid purification ... 23
3.4.2 Ethanol purification ... 26
3.5 Thermochemical conversion ... 29
3.6 Potential mass and heat integration of flowsheet ... 31
4. Mathematical modelling and optimization methodology ... 33
4.1 Mathematical modelling ... 33
4.2 Material balance constraints ... 34
4.3 Energy balance constraints ... 36
4.4 Heat integration ... 37
4.5 Reactor modelling ... 38
4.6 Equipment sizing ... 43
4.7 Capital costs ... 44
4.8 Total annual cost... 45
4.9 Profitability ... 45
4.9 MILP solving method ... 46
4.10 Biomass seasonality ... 51
4.11 Biomass feedstocks ... 53
5. Results ... 55
5.1 Base case results ... 55
5.1.1 Process flowsheets, biomass allocation and product yield ... 55
5.1.2 Economic and profitability analysis ... 59
5.2 Base case results with reactor modelling ... 61
5.2.1 Base case: maximization of the NPV ... 62
5.2.2 Sensitivity analysis... 64
5.2.2.2 Products selling price ... 65
5.2.2.3 Discount rate... 66
5.2.3 Maximization of the IRR ... 67
6 Results for biomass type and seasonality ... 73
6.1 Process flowsheets, biomass allocation and product yield ... 74
6.2 Economic and profitability analysis ... 84
7. Process synthesis of the biorefinery ... 89
7.1 1° iteration results ... 93
7.1 2° iteration results ... 95
7.2 3° iteration results ... 97
8. Conclusions ... 99
References ... 103
Abbreviations and symbols ... 114
ABBREVIATIONS... 115
SYMBOLS ... 115
Appendix ... 118
Reactor modeling ... 119
Dilute acid hydrolysis with HCl (R1/R3) (Shen & Wyman 2012): .. 119
Dilute acid hydrolysis with H2SO4 (R2/R4) (Girisuta et al. 2008): .. 120
Enzymatic hydrolysis (R5) (Kadam et al. 2004): ... 121
Acid hydrolysis of hemicellulose (R6) (Lee et al. 2000): ... 123
Ethanol fermentation (R8) (Leksawasdi et al. 2001): ... 124
Table captions
Table 3-1: Pretreatment parameters for the optimization model.
Table 3-2: Equipment description of hydrolysis and fermentation section. Table 3-3: Equipment description of separation and purification section. Table 3-4: Product yields for the purification sections.
Table 3-5: Equipment description of thermochemical conversion section. Table 4-1: Product yields for the reactors at fixed yields.
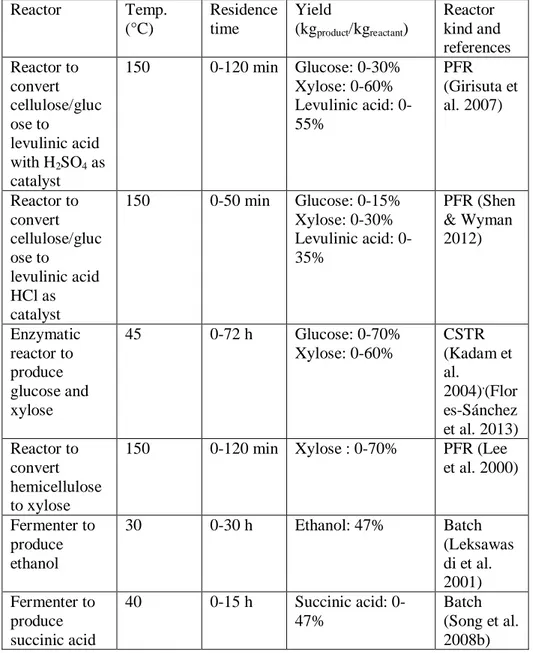
Table 4-2: Product yields for the reactors.
Table 5-1: Main parameters for the optimization model.
Table 5-2: Sensitivity results of the economic analysis on plant size and biochemicals selling price by maximizing the net present value
Table 6-1: Biomass price and composition (from Silvia-Fernandes et al, 2015a).
Figure captions
Figure 1-1: Representative diagrammatic framework of lignocellulosic biomass.
Figure 3-1: Superstructure of the multi-product lignocellulosic biorefinery (the dashed lines are exclusive).
Figure 3-2: Flowsheet for the pretreatment section.
Figure 3-3: Flowsheet for the hydrolysis and fermentation section. Figure 3-4: Superstructure of enzyme production section (the dashed lines are exclusive).
Figure 3-5: Flowsheet for the separation and purification section of levulinic acid.
Figure 3-6: Flowsheet for the separation and purification section of ethanol.
Figure 3-7: Flowsheet for the separation and purification section of
succinic acid.
Figure 3-8: Flowsheet for the thermochemical conversion of lignin. Figure 5-1:Optimal process flowsheet of the biorefinery.
Figure 5-2: Biomass allocation for the lignocellulosic multi-product biorefinery.
Figure 5-3: Product yields for the lignocellulosic multi-product biorefinery. Black: levulinic acid yield; Mesh grey: ethanol yield; Striped grey: succinic acid yield; Grey: total yield.
Figure 5-4: Manufacturing cost distribution for the lignocellulosic biorefinery.
Figure 5-5: Capital cost distribution for the lignocellulosic biorefinery. Figure 5-6: Optimal NPV flowsheets of biorefinery for base case and variants: a) base case; b) biomass feed rate 5 t/h (0.1 times the base case); c) levulinc acid selling price7.50 $/kg(+50% of the base case).
Figure 5-7: Objective function (net present value) and internal rate of return for each value of the discount rate. Net present value (•); internal rate of return (■).
Figure 5-8: Biomass allocation (a) and product yields (b) for the base case by maximizing the net present value and the internal rate of return. Black: levulinic acid; dark grey: ethanol; light grey: succinic acid.
Figure 5-9: Capital cost for the lignocellulosic biorefinery by maximizing the net present value and the internal rate of return. Black: pretreatment section; dark grey: hydrolysis and fermentation section; light grey: separation and purification section; striped grey: thermochemical conversion section.
Figure 5-10: Cost distribution for the lignocellulosic biorefinery
by maximizing the net present value and the internal rate of return. Black: raw material cost; dark grey: enzymes and reactants cost; light grey: utility cost; striped grey: other manufacturing cost.
Figure 5-11: Net present value for the lignocellulosic biorefinery
by maximizing the net present value and the internal rate of return. Figure 6-1: Optimal flowsheet using net present value as objective function. a) for eucalyptus; b) for wheat straw; c) for olive pruning.
Figure 6-2: Optimal flowsheet for the season-based biorefinery using net present value as objective function. a) case SB: three periods with a single biomass feedstock each; b) case SC: 1st period with eucalyptus, 2nd period with eucalyptus and wheat straw, 3rd period with eucalyptus and olive pruning.
Figure 6-3: Optimal flowsheet using internal rate of return as objective function. a) for eucalyptus; b) for olive pruning.
Figure 6-4: Biomass allocation (kg of biomass used to obtain a product / kg of biomass feed) using net present value as objective function. Black: biomass to levulinic acid; Grey: biomass to ethanol; Striped: biomass to succinic acid.
Figure 6-5: Product yields using the net present value as objective function. Black: levulinic acid yield; Grey: ethanol yield; Striped: succinic acid yield.
Figure 6-6: Product yields using the net present value as objective function for the case with a single biomass feedstock. Black: levulinic acid yield; Grey: ethanol yield; Striped: succinic acid yield.
Figure 6-7: Product yields using the net present value as objective function for 1st period with eucalyptus, 2nd period with eucalyptus and wheat straw, 3rd period with eucalyptus and olive pruning. Black: levulinic acid yield; Grey: ethanol yield; Striped: succinic acid yield.
Figure 6-8: Biomass allocation (kg of biomass used to obtain a product / kg of biomass feed) using the internal rate of return as objective function. Black: biomass to levulinic acid; Grey: biomass to ethanol; Striped: biomass to succinic acid.
Figure 6-9: Product yields using the internal rate of return as objective function. Black: levulinic acid yield; Grey: ethanol yield; Striped: succinic acid yield.
Figure 6-10: Product yields using the internal rate of return as
objective function for the case with a single biomass feedstock. Black: levulinic acid yield; Grey: ethanol yield; Striped: succinic acid yield.
Figure 6-11: Product yields using the internal rate of return as
objective function for 1st period with eucalyptus, 2nd period with eucalyptus and wheat straw, 3rd period with eucalyptus and olive pruning. Black: levulinic acid yield; Grey: ethanol yield; Striped: succinic acid yield.
Figure 6-12: Total investment cost using as objective function: net present value (black bar), internal rate of return (grey bar).
Figure 6-13: Total annual cost distribution using the net present value as objective function.
Figure 6-14: Net present value using as objective function: net present
value (black bar), internal rate of return (grey bar).
Figure 6-15: Internal rate of return using as objective function: net present value (black bar), internal rate of return (grey bar).
Figure 7-1: Process optimization algorithm to obtain the optimal process design.
Figure 7-2: Optimal flowsheet for the base case of the multi-product biorefinery.
Figure 7-3: Product yields for the MILP model (dark bar) and for process simulation (light bar).
Figure 7-4: NPV obtained with the MILP model (dark bar) and with process simulation (light bar).
Figure 7-5: Biomass allocation for all iterations.
Figure 7-6: Optimal flowsheet for the second iteration by ampl.
Figure 7-7: Product yields for the MILP model (dark bar) and for process simulation (light bar) for the second iteration.
Figure 7-8: NPV obtained with the MILP model (dark bar) and with process simulation (light bar) for the second iteration.
Figure 7-9: Optimal flowsheet for the final process opimization.
Figure A-1: Product yields as a function of residence time in PF reactors operating: a) a dilute acid hydrolysis with HCl; b)a dilute acid hydrolysis with H2SO4; c) levulinic acid production with HCl; d) a levulinic acid production with H2SO4. Product legend: — — —, glucose; – – –, HMF; — ——, levulinic acid; • • • • •, xylose; - - - -,furfural; — • • —, formic acid.
Figure A-2: Product yields in an enzymatic hydrolysis CST reactor. Product legend: — — —, glucose; – – –, xylose; - - - -.
Figure A-3: Product yields in a batch fermenter for ethanol production. Product legend: — — —, ethanol from glucose; — • • —, ethanol from xylose; – – –, CO2 from glucose; • • • • •, CO2 from xylose.
Figure A-4: Product yields in a batch fermenter for succinic acid production. Product legend: ———, succinic acid from glucose; — — —, succinic acid from xylose; – – –, acetic acid; • • • • •, lactic acid, — • • —, formic acid.
Abstract
A methodology to reduce the complexity of the process optimization was applied to multiproduct biorefinery fed by lignocellulosic biomass. A process superstructure was built to consider alternative process pathways to levulinic acid, succinic acid and ethanol. A Mixed Integer Non-Linear Problem was obtained and transformed in a Mixed Integer Linear Problem by means of a discretization procedure of the non-linear variables. Rigorous design methods accounting for complete kinetics schemes for hydrolysis and fermentation reactors for the production of levulinic acid, succinic acid and ethanol were included in a biorefinery superstructure optimization. A discretization method was applied to obtain a MILP approximation of the resulting MINLP master problem. The optimal flowsheet of a biorefinery with hardwood feedstock, obtained by maximizing the Net Present Value, yields comparable biomass allocation to levulinic acid and succinic acid (more than 40% each) and the its balance to ethanol. A sensitivity analysis highlighted that the optimal flowsheet and the relevant technical and economic performances are significantly dependent on the economic scenario (chemical products selling price, discount rate) and on the plant scale. Finally, process optimization achieved by maximizing two different economic objective functions, Net Present Value and Internal Rate of Return, provided different optimal flowsheets and biomass allocation to chemical products. The effect of the change of the biomass type and composition on the plant was also considered. Results highlight that the composition of the biomass feedstock in terms of cellulose, hemicellulose and lignin has a significant effect on the biomass allocation to the three product production processes and on the relevant optimal flowsheet. Case studies with a combined use of different seasonal biomass types during the year were also studied to provide a methodology to find the optimal biorefinery flowsheet in real scenarios. In the season based scenario studied, product yield distribution and overall productivity of the plant varies during the different periods provided a constant biomass feed rate.
1.Introduction
1.1 Biorefinery, Biofuels, Biochemicals
The strong dependence of modern society on fossil fuels comes from the intensive use and consumption of petroleum derivatives which, combined with diminishing petroleum resources, causes environmental and political concerns. There is clear scientific evidence that emissions of greenhouse gases (carbon dioxide, methane and nitrous oxide), arising from fossil fuel combustion and land-use change as a result of human activities, are perturbing the Earth’s climate (Solomon et al. 2007).
Concerning chemicals, their dependence on fossil resources is even stronger. The majority of chemical products are produced from oil refinery and almost 4% of oil is worldwide used for chemical and plastic production. In order to simultaneously reduce the dependence on oil and mitigate climate change in transport and chemical sectors, alternative production chains are necessary. It is increasingly recognized that there is not a single solution to these problems and that combined actions are needed, including changes in behavior, changes in vehicle technologies, expansion of public transport and introduction of innovative fuels and technologies. Recently, society began to recognize the opportunities offered by a future sustainable economy based on renewable sources and has been starting to finance R&D activities for its implementation. It is increasingly acknowledged globally that plant-based raw materials (i.e. biomass) have the potential to replace a large fraction of fossil resources as feedstocks for industrial productions, addressing both the energy and non-energy (i.e. chemicals and materials) sectors. At national, regional and global levels there are three main drivers for using biomass in
biorefinery for production of bioenergy, biofuels and biochemicals (Cherubini & Strómman 2010).
Electricity and heat can be provided by a variety of renewable alternatives (wind, sun, water, biomass and so on), while biomass is very likely to be the only viable alternative to fossil resources for production of transportation fuels and chemicals, since it is the only C-rich material source available on the Earth, besides fossils. As a consequence, the sustainable biomass production is a crucial issue, especially concerning a possible fertile land competition with food and feed industries.
A biorefinery is a facility or network of facilities that integrates biomass conversion processes and equipment to produce transportation biofuels, power, and chemicals from biomass. This concept is bears significant analogies with that of an oil refinery in which produces multiple fuels and other products are derived from oil. The progressive replacement of oil with biomass is a necessary breakthrough change to build a future biobased economy (Kamm et al. 2007) in which fossile carbon is replaced by renewable carbon in the role of both raw material and energy source. Second generation biorefineries using lignocellulosic biomass are among the most promising options, since they have many advantages from the energy and environmental standpoint (FitzPatrick et al. 2010),(Balat & Ayar 2005),(Menon & Rao 2012).
Lignocellulosics’ are the most abundant source of unutilized biomass and their availability does not necessarily impact land use. Biomass in general consists of 40-50% cellulose, 25-30% hemicellulose and 15-20% lignin and other extractable components (Knauf & Moniruzzaman 2004). The effective utilization of all the three components would play a significant role in economic viability of the cellulose to biofuels/biochemicals process. In nature except in cotton bolls, cellulose fibres are embedded in a matrix of other structural biopolymers, primarily hemicellulose and lignin. Cellulose is a linear syndiotactic polymer of glucose linked together by b-(l/4)-glycosidic bonds whereas hemicellulose is a branched heteropolymer of D-xylose, L-arabinose, D-mannose, D-glucose, D-galactose and D-glucuronic acid. Lignin is composed of three major phenolic components, namely p-coumaryl alcohol, coniferyl alcohol and sinapyl alcohol. Lignin is a complex hydrophobic, cross-linked aromatic polymer that interferes with the hydrolysis process (Menon & Rao 2012). A representative diagrammatic framework of lignocellulosic biomass is illustrated in Fig. 1-1.
Figure 2-1: Representative diagrammatic framework of lignocellulosic biomass.
The high molecular weight and ordered tertiary structure make natural cellulose insoluble in water. Cellulose with low degree of polymerization will be more susceptible to cellulolytic enzymes. The isolation and derivatization/dissolution of cellulose are crucial steps in determining cellulose (Hallac & Ragauskas 2011). In general plant cell walls are subdivided as primary and secondary walls. The distribution of cellulose, hemicellulose and lignin varies considerably among these layers. The major impediments towards development of an economically viable technology for biodegradation of cellulose are the association with lignin and hemicellulose, crystallinity, degree of polymerization and surface area. During the biocatalytic valorization of lignocellulosic substrate, a residual fraction survives the attack. This fraction absorbs a significant amount of the original enzyme and restricts the use of these enzymes on added, fresh substrate (Arantes & Saddler 2011). Most potential cellulosic substrates for bioconversion are heavily lignified. Thus, most of the cellulose in nature is unsuitable for bioconversion unless effective and economically viable procedures (pretreatments) are developed to remove or modify lignin. The development and implementation of biorefinery processes is of upmost importance to meet the vision towards a sustainable economy based on bio-resources.
Efficient conversion of lignocellulosic materials to ethanol and value added biochemicals are still today a challenging proposition. In 2004, the National Renewable Energy Laboratory listed the 12 chemical compounds more easily obtainable from lignocellulosic biomass by industrial processes (T. Werpy. & G. Petersen. 2004). They are value-added chemicals or precursors of other chemicals in common use. However, the commercialization of conversion technologies has been hindered by several factors including unavailability of reliable feedstock supply systems, and
non optimized conversion systems. For the latter issue, the optimization by process synthesis and integration can help to identify the most promising pathways and to increase the profitability of bio-based fuels and production of chemicals.
1.2 Process Synthesis methods
Rudd et al. (Rudd et al. 1973) proposed the term “synthesis”, over the past several decades, process synthesis has had a significant impact on the development, design and operation of (petro) chemical processes. Process synthesis can be considered as the cornerstone of the process design activity (Westerberg 2004), it provides a systematic way to identify the types of equipment, flowrates, operating/design conditions and optimal interconnections among different units that create the best total flowsheet. Traditionally, the synthesis problem can be described as follows: given a set of feedstocks and a set of desired final products with specifications, it is desirable to develop a systematic methodology with various objectives such as the highest yield, the highest energy efficiency or the most sustainable route for the generation of optimal configurations for transforming the raw materials to desired products.
Significant achievements have been made since the 1970s in the area of process synthesis for chemical processes, and, numerous synthesis frameworks, strategies and tools have been proposed (Westerberg 2004). Among the current process synthesis approaches that aims to be cost effective and energy efficient, three types of approaches can be found: heuristics based approaches that use specific process knowledge and experience, physical insights based approaches; superstructure optimization based approaches where mixed integer (non)linear programming are formulated and solved; and, hybrid approaches that combine aspects of the first two approaches in a hybrid scheme. The hierarchical decomposition based approach of Douglas (M. Douglas J. 1988) and pinch technology of Linnhoff (Linnhoff 1993) are examples of heuristics and physical insights based approaches.
At the base of the optimization process is the development of a superstructure of design alternatives, whether at a high level of abstraction or at a relatively detailed level of the units, the synthesis problem can be formulated in general terms as the mixed-integer optimization model:
}
1
,
0
{
,
0
)
,
(
0
)
(
)
,
(
min
y
X
x
y
x
g
x
h
y
x
C
Z
(1-1)
In which x is the vector of continuous variables representing flows, pressures, temperatures, while y is the vector of 0 -1 variables to denote the potential existence of units. The equations h(x) = 0 are generally nonlinear and correspond material and heat balances, while the inequalities g(x,y) ≤ 0, represent specifications or physical limits. As we have seen in the previous chapters it should be noted that for most of the applications in process synthesis, problem (MIP) has the special structure that the 0–1 variables appear linearly in the objective function and constraints. The reason for this is that in the objective 0–1 variables are commonly used to represent fixed charges, that is:
)
(
)
,
(
x
y
c
y
f
x
C
T
(1-2)While in the constraints they are used to represent logical conditions which normally can be expressed in linear form, that is:
0
)
,
(
x
y
Cx
By
d
g
(1-3)It is often not advisable to solve directly the nonlinear problem (MIP) for the case of a process flowsheet, but instead use a decomposition strategy. The other option is to avoid solving the MINLP by approximating this problem as an MILP through discretization.
In the case that nonlinearities are explicitly accounted for in problem (MIP), aside from the potentially large size of the MINLP model for the superstructure optimization of a process flowsheet, there are two other potential difficulties. The first is that when fixing the 0–1 variables for defining the corresponding NLP subproblem in a direct solution of the MINLP, one has to carry many redundant variables and equations that unnecessarily increase the dimensionality and complexity of this subproblem. The reason is that when some of the process units are not selected, the corresponding flow are fixed to zero, but yet the mass and heat balances of the “dry units” have to be converged. This usually introduces singularities that cause great difficulty in the convergence of the NLP. The second difficulty that arises from a direct solution of the MINLP is because
the effects of nonconvexities are accentuated when flows take a value of zero (again effect of “dry units”). This may cause the NLP subproblem to converge to suboptimal solution or the master problem to “cut off” the optimal 0–1 combination. It is precisely these two difficulties that motivate the modelling/decomposition strategy described by Kocis and Grossmann (Kocis & Grossmann 1989).
Another optimization method is MILP approximation. In order to derive an MILP approximation to problem (MIP), we will partition the continuous variables x as follows:
c dx
z
x
(1-4)In which zd is the vector of operating conditions that gives rise to the nonlinearities (e.g., pressures, temperatures, split fraction, conversions, etc.), and xc is a vector of material, heat, and power flow variables that appear linearly. In this way, given a fixed value of zd, the nonlinear equations reduce to a subset of linear equations, that is:
e
Ex
x
h
(
)
0
c
(1-5)In which the matrix of coefficients E and the right hand sides e are a function of zd:E(zd), e(zd).
Since in general we would like to consider more than one fixed value for the variables zd, we will require the introduction of the additional 0–1 variables yd to represent the potential selection of the discrete operating conditions. In this way, the general form of the MILP approximation will be as follows:
0
,
1
,
0
,
0
min
3 2 1 2 1 2 1 c d c d c d T d T Tx
y
y
x
D
y
D
y
D
e
x
E
y
E
b
y
a
y
a
C
(1-6)While we have been able to eliminate the nonlinearities, it is clear that we have increased the number of discrete and continuous variables as well as the number of constraints. Also, in the general case the definition of the
matrix requires an prior evaluation or simulation of nonlinear models (Biegler L.T., Grossmann I.E. 1997).
MINLP solution algorithms based on generalized Bender decomposition (Floudas 1995), outer approximation (Duran & Grossmann 1986), extended cutting-plane methods (Westerlund et al. 1998) and branch-and-bound(Gupta, Omprakash K., Ravindran 1985) have been developed and improved over the last decades, and implemented in generic multi-purpose solvers (e.g. MINOS, DICOPT, BARON) integrated with commercial optimization software packages such as GAMS and AMPL (Trespalacios & Grossmann 2014). Several authors applied different methods for MINLP process optimization of biorefineries like disjunctive programming (Ponce-Ortega et al. 2012), DICOPT program (Zondervan et al. 2011), LINGO program (Gabriel & El-Halwagi 2013a).
In some cases optimization methods include iterative methods, interfacing the optimization software with technical computing software (e.g. MATLAB) (Geraili et al. 2014) and process simulation software (e.g. Aspen Plus) (Gabriel & El-Halwagi 2013a). In all these cases the authors identified the best process pathways among the available alternatives or the best end products to maximize a techno-economic objective function.
However, the large number of integer variables necessary for large superstructures and the need to have a reasonable computational time can make the MINLP extremely challenging, even for state-of-the-art optimization software (Bischi et al. 2014). Furthermore, the risk with most of the MINLP solvers is to find a local optimum instead of the global optimum, if the problem is non-convex. As a result, several approaches have been proposed to convert a MINLP into an approximated Mixed Integer Linear Problem (MILP). Such problem linearization is considerably advantageous because MILP convergence solution is guaranteed by extremely fast and effective commercially available MILP solvers (e.g., CPLEX, Gurobi, Xpress).
1.3 Process design and optimization of multi-product biorefineries
In general, the process systems design of biorefineries can be stated as follows: provided the aim of minimum costs and sustainable development (Poliakoff & Licence 2007), a systematic methodology is applied for the choice of optimal reaction routes and corresponding optimal flowsheet consisting of all the unit operations and the relevant design and operating conditions that are able to achieve a set of desired value-added products and
fuels with specified flowrate, temperature and purity from a set of biomass derived feedstock with specified composition.
Several studies reported in the literature aimed at improving the process pathways to obtain more than a single product. Tippkötter et al. (Tippkötter et al. 2014) studied enzymatic hydrolysis of beech wood lignocellulose at high solid contents and its utilization as substrate for the production of biobutanol and dicarboxylic acids. Bioethanol and beta-lactam production was considered in the process design of Kim et al. (2014) (Kim et al. 2014). In this case SuperPro Designer was used to obtain the evaluation of the several process pathways.
The majority of existing biorefinery processes deal with the production of biofuels and bioethanol based on thermochemical and biochemical technologies. However, only few studies reported in the literature addressed the optimization of the biomass distribution among alternative pathways of a biorefinery co-producing alcohols (ethanol or butanol), high-value chemicals (succinic acid) and electricity (Zondervan et al. 2011), chemicals, like acetic acid (Luo et al. 2010) i-butene (Martín & Grossmann 2014) and3-butadiene (Cheali et al. 2015). Significant improvements in the techno-economic feasibility can be also obtained by thermal conversion of the biomass components that cannot be easily converted by chemical or enzymatic processes (Cheali et al. 2014). Luo et al. (Luo et al. 2010) identified the best design of a multi-product lignocellulosic biorefinery producing ethanol, succinic acid, acetic acid and electricity.
Zhou et al. (Zhou et al. 2012) proposed a MILP model in which performance curves of process unit as a function of a single degree of freedom (an internal combustion engine, a boiler and an absorption chiller) were approximated with piecewise linear functions. The model is used to optimize the design of the cogeneration system while taking into account its lifetime operation and the investment cost. The total annual cost is then compared with that corresponding to a solution found by a simpler MILP model using linear performance curves. Problem linearization can be obtained also by variable discretization methods (Kalitventzeff 1991). In particular, for each non linear process variable, a vector of possible values of the variable was considered. The original variable was set equal to the sum of the product of each of these values and a binary variable. In the problem solution only one of these binary variables was allowed to be equal to 1. Mathematical programming was used by Scott et al. (Scott et al. 2013) in order to select alternative processes for bioethanol production from hardwood. Problem formulation led to a MINLP which was tackled by specific software. Moreover, a MILP formulation was also computed by
using a relaxation technique. Equations needed to relax the bi-linear product involve the introduction of new continuous variables.
Given a superstructure model developed to optimise the production process for levulinic acid, succinic acid and ethanol from biomass material, in this paper rigorous design methods accounting for complete kinetic schemes for the more accurate sizing of hydrolysis and fermentation reactors is considered. A discretization method is applied to use the results of the reactor design in the overall flowsheet optimization of the multiproduct biorefinery and to obtain a MILP approximation of a Mixed Integer Non Linear Programming master problem. These modifications on the superstructure optimization procedure allow a more reliable trade-off estimation between direct and investment cost. The resulting procedure can, therefore, be used to analyse the effects on the profitability of changes in the economic scenario due to long term uncertainty. For example, changes in the discount rate do play a significant role on the determination of Net Present Value by changing the significance of the investment cost. But also revenues and direct costs as subject to indeterminacy. In fact, the market of the top added value biochemicals is expected to rise. In particular, in the considered case of a biorefinery, the market price of succinic acid (Luo et al. 2010) and levulinic acid (Rackemann & Doherty 2011) price can have a significant influence on the economic feasibility of some of the innovative process routes considered and on their market growth potential. In order to address these issues, in this work a sensitivity analysis of some of the parameters of the economic scenario for the biochemical production is carried out.
1.4 Biomass seasonality
Furthermore, a significant replacement of fossil fuel refineries production with products from renewable feedstock biorefineries would require large amounts of lignocellulosic biomass. Therefore, the limited biomass availability and the challenging efficiency of the supply chain can be considered as one of the major barrier hindering the global development of biorefinery based processes (Balat 2011). In fact, the seasonal nature and the annual variability of the biomass supply may disfavour the use of several types of feedstocks due to logistic problems and economic unsustainability. More precisely, the discrete biomass supply due to its seasonality causes a challenging and costly management of the biomass storage in order to ensure a continuous supply for biorefineries(Yue et al. 2014). Moreover, the volatility of biomass cost and the dependence upon specific suppliers are factors threatening the economic stability of a biorefinery (Gnansounou & Dauriat 2010). The use of different biomass types over the year may overcome some of these constraints. On the other hand, different processing
requirements of diverse biomass feedstocks may limit the biorefinery operational feasibility (Huang et al. 2009),(González-García et al. 2010). An enhanced flexibility of a biorefinery in terms of its ability to use multiple feedstocks can only be obtained by pursuing this objective since the initial stages of process design. Systematic process synthesis, linking process design methods and rigorous mixed integer programming, provides with powerful tools to attack this process optimization problem (Quaglia et al. 2012).
Recent studies revealed that in some regions (e.g. the United States) ethanol market is already saturated (Peplow 2014). Instead, promising opportunities are arising from the production of diverse bio-based chemicals and polymers (de Jong et al. 2012). In particular, a list of potential high added value chemicals that can be obtained from carbohydrates coming with biomass feedstock was reported to guide further scientific and technological efforts (T. Werpy. & G. Petersen. 2004),(FitzPatrick et al. 2010),(Bozell & Petersen 2010),(Menon & Rao 2012),(Sammons et al. 2008). As a result, a realistic scenario for sustainable biorefinery processes supplied with different seasonal lignocellulosic biomass types should include the production of added value biochemicals beside ethanol (Kokossis et al. 2015). In fact, papers in the literature addressed the optimization of the biomass feed partitioning among alternative pathways of a biorefinery co-producing alcohols, like ethanol or butanol (Zondervan et al. 2011), high-value chemicals, such as succinic acid (Giuliano et al. 2014), chemicals, like acetic acid (Luo et al. 2010), i-butene (Martín & Grossmann 2014) and 3-butadiene (Cheali et al. 2015). However, studies on process optimization of multiproduct biorefineries with seasonal multiple feedstocks are not available.
2.Aim of the work
The present work addresses the process flowsheet optimization of a multiproduct lignocellulosic biomass refinery by aiming at economic objective functions by means of mathematical programming methods. In particular, the co-production from a hardwood biomass feedstock of two of the top value added chemicals, levulinic acid and succinic acid (T. Werpy. & G. Petersen. 2004), as well as of ethanol is studied.
Given a superstructure model developed to optimise the production process for levulinic acid, succinic acid and ethanol from biomass material, in this paper rigorous design methods accounting for complete kinetic schemes for the more accurate sizing of hydrolysis and fermentation reactors is considered. A discretization method is applied to use the results of the reactor design in the overall flowsheet optimization of the multiproduct biorefinery and to obtain a MILP approximation of a Mixed Integer Non Linear Programming master problem. These modifications on the superstructure optimization procedure allow a more reliable trade-off estimation between direct and investment cost. The resulting procedure can, therefore, be used to analyse the effects on the profitability of changes in the economic scenario due to long term uncertainty. For example, changes in the discount rate do play a significant role on the determination of Net Present Value by changing the significance of the investment cost. But also revenues and direct costs are subject to indeterminacy. In fact, the market of the top added value biochemicals is expected to rise. In particular, in the considered case of a biorefinery, the market price of succinic acid (Luo et al. 2010) and levulinic acid (Rackemann & Doherty 2011) price can have a significant influence on the economic feasibility of some of the innovative process routes considered and on their market growth potential .In order to address
these issues, in this work a sensitivity analysis of some of the parameters of the economic scenario for the biochemical production is carried out.
In the first part, the complex superstructure, as composed by alternative process routes to the three chemicals, is described in detail. Moreover, the corresponding mathematical model including shortcut methods for the process unit design is reported. The results for a base case economic scenario obtained by the solution of a Mixed Integer Linear Programming problem are discussed. In the second part of the paper, the model is enriched by rigorous design methods accounting for complete kinetic schemes for the more accurate sizing of hydrolysis and fermentation reactors. A discretization method is applied to use the results of the reactor design in the overall flowsheet optimization and to obtain a MILP approximation of a Mixed Integer Non Linear Programming master problem. Finally, a sensitivity analysis on the economic objective function and on the economic scenario is also addressed.
Two alternative economic objective functions (net present value and internal rate of return) were considered. The optimization analysis aimed at finding the optimal flowsheet, biomass allocation and product yield in several case studies involving a single feedstock and multiple feedstock biorefinery process.
However, studies on process optimization of multiproduct biorefineries with seasonal multiple feedstocks are not available.
The last part of the work aims at filling this gap. In particular, eucalyptus residues (EU), wheat straw (WS) and olive tree pruning (OP) were chosen as representative feedstock from Southern Europe (Silva-Fernandes, Duarte, Carvalheiro, Loureiro-Dias, et al. 2015). The seasonality of these biomass materials is partially complementary. In fact, EU is available throughout the year, WS is harvested in late spring/early summer, and OP is mainly available in winter and early spring. The storage costs of all these biomass materials are not expected to be significant since they have low moisture content. These features make these biomass materials good candidates for a multi-feedstock biorefinery under continuous operation throughout the year.
3.Superstructure
3.1 Superstructure
The most promising alternative processes at the industrial scale were selected and included in a complex process flowsheet to build the so-called superstructure of a biorefinery for the co-production of succinic acid, levulinic acid and ethanol. This work was based on a thorough survey of the literature concerning the available process pathways to obtain succinic acid, levulinic acid and ethanol. The biorefinery superstructure, built for this study consists of four sections (Figure 3-1):
Pretreatment;
Hydrolysis and fermentation; Separation and purification; Thermo-chemical conversion.
Each section is formed by alternative process pathways, each including several process stages operated in specific units. The main stages of the process are described in the following. Additional data concerning the process technology and main operating conditions assumed for the modelling of each stage are summarized in Tables 3-1, 3-4.
Figure 3-1: Superstructure of the multi-product lignocellulosic biorefinery (the dashed lines are exclusive).
3.2 Pretreatment
Biomass pretreatment generally consists of physical, chemical or thermochemical breakdown operation of the biomass to obtain the three main organic components of the lignocellulosic biomass: cellulose, hemicellulose and lignin. These components can be separated on the basis of their different solubility. Hemicellulose has the highest solubility, so it is the easiest to be separated (Huang et al. 2010). Using further treatments also cellulose and lignin can be separated (Zimbardi et al. 2002). Another option includes the possibility to send also the lignin to the reaction/fermentation section and then to obtain a lignin cake from the product purification section (Humbird & Aden 2009).
The first physical treatment considered in the superstructure was the preliminary size reduction process (mill P1). This is a common step independent of the subsequent pretreatment operation and its performances were fixed. Energy requirements were calculated as a function of the biomass flowrate and of the initial and final mean particle size according to Mani et al.(Mani et al. 2004).
The alternative pretreatment routes considered in this study were: • Steam explosion (SE);
• Ammonia fiber explosion (AFEX); • Dilute acid (DA);
• Lime;
• Organosolvent (OS);
Each route requires different operating conditions and heat duty for an effective pretreatment (Eggeman & Elander 2005).
Figure 3-2: Flowsheet for the pretreatment section.
The steam explosion route (P2) was modelled assuming a steam explosion unit using medium pressure steam at 220°C with a residence time of 3 min (Zimbardi et al. 2002). After the steam explosion unit the superstructure includes a sequence of possible units to separate in a first step hemicellulose from lignin and cellulose and in a second step lignin from
cellulose. As a result, the block corresponding to the steam explosion route can provide three alternative sets of outlet streams: 1) solubilised hemicellulose, solid cellulose and lignin stream; 2) solubilised hemicellulose stream and solid cellulose and lignin stream; 3) solubilised hemicellulose stream, solid cellulose stream, solid lignin stream.
The liquid hot water route (P3) was modelled assuming the use of a soaking unit using water at 190°C with a residence time of 15 min. After the soaking unit a possible solid liquid separation unit was considered (Mosier 2005). As a result, the block corresponding to the liquid hot water route can provide two alternative sets of outlet streams: 1) solubilised hemicellulose, solid cellulose and lignin stream; 2) solubilised hemicellulose stream and solid cellulose and lignin stream.
The AFEX route (P4)consists in a unit performing biomass soaking with ammonia at 90°C. Ammonia is then separated from the solubilised hemicellulose, solid cellulose and lignin stream by a flash unit and recycled to the AFEX unit after recompression (Gabriel & El-Halwagi 2013b).
The dilute acid route (P5) includes soaking unit operating at 160 °C with anH2SO4 solution. A subsequent acid neutralization stage with Ca(OH)2 is
necessary. After the dilute acid treatment a possible solid liquid separation unit is considered (Humbird & Aden 2009). As a result, the block corresponding to the dilute acid route can provide two alternative sets of outlet streams: 1) solubilised hemicellulose, solid cellulose and lignin stream; 2) solubilised hemicellulose stream and solid cellulose and lignin stream.
The lime route (P6) includes a soaking unit operating at 120 °C using Ca(OH)2at rates equal to 9% w/w of dry biomass. Recovery and recycle of
Ca(OH)2by addition of CO2 and conversion to lime is considered (Chang et
al. 1998).After the lime treatment a possible solid-liquid separation unit is also considered. As a result, the block corresponding to the lime route can provide two alternative sets of outlet streams: 1) solubilised hemicellulose, solid cellulose and lignin stream; 2) solubilised hemicellulose stream and solid cellulose and lignin stream.
The organosolvent route (P7) soaking unit operating at 180 °C and using an ethanol water solution 60 %w/win ethanol. The residence time is 60 min. In the route, a distillation column is necessary to recover ethanol. A solvent make up is provided by an aqueous ethanol stream produced in the separation and purification section of the biorefinery (Pan et al. 2007).
Table 3-1: Pretreatment parameters for the optimization model. Pretreatment Temperature (°C) Residence time (min) Concentration Reference Steam explosion 220 °C 3 / Zimbardi et al., 2002 Liquid hot water 190 °C 15 / Mosier et al., 2005 AFEX 90 °C 5 50% Teymouri et al., 2004
Dilute acid 160 °C 10 1%wt H2SO4 Humbird
et al., 2011 Lime 120 °C 120 9% Ca(OH)2 w/w dry biomass Chang et al., 1998 Organo solvent 180 °C 60 60% ethanol w/w dry biomass Pan et al., 2006
The main operating conditions and yields to products assumed for all the pretreatment process routes are summarized in Table 3-1.
3.3 Hydrolysis and fermentation
3.3.1 Acid hydrolysis and levulinic acid production
Dilute acid hydrolysis (R1-R2) is used to obtain glucose and xylose from cellulose and hemicellulose, respectively, and to convert glucose to levulinic acid. The reaction network includes the formation of hydroxymethylfurfural (HMF) as an intermediate in the path from cellulose to levulinic acid and the conversion of xylose to furfural. Secondary parallel reactions can take place for cellulose, glucose and xylose to undesired decomposed compounds. The main reaction network is reported in the following:
Two different acid catalysts, H2SO4 and HCl, were considered
(Rackemann & Doherty 2011). Acid hydrolysis is performed in a plug flow reactor at 150°C (Lee et al. 2000). Reaction network kinetics relevant to H2SO4 (Girisuta et al. 2008) (Lee et al. 2000) and HCl (Shen & Wyman
2012) were taken into account.
The outlet stream from the hydrolysis reactor is rich in intermediates (glucose and xylose)or in the final products(levulinic acid, formic acid and furfural)depending upon the residence time considered, with longer residence times in favour of final products. Therefore, if the conversion in the dilute acid reactor is insufficient, a second acid reactor (named levulinic acid reactor, R3) is used in series to produce more levulinic acid. Alternatively dilute levulinic acid stream from the hydrolysis reactor can also be subject to detoxification, carried out in an acid detoxification reactor, before being fed to fermentations in the ethanol or succinic acid routes.
Figure 3-3: Flowsheet for the hydrolysis and fermentation section.
The levulinic acid reactor outlet stream is sent to an ultrafiltration filter to remove solid particles, oligomers and polymers (cellulose and hemicellulose) (Ramaswamy et al. 2013). Next, the filtered reaction liquor containing by products of the sugars hydrolysis and acid catalyst is conditioned by means of a detoxification stage (acid purification) if the sugars are sent to fermentation (Humbird & Aden 2009).Resulting wastewater is sent to dedicated treatment.
Table 3-2: Equipment description of hydrolysis and fermentation section.
Equipment Action
R1 Acid hydrolysis reactor for cellulose and hemicellulose with HCl as catalyst
R2 Acid hydrolysis reactor for cellulose and hemicellulose with H2SO4 as catalyst
R3 Levulinic acid reactor with HCl as catalyst R4 Levulinic acid reactor with H2SO4 as catalyst
R5 Enzymatic hydrolysis reactor for cellulose and hemicellulose
R6 Acid hydrolysis reactor for hemicellulose with H2SO4
as catalyst
R7 Enzymatic hydrolysis reactor for hemicellulose R8 Ethanol fermenter
R9 Succinic acid fermenter R10 Solid separation
R11 Detoxification reactor for the glucose rich stream R61 Solid separation
R62 Detoxification reactor for the xylose rich stream E1 Flash to recover CO2 from ethanol fermenter
3.3.2 Enzymatic hydrolysis
Enzymatic hydrolysis (R5)is used to produce glucose and xylose from cellulose and hemicellulose using a continuous stirred-tank reactor by means of specific enzymes (Dimian & Bildea 2008). The superstructure includes two possible reactors. The first reactor can process either a mixed stream of
cellulose and hemicellulose or a stream of cellulose only. Enzymatic kinetics for this case was derived from Kadam et al.(Kadam et al. 2004).The second reactor (R7)can processes a stream of hemicellulose only. The enzymatic kinetics for this case was taken from Flores-Sanchez et al. (Flores-Sánchez et al. 2013).
Two alternatives were considered to feed the enzymes to the enzymatic hydrolysis section. In one case the enzymes was bought from an external producer. In the second case, anon site process section dedicated to produce cellulase enzymes (Humbird & Aden 2009) was considered. In this case part of the sugar-rich stream from the enzymatic reactor is recycled back to the enzyme production section. The two process alternatives are depicted in the flowsheet reported in Figure 3-4.
Figure 3-4: Superstructure of enzyme production section (the dashed lines are exclusive).
3.3.3 Hemicellulose dilute acid hydrolysis
Xylose can be also produced from hemicellulose by dilute acid hydrolysis (R6) in a plug flow reactor with H2SO4 as catalyst (Lee et al. 2000). The
main reaction network is reported in the following:
After the hydrolysis, acid agents in the stream are neutralized in a detoxification stage to obtain higher pH as required for fermentations. The xylose-rich stream can be sent to either ethanol fermentation, or to succinic acid fermentation or partitioned between the two.
3.3.4 Ethanol and succinic acid fermentations
The streams of dissolved sugars produced by cellulose and hemicellulose by any of the hydrolysis routes are sent to fermentation stages.
Ethanol production (R8)takes place into batch fermenters in which sugars are converted into ethanol and CO2 by specific microorganisms. Zymomonas
mobilis strain ZM4(pZB5) turns out to be the best microorganism for the
co-fermentation of C6 sugars and C5 sugars (Leksawasdi et al. 2001). Ethanol production reactions were:
Glucose →2 Ethanol+2 CO2
3 Xylose →5 Ethanol+5 CO2
The ethanol fermenter is composed by a batch reactors train in order to have a continuous production despite the required long residence time (Humbird & Aden 2009).
Succinic acid production is performed in a fermentation reactor (R9) fed with sugars solution and CO2provided from the ethanol fermenter. The
reaction network considered (Luo et al. 2010) is the following: Glucose+2 CO2 →2 Succinic Acid+ O2
3 Xylose+5 CO2 →5 Succinic Acid+2.5 O2
Glucose → 3 Acetic Acid Glucose → 2 Lactic Acid 2 Xylose → 5 Acetic acid 3 Xylose → 5 Lactic acid
These reactions require the microorganism Mannheimia succiniciproducens (MBEL55E). The chosen reaction kinetics are those
reported by Song et al. (Song et al. 2008a).
Also the succinic acid fermenters for the same reason of ethanol fermenter is composed by a train of batch reactors.
3.4Separation and purification
3.4.1 Levulinic acid purification
The purification section aims at obtaining 99 %wt levulinic acid. If HCl is the catalyst used for the acid hydrolysis the section consists in a separation stage (S1) of the HCl catalyst for its recovery and a subsequent separation stage (S2) of water by distillation (Shen & Wyman 2012). In particular the volatile HCl is recovered in the vapour stream of a flash stage (LA1) (Rackemann & Doherty 2011) that is recycled back. The resulting liquid stream made of levulinic acid, furfural, formic acid, water and other decomposed compounds is separated by a distillation column (C15) where the levulinic acid is recovered as a bottom product because it is the heavier compound with a boiling temperature of 246°C at atmospheric pressure. If H2SO4 is the catalyst used in the acid hydrolysis, two alternative purification
processes are possible:
chromatographic separation (S3) of H2SO4 and subsequent separation (S4) of water by distillation (Farone et al. 2000); reactive solvent extraction (S5) of organic compounds with
subsequent distillation (S6) on the resulting streams to recover solvent and H2SO4 (O’Brien et al. 2000).
Table 3-3: Equipment description of separation and purification section.
Equipment Action
C11, C12, C13 Distillation column train to recover pentanol C14 Distillation column to purify levulinic acid C15 Distillation column to purify levulinic acid
C21 Beer column
C22 Rectifying column
C23 Distillation column with ethylene glycolis as a solvent
C31 Methanol distillation column C32 Vacuum distillation column
CC11 Chromatographic column to purify levulinic acid CR11 Reactive solvent extraction column to purify
levulinic acid
CR31 Reactive solvent extraction column to purify succinic acid
CY31, CY32, CY33
Succinic acid crystallizers
E1 Flash to recover CO2 from ethanol fermenter
E2 Solids separation
E3 Pervaporation membrane for the beer stream
E4 Molecular sieves
E5 Pervaporation membrane for the azeotropic stream
LA1 Flash to recover HCl LA2 Flash to recover H2SO4
LA3 Reactor to convert levulinic acid to Pentyl levulinate
SA1 Reactor
SA2 Flash to separe steam
SA3 Membrane to recover the succinic acid crystals SA4 Succinic acid purification by methanol
SA6 Flash to purify succinic acid
SA7 Thermal cracking
The first process route is consists in a chromatographic column (CC11) with an adsorbent anionic resin used to separate H2SO4 from the aqueous
solution and all the other organic compounds (Farone et al. 2000). Since this kind of chromatographic column needs a regeneration cycle, four columns in parallel were considered. The resulting aqueous solution of levulinic acid and a very small quantity of H2SO4, formic acid and furfural is sent to a
distillation column (C14). The bottom product is 99%wt levulinic acid.
Figure 3-5: Flowsheet for the separation and purification section of levulinic acid.
The second process pathway consists in a reactive solvent extraction column (CR11) with pentanol solvent. Pentyl levulinate is obtained from the levulinic acid reactive extraction while the aqueous solution of H2SO4 is
recovered in the raffinate stream. A distillation column will recover the acid catalyst from this latter stream. The extract stream containing mainly organic species (pentyl levulinate, furfural, pentanol and decomposed compounds) is sent to a flash unit (LA2) removing water and then to a train of distillation columns (C11, C12, C13). Pentyl levulinate is obtained from the bottom of
the first column (C11) and it is sent to a reactor (LA3) for the conversion to levulinic acid (Kamm et al. 2007). The top stream of the first column is sent to two additional distillation columns (C12, C13) to recover pentanol (Ayoub 2008).
3.4.2 Ethanol purification
The first separation unit is a flash to recover the CO2 produced in the
ethanol fermentation to be sent to the succinic acid fermenter. A ultrafiltration unit is used to remove both solid particles and no hydrolysed oligomers and polymers from cellulose and hemicellulose(Ramaswamy et al. 2013).
Ethanol purification up to 99 %wt can be carried out by either conventional unit operations, such as distillation and extractive distillation, or innovative technologies, such as pervaporation membranes and molecular sieves.
Table 3-4: Product yields for the purification sections.
Equipment Main product
yield (%wt)
References Chromatographic column to purify
levulinic acid
95 (Farone et al.
2000) Distillation column to purify levulinic
acid
95 (Farone et al.
2000),(Shen & Wyman 2012) Reactive solvent extraction column and
distillation column to purify levulinic acid
84 (Ayoub 2008)
Distillation columns to ethanol 99 (Dimian & Bildea 2008) Pervaporation membranes to ethanol 95 (O’Brien et al.
2000),(Alvarez et al. 2008) Distillation column with entrainer 95 (Errico et al.
2013)
Molecular sieves to ethanol 90 (Kwiatkowski
et al. 2006) Reactive crystallization of succinic acid 99 (Yedur et al.
2001) Extraction and distillation column to
purify succinic acid
90 (Song et al.
The first purification step up to 77 %wt of ethanol can be performed by either a beer column (S7) (Dimian & Bildea 2008) or a pervaporation membrane (S8) (O’Brien et al. 2000). A rectifying column (S9) achieves ethanol azeotropic composition(92.5 %wt) (Dimian & Bildea 2008).
Final purification step can be carried out by three alternative processes: extractive distillation (S10),
molecular sieve unit (S11), pervaporation membranes (S12).
In particular, extractive distillation requires two columns and uses ethylene glycol as entrainer. The first column provides pure ethanol as distillate and a mixture as bottom product, that is sent to the second column, where the ethylene glycolis recovered as bottom product and water as distillate (Errico et al. 2013).
Figure 3-6: Flowsheet for the separation and purification section of ethanol.
Molecular sieves consist in zeolites adsorption units able to purify ethanol up to 99%wt (Kwiatkowski et al. 2006). Since molecular sieves need regeneration, two units in parallel were considered to alternate adsorption and regeneration.
Pervaporation membranes are used to dehydrate the azeotropic water-ethanol mixture by water permeation (Alvarez et al. 2008). The main process parameter is the downstream pressure (of the permeate phase). A downstream pressure of 0.133 kPa was considered.
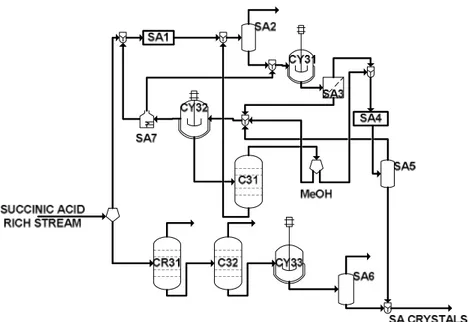
3.4.3Succinic acid purification
The purification of succinic acid can be carried out alternately by: reactive crystallization (S13) and purification (S14) with
methanol (Yedur et al. 2001);
solvent extraction (S15) combined with distillation (S16) and a crystallization(Song et al. 2007).
The first purification process requires a reactor (SA1) to convert succinic acid to diammonium succinate by means of the following reaction:
Succinic Acid +2 NH3 →Diammonium Succinate
A crystallizing unit (CY31) is used to obtain succinic acid as a solid precipitate product by the reaction:
Diammonium Succinate +2 NH4 HSO4 →Succinic Acid + 2 (NH4)2SO4
Methanol solvent is used in order to purify the liquor with succinic acid crystals. In fact, all residual organic compounds are dissolved in the methanol-phase and pure succinic acid is obtained. Residual succinic acid in the organic phase is also recovered by further crystallization (CY32). Methanol is recovered by distillation (C31). A thermal cracking (SA7) allows the recovery and recycle of ammonia and ammonium sulfate (Yedur et al. 2001).
Figure 3-7: Flowsheet for the separation and purification section of succinic acid.
The alternative purification process of succinic acid consists of three units (Song et al. 2007):
- a reactive extraction column (CR31) with octanol solvent to remove by-product acids from the fermentation broth;
- a vacuum distillation column (C32) to eliminate residual volatile carboxylic acids such as acetic, formic and lactic acids. This operation is used to facilitate the subsequent crystallization;
- a crystallizer (CY33) to obtain 99%wt pure succinic acid crystals(Huh et al. 2006).
3.5 Thermochemical conversion
In the lignin section, the thermochemical conversion of the lignin-rich stream allows to produce high pressure steam and electricity. The lignin stream, coming either from the pretreatment section or from the separation section, is sent to two alternative process pathways:
lignin combustion (T2) coupled with a Rankine cycle.
In the first case, an Integrated Gasification Combined Cycle is considered. In particular, the raw syngas from the gasification reactor is sent to a gas cleaning section and then to a gas turbine (Hamelinck et al. 2005). Both high pressure steam produced by heat recovery from the gasifier and flue gas at the exit of the gas turbine are sent to the heat recovery steam generator (HRSG). Resulting steam is sent to three steam turbines to produce electricity and intermediate and low pressure steam (Aden et al. 2002).
Figure 3-8: Flowsheet for the thermochemical conversion of lignin.
In the case of lignin combustion high pressure steam is produced in the boiler and is sent to steam turbine train at three pressure levels (Humbird & Aden 2009).