ACOUSTICAL ENERGY PARAMETERS AND SUBJECTIVE
PER-CEPTION
Elena Corti, Elisabetta Gozio, Edoardo A. Piana and Marika Vezzoli
University of Brescia, Italy email: [email protected]
Lamberto Tronchin
University of Bologna, Italy
The acoustic design auditoria is founded on objective acoustic parameters determined on the basis of the computed or measured impulse response. Such objective parameters are related on the average response of the human ear to transient sounds, without considering the subjective perception of the individual, which, in turn, is related also to social and education aspects. The aim of this study is to investigate the relationship between individual sound perceptions and energy parameters. In detail, a questionnaire has been submitted to a sample of people listening to tracks of different musical gen-res. The questionnaire has been conceived to come up with a classification model for the audience allowing to express the listener’s experience according to different indicators, such as overall acoustic quality and overall acoustic experience. Results of this experiment are analyzed by means of Random Forest non-parametric model belonging to the data mining algorithms. The final purpose of the study is to define which physical and acoustical characteristics are the most suitable to represent the sub-jective perceptions of the listeners.
Keywords: acoustic quality, subjective perception, survey, auditoria
1.
Introduction
In building sector, identifying objective performance assessment parameters and evaluating their ef-fectiveness is a need that spans across different uses [1]. During the acoustic design of auditoria, concert halls and theaters, one of the most important aspects is related with the typology of the audience of the room and the characteristics of the listeners, including their needs and expectations. For instance, in case the room is specifically designed for classical, pop or rock music, the acoustics would be more live and reverberant, whereas for rap or jazz music the expectations of the audience require a less reverberant room. Objective parameters can be used to measure the acoustic quality of existing theaters or simulate the behavior of new, or ideal [2], ones. Human perception however is subjective, it depends on the type of sound/noise, on the specific context and on the single individual, and it should somewhat drive the choice of the most appropriate objective indicators (see for instance the attitudinal response to the noise generated by high-voltage transmission lines [3, 4]).
In order to determine the link between subjective expectations and physical acoustic parameters, it has become of great importance to understand which specific relations occur between them. However, the subjective perception of sound distribution in rooms is still an argument with unsolved questions and of strong interest for those who are involved both in augmented 3D virtual acoustic reality [5] and in acoustic design of performance rooms. This matter could not be considered completely analyzed and fully evaluated, even if many experiments were conducted in the last ten years in this specific field [6]. As an example, several campaigns of psychoacoustic tests have been carried out in the “Arlecchino” listening room at University of Bologna since 2001, by means of Ambisonic and Stereo Dipole playback system [7]. These campaigns allowed to virtually reconstruct the 3D sound characteristics of several rooms, and by means of a properly developed questionnaire, a high number of data-sheets were collected. Another possibility is to gather questionnaires directly in the room just after a performance or a playback, in order to check the answers immediately within the space, and not in the equipped listening room, and to better understand the impressions of the listeners who attended the performance. This second method has been employed in this paper, whose aim is to twofold: to verify the quality of a theater by measuring some of the most commonly used objective parameters, and to compare the results of the objective analysis with the subjective impressions of spectators by means of an on-site survey. Different correlation models are considered to identify the elements that most contribute to a pleasant listening experience.
2.
The impulse response of a room
The objective parameters used to characterize the acoustic quality of an ambient are based on the impulse response between a source position and a receiving position. It is well known that, if the room is a linear time-invariant system, its characteristic transfer function can be obtained as the ratio between the Fourier transform of the output signal, B(f ), and the Fourier transform of the input signal, A(f ). Switching to time domain, the acoustic system can be compared to a black box with signal a(t) as input and signal b(t) as output. The system impulse response h(t) is the inverse Fourier transform F−1 of the frequency response function H(f ).
Once the input signal is known both in the time and the frequency domains, the response of the system can be computed through the following equations:
B(f ) = A(f )H(f ) b(t) = a(t) ⊗ b(t) (1)
where the symbol ⊗ denotes the convolution operation. Therefore, in linear time-invariant systems such as a theater, the impulse response function completely characterizes the system and provides a suitable base to define the relevant objective descriptors.
The first parameter, used to estimate how clear the sound quality is, is the clarity index, which re-presents the logarithmic ratio between the early energy, arriving in the first n milliseconds and the late energy arriving after n milliseconds:
Cn= 10 log10 Rn ms 0 ms h2(t) dt R∞ n msh2(t) dt (2) To estimate the speech intelligibility, C50is used while to describe music clarity, C80is mostly used.
The second parameter is the reverberation time RT , defined as the time required for the sound energy density to decay by 60 dB with respect to its initial value. The sound is usually generated by a steady sound-source, but even impulse sources or other types of deterministic test signals can be preferred, such as the exponential sweep signal used for the experimental campaign described in the following.
G = 10 log10 R∞ 0 h2(t) dt R∞ 0 h210(t) dt (3) where h(t) is the impulse response for a source/receiver pair in the room, and h10(t) is the impulse
response that would be obtained with the same source at a distance of 10 m in free field.
G = Lp− Lp,10= Lp− (Lw− 20 log1010 − 11) ≈ Lp− Lw+ 31 (4)
where Lwis the sound power level of the omni-directional sound source.
The last parameter quantifies spaciousness, a concept involving the impression of being immersed in the reverberant field of the room and that the sound scene is wider than the visual [8]. Both aspects depend on the many directions the sound arrives from, thus the lateral fraction LF is defined as the ratio between the early sound energy arriving laterally hL(t), and the sound energy arriving from all directions:
LF = R80 ms 5 ms h2L(t) dt R80 ms 0 ms h2(t) dt (5) The spatial impression of sound in a hall can also be quantified using other factors, such as the interaural cross-correlation coefficient [9].
3.
Materials and methods
3.1 Measurement of objective parameters
The tests have been performed in the CTM theater in the Brescia province (Italy). The theater has an overall length of 30 m, including the stage, a width of 17 m and a height of 8 m, it features two floors above ground level and has a capacity of 400 seats.
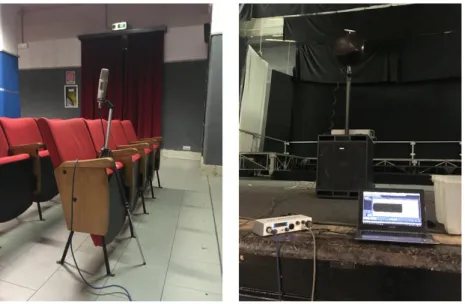
To measure the theater acoustical objective parameters, an omni-directional sound source consisting of a sub-woofer and an Outline dodecahedron sound source have been used. The dodecahedron source was powered by an Outline D4-2K amplifier. The signal was measured by a RØDE NT2-A condenser microphone, which captured both 8-shaped directivity and omni-directional directivity signals. A 15 s exponential sweep in a frequency range from 20 Hz to 20 kHz has been chosen as a test signal. The signals
captured by the microphone have been recorded through Adobe Audition and post-processed withR
Aurora plug-in suite, and the resulting impulse response has been used to calculate the objective acoustic parameters described above. A second measurement has been carried out to calculate G parameter, by means of a Larson Davis 831C sound level meter. 24 measurement points have been identified and the strength G in each of them has been computed by means of Eq. 4.
The objective parameters have been measured in 24 points distributed according to Fig. 3(b). The same blocks defined for the listening sessions have been considered and, given the symmetry of the auditorium, block E, F and I have been assumed to be identical to blocks C, D and I, respectively.
3.2 Subjective perception survey
The “subjective” experimental information has been collected by distributing a questionnaire to a heterogeneous group of people, who gave their impressions about sound perception in the theater after listening to several diverse music tracks. The aim of the survey was to analyze the listeners’ subjective perception of sound in the space, and find if the objective parameters which are often considered during the design of the auditoria are indeed a good descriptor set of the perceived acoustic quality.
Figure 1: Experimental setup: microphone (left); source and acquisition equipment (right).
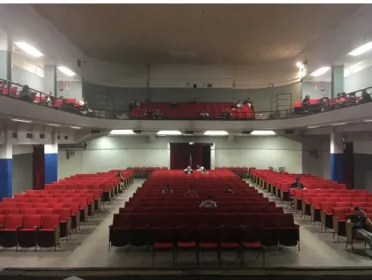
52 people aged between 10 and 75 years have been involved in the survey. In order to increase the focus of the listeners on the sole auditory experience, the choice of well known tracks has been consi-dered essential. With reference to the Italian singles charts, 9 tracks were selected to offer a significant diversification of genre (including rock, pop, hip hop, soundtrack and musical) and played for one minute each by two loudspeakers located at the sides of the stage. To account for the influence of the listening position, the auditorium seats have been grouped into 6 zones (Fig. 3(a)) and the spectators completed the listening session and the questionnaire for each of them. The questionnaire, distributed via Google Forms, consisted of three sections:
• “Knowing the listener”, concerning personal information and background of the spectator;
• “Subjective evaluation”, characterized by a series of questions to which the spectator had to answer during the listening session. This section is designed to provide the most relevant information in terms of correlation to the auditorium objective parameters (see Table 1);
• “Timbre”, to evaluate the hearing perception of the listeners along the frequency range of interest. Table 1: Correspondence between objective parameters and subjective evaluation of the questionnaire.
Objective parameter Subjective parameter Answer range
C80/C50 Clearness of the melodic
se-quence (music/speech)
1 (blurry) to 6 (sharp)
RT Reverberation 1 (dry) to 6 (reverberant)
LF Surrounding effect 1 (highly directional) to 6 (enveloping)
G Sound loudness 1 (weak) to 6 (loud)
3.3 Correlation between objective and subjective data: the random forest algorithm
Data mining techniques have been used to identify items that most impact on the prediction of the overall acoustic quality or on the overall acoustic experience. In detail, the so-called “Random Forest”
Figure 2: A listening session during the experimental survey.
C A E
D B F
H
G I
(a) Blocks (first and second floor)
Sound reproduction system C A E D B F H G I
(b) Measurement points (first and second floor)
Figure 3: Measurement points and listening zones in the auditorium.
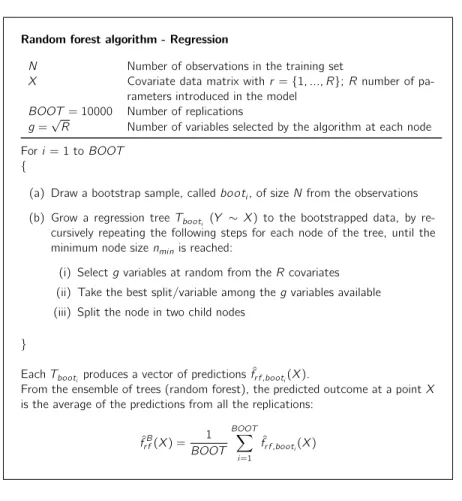
(RF) ensemble method [10] has been used. The method can deal with variables of different nature (qualitative or quantitative), it is robust in case of missing values or outliers, and it is able to model non-linear relationships between variables. The RF algorithm applied in this study is quickly presented in Fig. 4. The goal is to build a statistical model that relates subjective perceptions of a spectator, Y , to the objective parameters relative to that person (X, covariates). In detail, decision trees partition the predictor space X in homogeneous subsets according to the outcome Y . The Random Forests are an extension of decision trees where each tree is built on different bootstrap samples obtained from the data matrix (Y , X). A large number of trees are built (hence the name “random forest”), each of which provides a vector of predictions, and the average of all these vectors is the predicted outcome ˆY .
A variable importance measure, called Mean Decrease in Accuracy (MDA), is extracted from the random forest in order to identify the covariates that most impact on the outcome prediction. In detail, at each tree of the random forest all the values of the rth variable are randomly permuted and the algorithm
Random forest algorithm - Regression
N Number of observations in the training set
X Covariate data matrix with r ={1, ..., R}; R number of
pa-rameters introduced in the model
BOOT= 10000 Number of replications
g=√R Number of variables selected by the algorithm at each node
For i = 1 to BOOT {
(a) Draw a bootstrap sample, called booti, of size N from the observations
(b) Grow a regression tree Tbooti (Y ∼ X) to the bootstrapped data, by
re-cursively repeating the following steps for each node of the tree, until the
minimum node size nminis reached:
(i) Select g variables at random from the R covariates (ii) Take the best split/variable among the g variables available (iii) Split the node in two child nodes
}
Each Tbooti produces a vector of predictions ˆfr f ,booti(X).
From the ensemble of trees (random forest), the predicted outcome at a point X is the average of the predictions from all the replications:
ˆ fr fB(X) = 1 BOOT BOOTX i=1 ˆ fr f ,booti(X)
Figure 4: Random forests algorithm.
is run with the new data set (Y , Xr). It is expected that the new estimates get wide of the mark for very
impacting variables: hence, a loss function Lr is computed and compared with the original loss function
of the ensemble L. This procedure is repeated m times on different bootstrap samples of the data, and the MDA measure for the rth variable is given by the following average (av) on m:
M DAr = avm(Lr− L) (6)
The procedure is repeated for each covariate in the dataset.
4.
Results
4.1 Analysis of the objective parameters
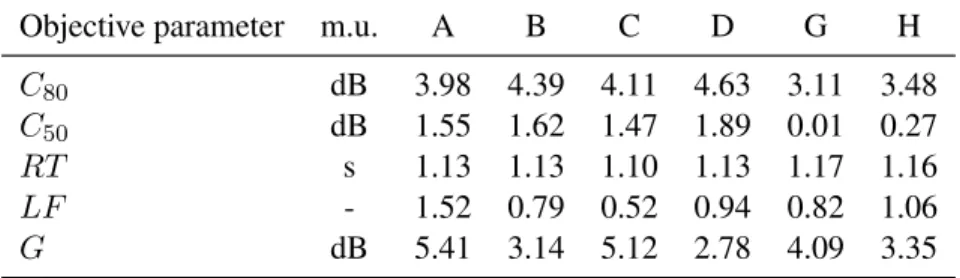
The average values of C80/C50, RT , LF and G parameters have been computed for each of the blocks
outlined in Fig. 3(a). The results are reported in Table 2.
The values of the measured objective parameters were assigned to each participant based on the location of their seat during the survey. The bilateral symmetry of the theater was also used at this stage. In case of missing measurement positions, the values to assign were calculated as the average between the parameters measured in the nearest front and back rows.
Table 2: Average values of the objective parameters measured in the blocks (m.u. = measurement unit).
Objective parameter m.u. A B C D G H
C80 dB 3.98 4.39 4.11 4.63 3.11 3.48 C50 dB 1.55 1.62 1.47 1.89 0.01 0.27 RT s 1.13 1.13 1.10 1.13 1.17 1.16 LF - 1.52 0.79 0.52 0.94 0.82 1.06 G dB 5.41 3.14 5.12 2.78 4.09 3.35 4.2 Analysis of results
The survey provided information about the subjective perception of the listeners. In the questionnaire, the participants evaluated the acoustic quality of the theater and the acoustic experience for each musical genre. Starting from these items, two overall indicators were drawn by calculating the median of the responses given by each participant. These two measures are used as the outcome of the random forest algorithm, and 3 models in the form “Outcome ∼ Predictor-1 + . . . + Predictor-r” have been evaluated:
• M1: Overall acoustic quality ∼ Age + Musical background + Gender + RT + C80+ C50+ G + LF
• M2: Overall acoustic quality ∼ RT + C80+ C50+ G + LF
• M3: Overall acoustic experience ∼ RT + C80+ C50+ G + LF
In model M1 the subjective perception is evaluated using some personal information together with the objective parameters, while in models M2 and M3 the perceptions are related only to the objective parameters. From the random forest, the MDA is extracted in order to understand which covariates have strongest impact on the prediction of the subjective perceptions. The measures obtained are normalized with respect to the most important covariate. Results of the MDA extracted from RF are reported in Fig. 5. LF G Musical background C50 C80 RT Age Gender 90 80 70 60 50 40 30 20 10 100 0
M1 - Overall Acoustic Quality
(a) LF G C50 C80 RT 90 80 70 60 50 40 30 20 10 100 0
M2 - Overall Acoustic Quality
(b) LF RT C50 G C80 90 80 70 60 50 40 30 20 10 100 0
M3 - Overall Acoustic Experience
(c)
Figure 5: Variable importance measures (relative MDA) in models M1, M2 and M3.
It can be observed that the unique demographic information impacting on the overall acoustic quality is the age (Fig. 5(a)), indicating that this parameter strongly influences the perception of sound and, as a consequence, the characteristics that the listener appreciates most. On the other hand, among the objective parameters the acoustic quality appears to be mainly defined by the RT , followed by the C80
(see Fig. 5(a) and Fig. 5(b)). C80 also results as the key parameter for the overall acoustic experience
(Fig. 5(c)). The RT is probably the most intuitive parameter to grasp even for acoustically untrained ears, while C80turns out to be more impacting than C50possibly due to the selected track list, which featured
few songs where the intelligibility of the spoken parts was felt as a decisive factor. In all the considered models, LF results as the less impacting variable on the perceptions expressed by the participants during the survey: the small size of CTM Theater and the choice to play the tracks through two loudspeakers symmetrically placed at the sides of the stage have probably minimized the influence of the lateral fraction on the listeners’ perceptions.
5.
Conclusions
The study of the relationships between the subjective perception and objective acoustic parameters in halls for speech and music is a research topic of great interest. The subjective perception can depend not only on musical taste but also on cultural aspects and personal background. Therefore, it is important to identify a statistical analysis method which is robust enough to provide reliable correlations and to be applicable in different contexts. This preliminary work has shown that the random forest algorithm can be a valid tool for this kind of investigation.
REFERENCES
1. Armani, A., Piana, E. A. and Grassi, B. Influence of measured parameters on the indexes assessing the acoustic performances of buildings, Proceedings of the 17th International Congress on Sound and Vibration, Cairo, Egypt, 18–22 July, vol. 2, pp. 812–817, (2010).
2. Tronchin, L. Francesco Milizia (1725-1798) and the Acoustics of his Teatro Ideale (1773), Acta Acustica united with Acustica, 99 (1), 91–97, (2013).
3. Foreman, J. E. K. and Onderwater, T. G. Analysis of attitudinal response to audible noise from high voltage transmission lines and transformer station, Canadian Acoustics - Acoustique Canadienne, 31 (1), 3–14, (2003).
4. Donini, A., Spezie, R., Cortina, R., Piana, E. A. and Turri, R. Accurate prediction of the corona noise produced by overhead transmission lines, Proceedings of AEIT 2016 – International Annual Conference: Sustainable Development in the Mediterranean Area, Capri, Italy, 5–7 October 2016, (2017).
5. Piana, E. A., Uberti, S., Copeta, A., Motyl, B. and Baronio, G. An integrated acoustic-mechanical develop-ment method for off-road motorcycle silencers: from design to sound quality test, International Journal on Interactive Design and Manufacturing, 12 (3), 1139–1153, (2018).
6. Farina, A. and Tronchin, L. 3D Sound Characterisation in Theatres Employing Microphone Arrays, Acta Acustica united with Acustica, 99 (1), 118–125, (2013).
7. Tronchin, L., Venturi, A. and Farina, A. Subjective evaluations in virtual environments, Proceedings of the International Conference on Acoustics AIA-DAGA 2013, including the 40thItalian (AIA) Annual Conference on Acoustics and the 39thGerman Annual Conference on Acoustics (DAGA), Merano, Italy, 18–21 March, pp. 1617–1620, (2013).
8. Gade, A. C., (2007), Acoustics in halls for speech and music. Handbook of Acoustics, pp. 301–350, Springer.
9. Shimokura, R., Tronchin, L., Cocchi, A. and Soeta, Y. Subjective diffuseness of music signals convolved with binaural impulse responses, Journal of Sound and Vibration, 330 (14), 3526–3537, (2011).