https://doi.org/10.1007/s00415-018-9008-3
ORIGINAL COMMUNICATION
Diagnostic and prognostic power of CSF Tau in amyotrophic lateral
sclerosis
Antonio Scarafino1 · Eustachio D’Errico1 · Alessandro Introna1 · Angela Fraddosio1 · Eugenio Distaso1 ·
Irene Tempesta1 · Antonella Morea1 · Antonella Mastronardi1 · Rosaria Leante2 · Maddalena Ruggieri2 ·
Mariangela Mastrapasqua2 · Isabella Laura Simone1
Received: 3 April 2018 / Revised: 6 August 2018 / Accepted: 7 August 2018 © Springer-Verlag GmbH Germany, part of Springer Nature 2018 Abstract
Background Amyotrophic lateral sclerosis (ALS) is a fatal neurodegenerative disease that still lacks reliable diagnostic bio-markers. This study aims to evaluate the diagnostic and prognostic potential of CSF total Tau (t-Tau), phospho-Tau (p-Tau) and p-Tau/t-Tau ratio in ALS patients using CSF neurofilament light (NFL) as the reference biomarker.
Methods Eighty-five incident ALS, 30 ALS-mimicking (AM) diseases and 51 other non-neurodegenerative diseases (ONND)
were included in the study.
Results ALS patients had higher levels of CSF t-Tau and lower p-Tau/t-Tau ratio than AM (p = 0.005 and p = 0.006) and ONND (p < 0.001). CSF t-Tau levels discriminated ALS from AM with a sensitivity of 69% and specificity of 60%, and from ONND with a sensitivity of 88% and specificity of 51%. These values were lower than the accuracy of CSF NFL in ALS (sensitivity 86% and specificity 87% in distinguishing ALS from AM and sensitivity 83% and specificity 75% from ONND); CSF t-Tau correlated with progression rate and SNIP. CSF p-Tau did not show relation with any ALS clinical features. CSF NFL significantly correlated with all considered clinical parameters. High levels of CSF t-Tau and NFL were related to poor survival.
Conclusion CSF t-Tau showed no reliable diagnostic significance but the relation between the high levels of CSF t-Tau and short survival suggests the potential prognostic role of this biomarker in ALS. However, CSF NFL was confirmed to be the most reliable and efficient tool for diagnosis and prediction of clinical progression and survival in ALS patients.
Keywords Amyotrophic lateral sclerosis · Biomarkers · CSF · Total Tau · Phospho-Tau · Neurofilament light
* Isabella Laura Simone [email protected] Antonio Scarafino [email protected] Eustachio D’Errico [email protected] Alessandro Introna [email protected] Angela Fraddosio [email protected] Eugenio Distaso [email protected] Irene Tempesta [email protected] Antonella Morea [email protected] Antonella Mastronardi [email protected] Rosaria Leante [email protected] Maddalena Ruggieri [email protected] Mariangela Mastrapasqua [email protected]
1 Neurology Unit, Department of Basic Medical Sciences,
Neurosciences and Sense Organs (DBMSNSO), University of Bari “Aldo Moro”, Piazza Giulio Cesare 11, 70100 Bari, Italy
2 Neurophysiopathology Unit, Department of Basic Medical
Sciences, Neurosciences and Sense Organs (DBMSNSO), University of Bari “Aldo Moro”, Piazza Giulio Cesare 11, 70100 Bari, Italy
Introduction
Amyotrophic lateral sclerosis (ALS) is a fatal neurodegen-erative disease resulting from a progressive degeneration of motoneurons (MNs) in the motor cortex, brainstem and spinal cord [1], leading to a worsening muscular weakness and respiratory failure, with a median survival of 3 years from symptom onset [2]. Most of the cases are sporadic (sALS), while a family history was reported in 10% of cases (fALS) [3]. The disease may occur in several clinical phenotypes characterized by a wide variability of course and survival [4, 5].
The diagnostic work-up in ALS is mainly guided by the exclusion of ALS-mimicking diseases. Several stud-ies have tried to identify biological markers of the dis-ease burden [6–8]; however, confounding and conflicting results have been reported. To date, only the neurofila-ments have been proven to be markers of disease severity, indicating their potential prognostic role [9–12].
One of the most debated biomarkers proposed for diagnosis of ALS is the Tau protein [13–16], a microtu-bule-associated protein that plays the role of microtubule stabilizer and assembler promoter [17]; it can be phospho-rylated by specific kinases in the phospho-Tau protein iso-form (p-Tau), leading to its separation from tubuline, with microtubule instability and disintegration. Increased CSF total Tau (t-Tau) levels have been found in several CNS diseases, including Alzheimer’s disease, encephalomyelitis and ischemic stroke [18–20]. Recent studies raised new interest in the diagnostic power of t-Tau and p-Tau in ALS, highlighting that reduced levels of p-Tau and p-Tau/t-Tau ratio in CSF could be suggestive of ALS [21]. On the other hand, other studies refuted this hypothesis, reporting an increase in t-Tau and questioning on the proposed role of p-Tau as a diagnostic biomarker of ALS [22].
The aim of this study is to test the diagnostic and prog-nostic role of CSF t-Tau, p-Tau protein, p-Tau/t-Tau ratio compared to that of neurofilament light (NFL) in patients with ALS, amyotrophic lateral sclerosis mimicking (AM) and other non-neurodegenerative diseases (ONND).
Patients and methods
Patients
Eighty-five incident ALS patients, 33 definite and 52 prob-able ALS according to the revised El Escorial criteria [23], were recruited. Only sporadic ALS, genotyped as negative for mutations in major ALS genes (SOD1, TDP43, FUS, C9orf72), and not responding to FTD diagnostic criteria
[24], have been included in the study. Each patient under-went clinical, neurophysiological, neuropsychological and MR evaluation. Exposure to environmental toxins (Y/N) was reported by patient history. Disease duration from symptom onset; site of onset (bulbar or spinal); prevalence of UMN or LMN at onset; time interval from symptom onset to diagnosis (ODI) were evaluated at time of inclu-sion in the study. ALSFRS-r [25], manual muscle testing (MMT) [26]; time to generalization (time interval between disease spreading from spinal to bulbar district or vice versa—TTG) [27], progression rate [(48–ALSFRS-r)/ disease duration in months] [28] and Sniff Nasal Inspira-tory Pressure (SNIP) [29] were evaluated at the time of inclusion in the study and after 1-year follow-up. After the evaluation of general cognitive status with the MMSE, patients underwent a standardized frontal assessment bat-tery, including Cognitive Behavioural Screen (ALSCBS) [30] and Edinburgh Cognitive and Behavioural ALS Screen (ECAS) [31]. No patient assumed riluzole at the time of inclusion in the study.
Control groups included 30 patients with AM (n.5 heredi-tary spastic paraparesis, n.4 spinal muscular atrophy, n.6 multifocal motor neuropathies, n.15 spondylotic myelopa-thy) and 51 patients with ONND (including migraine, CIDP, diabetic neuropathies, Bell’s palsies). Routine blood tests and brain MRI were normal in all patients.
All cases (ALS and Control patients) were consecutively recruited at the diagnosis time amongst patients attending the Neurology Unit of our Department, from March 2009 to May 2017. The three diagnostic groups were age- and sex-matched. The ALS cohort was followed until May 2018. Population’s demographic and clinical characteristics are listed in Table 1.
This study was approved by the local ethics committee. Patient or family members’ written consent was obtained from each participant.
CSF t‑Tau, p‑Tau and NFL assay
All patients underwent spinal tap for CSF analysis included in the diagnostic work-up of the disease. CSF samples were collected according established procedures, in polypropyl-ene tubes. Lumbar puncture was performed in the morn-ing (from 9.00 a.m. to 11.00 a.m.), then the specimen was centrifuged as soon as possible from the withdrawal (within 60 min), aliquoted in smaller polypropylene tubes. Con-sidering the high susceptibility of NFL to degradation by proteases [32], a protease inhibitor (AEBSF-4-2-aminoethyl benzenesulfonyl fluoride hydrochloride Sigma-Aldrich; St. Louis, MO, USA) was added to the aliquot of CSF used for NFL assay. All aliquots were stored at − 80 °C until analysis.
Commercially available ELISA kits were used for CSF t-Tau and p-Tau assay (Innogenetics; inter-assay variability
coefficient < 10%), as previously reported [14, 16, 22, 33], and for NFL assay (ELISA test Uman Diagnostic AB; Umea, Sweden) (inter-assay variability coefficient < 9%) [9, 11, 34].
Statistical analysis
Demographic and clinical variables were expressed as mean (± SD) or frequencies for continuous and categorical variables. Non-parametric statistics were used because of the non-normal distribution of most of the variables. The Kruskal–Wallis test for multiple independent groups was used for data comparison, followed by the pairwise Dunn’s post hoc test. Receiver operating curve (ROC) was used to calculate an optimal cut-off concentration of CSF t-Tau, p-Tau, p-Tau/t-Tau ratio and NFL to discriminate patients with ALS from AM and ONND. Correlations between parameters were calculated using Spearman’s Rho.
ALS survival was evaluated with tracheostomy or death as events, recording time in months from the symptom onset of the disease. Patients who were alive and had not under-gone tracheostomy by the last follow-up were censored. The prognostic ability of CSF t-Tau, p-Tau and NFL to predict the risk of the hard end point (tracheostomy or death) was assessed using univariate stepwise forward multivariate Cox model and reported as hazard ratios (HRs) with their 95% confidence intervals (CIs), after stratifying patients accord-ing to the median of CSF t-Tau (184 pg/mL), p-Tau (32 pg/
mL) and NFL (6103 ng/L). Time-to-event analysis was per-formed using the Kaplan–Meier method and the survival curves were compared using the log-rank (Mantel–Cox) test in ALS stratified according to the median of CSF t-Tau, p-Tau and NFL concentration.
Statistical analysis was performed with IBM SPSS statis-tics data editor version 22.
Results
CSF t-Tau, p-Tau levels and p-Tau/t-Tau ratio did not corre-late with CSF NFL levels (rs = 0.073, p = 0.59; rs = − 0.093,
p = 0.49; rs = − 0.237; p = 0.076, respectively).
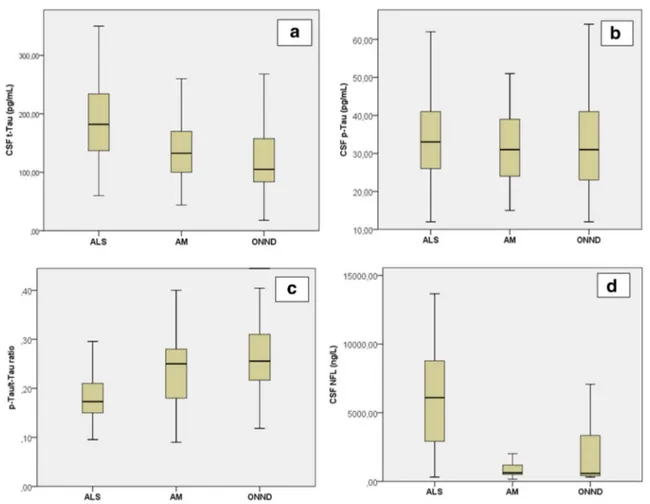
CSF t-Tau, p-Tau/t-Tau ratio and NFL significantly dif-fered between groups (Kruskal–Wallis test, p < 0.001). In particular ALS patients had significantly higher t-Tau levels and lower p-Tau/t-Tau ratio than AM and ONND (Dunn’s post hoc test). On the contrary, CSF p-Tau levels did not differ between ALS, AM and ONND. The concentration of CSF NFL was significantly higher in ALS than in all other diagnostic groups (Table 2). A boxplot of CSF t-Tau, p-Tau, p-Tau/t-Tau ratio and NFL in the diagnostic groups is showed in Fig. 1a–d.
Using ROC analysis, the optimal diagnostic power of CSF t-Tau in discriminating ALS from AM was defined by a cut-off of 143 pg/mL that resulted in a sensitivity of
Table 1 Demographic and Clinical features—at inclusion in the study—of ALS, AM and ONND diagnostic groups
ALS, AM and ONND groups were age- (ANOVA F = 0.703; p = n.s.) and sex-matched (Chi-square test
p = 0.07)
ALS AM ONND
No. of patients (M/F) 85 (57/32) 30 (17/13) 51 (22/29) Age (mean ± SD) 57.96 ± 9.74 56.63 ± 11.23 55.94 ± 9.74 Exposure to environmental toxicants (Y/N) 60/25 N/A N/A Onset-diagnosis interval (ODI), months (mean ± SD) 17.25 ± 15.87 N/A N/A
Site of onset (spinal/bulbar) 64/21 N/A N/A
Prevalence of UMN/LMN at onset 15/70 N/A N/A
ALSFRS-r at spinal tap (mean ± SD) 37.98 ± 6.85 N/A N/A MMT score at spinal tap (mean ± SD) 8.72 ± 1.31 N/A N/A
TTG, months (mean ± SD) 14.58 ± 15.56 N/A N/A
Progression rate at spinal tap (mean ± SD) 0.86 ± 1.35 N/A N/A Frontal cognitive impairment (yes/no) 27/56 N/A N/A
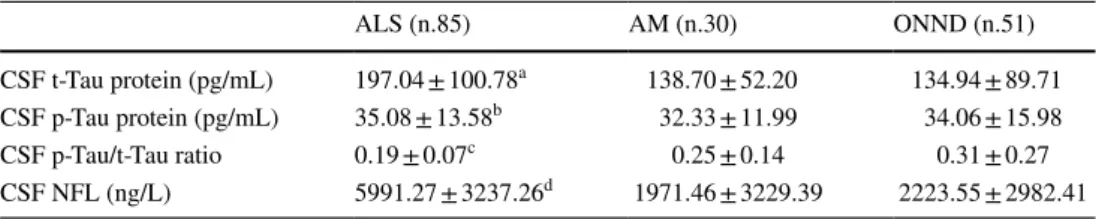
Table 2 CSF t-Tau, p-Tau levels, p-Tau/t-Tau ratio and NFL in ALS, AM and ONND cohorts Kruskal–Wallis test: aK = 27.36, p < 0.001; bK = 1.07, p = n.s.; cK = 37.46, p < 0.001; dK = 36.16, p < 0.001 ALS (n.85) AM (n.30) ONND (n.51) CSF t-Tau protein (pg/mL) 197.04 ± 100.78a 138.70 ± 52.20 134.94 ± 89.71 CSF p-Tau protein (pg/mL) 35.08 ± 13.58b 32.33 ± 11.99 34.06 ± 15.98 CSF p-Tau/t-Tau ratio 0.19 ± 0.07c 0.25 ± 0.14 0.31 ± 0.27 CSF NFL (ng/L) 5991.27 ± 3237.26d 1971.46 ± 3229.39 2223.55 ± 2982.41
69% and specificity of 60%. For the discrimination of ALS from ONND the best diagnostic performance was obtained with a CSF t-Tau cut-off value of 106 pg/mL, with a sen-sitivity of 88% and specificity of 51%. p-Tau protein had a much weaker discriminative power in discriminating ALS from AM (best cut-off 32.5 pg/mL; sensitivity 51%, speci-ficity 54%) and ONND (best cut-off 35.5 pg/mL; sensitiv-ity 45%, specificsensitiv-ity 63%). Similarly, p-Tau/t-Tau ratio was not efficient in discriminating ALS from AM (best cut-off 0.19, sensitivity 41%, specificity 34%) and ONND (best cut-off 0.20, sensitivity 38%, specificity 16%) (Fig. 2a, c).
A CSF NFL concentration above 2180 ng/L yielded the optimal discrimination between ALS and AM at sensitivity of 86% and specificity of 87%, with a positive predictive value (PPV) of 92% and a negative predictive value (NPV) of 51%. CSF NFL showed good diagnostic performance also in discriminating ALS from ONND with an optimal cut-off of 2720 ng/L that resulted in 83% sensitivity and 75% specificity (Fig. 2b, d).
Relations with demographic and clinical characteristics
In pooled diagnostic groups, CSF t-Tau, p-Tau and NFL correlated with age (rs = 0.377 p = 0.001, rs = 0.283
p = 0.01 and rs = 0.427 p = 0.001, respectively). However,
when considering the groups individually, this correlation was not confirmed in ALS. Gender did not influence t-Tau, p-Tau, p-Tau/t-Tau ratio and NFL levels.
CSF t-Tau, p-Tau, p-Tau/t-Tau ratio and NFL did not differ in ALS stratified for occupational exposure to envi-ronmental toxins, site of onset (bulbar/spinal and UMN/ LMN), cognitive impairment. Furthermore, t-Tau did not correlate with ALSFRS-r, MMT and TTG, all calculated both at the time of inclusion of the study and after 1-year follow-up. On the other hand, CSF t-Tau protein positively correlated with progression rate at the time of spinal tap, and inversely with ODI (robust trend towards significance) and SNIP measured at 1-year follow-up. No correlations
Fig. 1 CSF t-Tau levels (a), p-Tau levels (b), p-Tau/t-Tau ratio (c) and NFL levels (d) in ALS, AM and ONND cohorts (p values refer to post hoc Dunn’s test). a ALS vs AM (p = 0.005); ALS vs ONND
(p < 0.001); b ALS vs AM (ns); ALS vs ONND (ns); c ALS vs AM (p = 0.006); ALS vs ONND (p < 0.001); d ALS vs AM (p < 0.001); ALS vs ONND (p < 0.001)
Fig. 2 Receiver Operating Curve (ROC) analysis. Area under curve
(AUC) of CSF t-Tau protein: 0.70 (95% confidence, limits of area 0.6–0.8) (a, solid line), p-Tau protein: 0.54 (95% confidence, limits of area 0.42–0.66) (a, dotted line) and NFL: 0.83 (95% confidence, limits of area 0.72–0.94) (b, dashed line) for discrimination between ALS and AM. Area under curve (AUC) of CSF t-Tau protein: 0.74
(AUC: 0.74; 95% confidence interval, limits of area 0.64–0.83) (c, solid line), p-Tau protein: 0.54 (95% confidence limits of area 0.44– 0.64) (c, dotted line) and NFL: 0.82 (95% confidence, limits of area 0.70–0.93) (d, dashed line) for discrimination between ALS and ONND
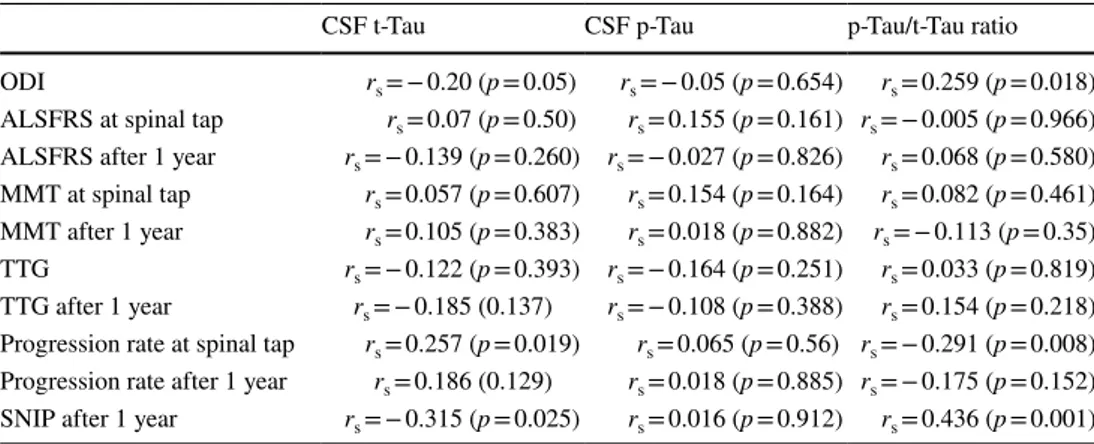
Table 3 Correlation between CSF t-Tau, p-Tau, p-Tau/t-Tau ratio and ALS clinical features
CSF t-Tau CSF p-Tau p-Tau/t-Tau ratio ODI rs = − 0.20 (p = 0.05) rs = − 0.05 (p = 0.654) rs = 0.259 (p = 0.018) ALSFRS at spinal tap rs = 0.07 (p = 0.50) rs = 0.155 (p = 0.161) rs = − 0.005 (p = 0.966)
ALSFRS after 1 year rs = − 0.139 (p = 0.260) rs = − 0.027 (p = 0.826) rs = 0.068 (p = 0.580)
MMT at spinal tap rs = 0.057 (p = 0.607) rs = 0.154 (p = 0.164) rs = 0.082 (p = 0.461) MMT after 1 year rs = 0.105 (p = 0.383) rs = 0.018 (p = 0.882) rs = − 0.113 (p = 0.35)
TTG rs = − 0.122 (p = 0.393) rs = − 0.164 (p = 0.251) rs = 0.033 (p = 0.819)
TTG after 1 year rs = − 0.185 (0.137) rs = − 0.108 (p = 0.388) rs = 0.154 (p = 0.218) Progression rate at spinal tap rs = 0.257 (p = 0.019) rs = 0.065 (p = 0.56) rs = − 0.291 (p = 0.008)
Progression rate after 1 year rs = 0.186 (0.129) rs = 0.018 (p = 0.885) rs = − 0.175 (p = 0.152)
were found between CSF p-Tau and all clinical features (Table 3).
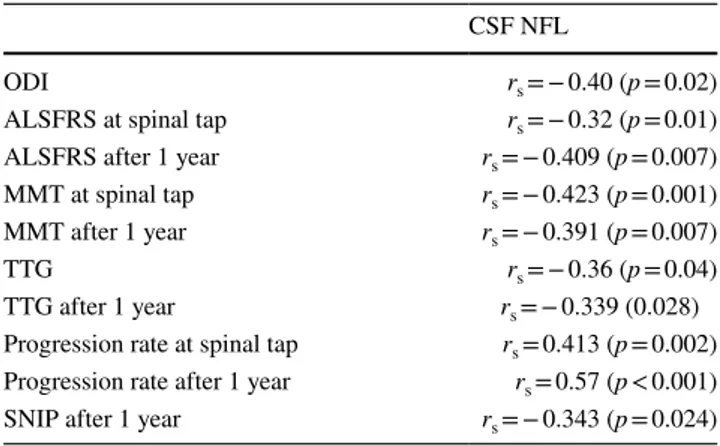
CSF NFL inversely correlated with ODI, ALSFRS-r score at spinal tap and after 1-year follow-up, with TTG, MMT at spinal tap and after 1 year follow-up, FVC measured after 1-year follow-up and directly with progression rate at spinal tap and—even stronger—after 1-year follow-up (Table 4).
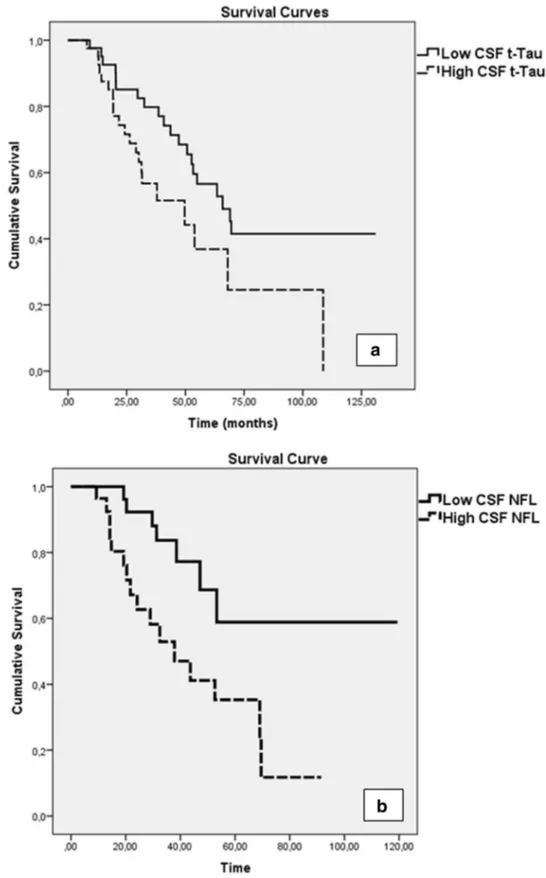
The Kaplan–Meier analysis showed that ALS patients with high levels of CSF t-Tau at the time of diagnosis (higher than 184 pg/mL) had a short survival (log-rank test
χ2 = 5.219; p = 0.022) (Fig. 3a). The median survival was
31.20 months in the group with high CSF t-Tau levels and 52.96 months for low CSF t-Tau (p = 0.001). Cox univariate hazard ratio of tracheostomy/death was 2.08 (p = 0.021, 95% CI 1.09–3.94), meaning that patients with higher CSF levels of t-Tau had a two-fold increased risk of tracheostomy/death at any time during the follow-up compared to patients with lower levels of CSF t-Tau. After adjusting for gender, age, site of onset, ODI, TTG, cognitive impairment and SNIP measured after 1-year follow-up, the significance was not modified. On the other hand, the inclusion of progression rate as covariate in the multivariate model led to a loss of significance for t-Tau as predictor of death/tracheotomy risk (Table 5).
No difference in overall survival was found between patients with high/low p-Tau CSF levels neither for high/ low p-Tau/t-Tau ratio.
CSF NFL levels were predictive of survival in ALS cohort, with poor survival in patients with NFL levels higher than 6103 ng/L (log-rank test χ2 = 7.365; p = 0.007)
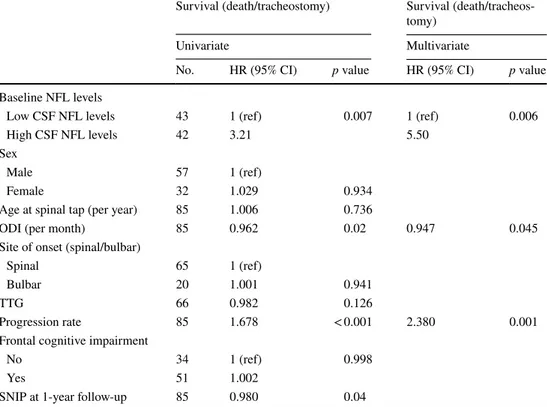
(Fig. 3b). Cox multivariate model revealed that higher levels of CSF NFL were related to a 4.22 hazard ratio of death/ tracheotomy in each time of the follow-up (p = 0.007, 95% CI 1.48–12.03), a result confirmed after adjusting for gen-der, age, site of onset, ODI, TTG, progression rate, cogni-tive impairment and SNIP measured after 1-year follow-up. However, in the multivariate model, also the progression
rate and ODI represented significant prognostic factors for survival even after adjusting for all the other clinical and demographic covariates (Table 6).
Discussion
Our cross-sectional study confirmed high CSF t-Tau levels in ALS patients, reflecting the burden of neurodegenera-tion that characterizes the disease [22]. Furthermore, the reduction of p-Tau/t-Tau ratio is due to the increased t-Tau and not to decreased p-Tau, differently from what reported in a previous study [21]. On the other hand, the process of phosphorylation of Tau, that is one of the major pathological finding in AD, occurs in a lesser extent in other neurodegen-erative disorders, such as ALS [33].
The accuracy of CSF t-Tau in distinguishing ALS from ONND showed a sensitivity of 88% and specificity of 51%; a little increase of the diagnostic accuracy is found in dis-tinguishing from the diseases with clinical features similar to ALS (AM), where the specificity rises up to 60%. Nev-ertheless, the significance of these values is suboptimal in comparison to that of CSF NFL which better discriminated ALS from ONND or AM (specificity of 75 and 87%, respec-tively), also according to other authors [10, 11, 33]. These data suggest a lower diagnostic power of t-Tau protein for ALS [33, 35], making it an unreliable diagnostic biomarker and confirming NFL as a reference diagnostic biomarker for ALS, as already previously stated [9]. For these reasons, the diagnostic potential of CSF t-Tau and p-Tau levels has been extensively investigated in ALS, with conflicting results. Some authors found higher levels of t-Tau protein in ALS patients than in control cohorts [15, 22], differently from other studies where the authors concluded that Tau protein is not a useful diagnostic biomarker for ALS [11, 14, 16, 36,
37]. In other studies, attention was focused on the CSF p-Tau with conflicting results too [21, 22].
A relationship between high CSF t-Tau levels, sever-ity of disease (expressed by progression rate [38, 39]) and respiratory impairment (as expressed by SNIP meas-ured at 1-year follow-up) has been observed. These results partially conflict with previous studies in which the prognostic role of this CSF biomarker was resized [14, 15, 33]. The potential prognostic value of t-Tau is confirmed after stratifying the cohort according to the median CSF t-Tau levels: we found in fact that the overall survival was shorter in patients with higher levels of CSF t-Tau protein. Anyway, when we used the Cox multivari-ate model to quantify the predictive power of high CSF t-Tau levels on the risk of death/tracheostomy we found that this biomarker was predictive also when the model was adjusted for sex, age and SNIP but it lost its pre-dictive power with the insertion of the progression rate
Table 4 Correlation between CSF NFL levels and ALS clinical
fea-tures
CSF NFL
ODI rs = − 0.40 (p = 0.02)
ALSFRS at spinal tap rs = − 0.32 (p = 0.01) ALSFRS after 1 year rs = − 0.409 (p = 0.007) MMT at spinal tap rs = − 0.423 (p = 0.001) MMT after 1 year rs = − 0.391 (p = 0.007)
TTG rs = − 0.36 (p = 0.04)
TTG after 1 year rs = − 0.339 (0.028) Progression rate at spinal tap rs = 0.413 (p = 0.002) Progression rate after 1 year rs = 0.57 (p < 0.001) SNIP after 1 year rs = − 0.343 (p = 0.024)
in the model, a parameter with a well-established and evidently stronger predictive power [38, 39]. CSF p-Tau levels showed no relation with the survival. Given that, when we compare the diagnostic and prognostic potential
of CSF t-Tau in comparison to that of NFL, our data con-firm the absolute superiority of CSF NFL, considered as the most reliable and efficient tool for diagnosis and prediction of clinical progression and survival in ALS
Fig. 3 Kaplan–Meier survival curve in ALS stratified accord-ing to the median CSF t-Tau levels (184 pg/mL). Survival is reduced in patients with CSF t-Tau above (a, dashed line) compared with those below (a, solid line) median value (log-rank test χ2 = 5.124; p = 0.02).
Kaplan–Meier survival curve in ALS stratified according to the median CSF NFL levels (6103 ng/L). Survival is reduced in patients with CSF NFL above (b, dashed line) compared with those below (b, solid line) median value (log-rank test
patients. Nevertheless, the significant relation with sur-vival observed also for CSF t-Tau suggests a prognostic potential of this biomarker.
This study was approved by the local ethics committee. Patient or family members’ written consent was obtained
from each participant. The study has been performed in accordance with the ethical standards laid down in the 1964 Declaration of Helsinki and its later amendments.
Table 5 Summary of
univariate and multivariate Cox analysis for survival to death/ tracheostomy in the cohort of ALS patients, referred to t-Tau levels
Survival (death/tracheostomy) Survival (death/tracheos-tomy)
Univariate Multivariate
No. HR (95% CI) p value HR (95% CI) p value
Baseline Tau levels
Low CSF t-Tau levels 43 1 (ref)
High CSF t-Tau levels 42 2.081 0.02
Age at spinal tap (per year) 85 1.006 0.736 Sex
Male 57 1 (ref)
Female 32 1.029 0.934
ODI (per month) 85 0.962 0.02
Site of onset (spinal/bulbar)
Spinal 65 1 (ref)
Bulbar 20 1.001 0.941
TTG 66 0.982 0.126
Progression rate 85 1.678 < 0.001 1.703 < 0.001
Frontal cognitive impairment
No 34 1 (ref)
Yes 51 1.002 0.998
SNIP at 1-year follow-up 85 0.980 0.04
Table 6 Summary of
univariate and multivariate Cox analysis for survival to death/ tracheostomy in the cohort of ALS patients, referred to NFL levels
Survival (death/tracheostomy) Survival (death/tracheos-tomy)
Univariate Multivariate
No. HR (95% CI) p value HR (95% CI) p value
Baseline NFL levels
Low CSF NFL levels 43 1 (ref) 0.007 1 (ref) 0.006
High CSF NFL levels 42 3.21 5.50
Sex
Male 57 1 (ref)
Female 32 1.029 0.934
Age at spinal tap (per year) 85 1.006 0.736
ODI (per month) 85 0.962 0.02 0.947 0.045
Site of onset (spinal/bulbar)
Spinal 65 1 (ref)
Bulbar 20 1.001 0.941
TTG 66 0.982 0.126
Progression rate 85 1.678 < 0.001 2.380 0.001
Frontal cognitive impairment
No 34 1 (ref) 0.998
Yes 51 1.002
Compliance with ethical standards
Conflicts of interest The authors declare that they have no conflict of interest.
References
1. Strong M, Rosenfeld J (2003) Amyotrophic lateral sclerosis: a review of current concepts. Amyotroph Lateral Scler Other Motor Neuron Disord 4(3):136–143
2. Chiò A, Logroscino G, Traynor BJ et al (2013) Global epidemiol-ogy of amyotrophic lateral sclerosis: a systematic review of the published literature. Neuroepidemiology 41(2):118–130 3. Chia R, Chiò A, Traynor BJ (2018) Novel genes associated with
amyotrophic lateral sclerosis: diagnostic and clinical implications. Lancet Neurol 17(1):94–102
4. Van den Berg-Vos RM, Visser J, Franssen H et al (2003) Sporadic lower motor neuron disease with adult onset: classification of sub-types. Brain 126(Pt 5):1036–1047
5. Chiò A, Calvo A, Moglia C, Mazzini L, Mora G, PARALS study group (2011) Phenotypic heterogeneity of amyotrophic lateral sclerosis: a population-based study. J Neurol Neurosurg Psychia-try 82(7):740–746
6. Turner MR, Kiernan MC, Leigh PN, Talbot K (2009) Biomarkers in amyotrophic lateral sclerosis. Lancet Neurol 8(1):94–109 7. Bowser R, Turner MR, Shefner J (2011) Biomarkers in
amyo-trophic lateral sclerosis: opportunities and limitations. Nat Rev Neurol 7(11):631–638
8. Tarasiuk J, Kułakowska A, Drozdowski W, Kornhuber J, Lewczuk P (2012) CSF markers in amyotrophic lateral sclerosis. J Neural Transm 119(7):747–757
9. Tortelli R, Ruggieri M, Cortese R et al (2012) Elevated cerebro-spinal fluid neurofilament light levels in patients with amyotrophic lateral sclerosis: a possible marker of disease severity and progres-sion. Eur J Neurol 19(12):1561–1567
10. Tortelli R, Copetti M, Ruggieri M et al (2015) Cerebrospinal fluid neurofilament light chain levels: marker of progression to general-ized amyotrophic lateral sclerosis. Eur J Neurol 22(1):215–218 11. Steinacker P, Feneberg E, Weishaupt J et al (2016) Neurofilaments
in the diagnosis of motoneuron diseases: a prospective study on 455 patients. J Neurol Neurosurg Psychiatry 87(1):12–20 12. Poesen K, De Schaepdryver M, Stubendorff B et al (2017)
Neuro-filament markers for ALS correlate with extent of upper and lower motor neuron disease. Neurology 88(24):2302–2309
13. Süssmuth SD, Tumani H, Ecker D, Ludolph AC (2003) Amyo-trophic lateral sclerosis: disease stage related changes of tau pro-tein and S100 beta in cerebrospinal fluid and creatine kinase in serum. Neurosci Lett 353(1):57–60
14. Jiménez-Jiménez FJ, Hernánz A, Medina-Acebrón S et al (2005) Tau protein concentrations in cerebrospinal fluid of patients with amyotrophic lateral sclerosis. Acta Neurol Scand 111(2):114–117 15. Brettschneider J, Petzold A, Süssmuth SD, Ludolph AC, Tum-ani H (2006) Axonal damage markers in cerebrospinal fluid are increased in ALS. Neurology 66(6):852–856
16. Paladino P, Valentino F, Piccoli T, Piccoli F, La Bella V (2009) Cerebrospinal fluid tau protein is not a biological marker in amyo-trophic lateral sclerosis. Eur J Neurol 16(2):257–261
17. Goedert M (1993) Tau protein and the neurofibrillary pathology of Alzheimer’s disease. Trends Neurosci 16:460–465
18. Süssmuth SD, Reiber H, Tumani H (2001) Tau protein in cer-ebrospinal fluid (CSF): a blood-CSF barrier related evaluation in patients with various neurological diseases. Neurosci Lett 300(2):95–98
19. Sunderland T, Linker G, Mirza N et al (2003) Decreased beta amyloid1–42 and increased tau levels in cerebrospinal fluid of patients with Alzheimer disease. JAMA 289:2094–2103 20. Satoh K, Shirabe S, Tsujino A et al (2007) Total tau protein
in cerebrospinal fluid and diffusion-weighted MRI as an early diagnostic marker for Creutzfeldt–Jakob disease. Dement Geri-atr Cogn Disord 24:207–212
21. Grossman M, Elman L, McCluskey L et al (2014) Phospho-rylated tau as a candidate biomarker for amyotrophic lateral sclerosis. JAMA Neurol 2014;71(4):442–448
22. Wilke C, Deuschle C, Rattay TW, Maetzler W, Synofzik M (2015) Total tau is increased, but phosphorylated tau not decreased, in cerebrospinal fluid in amyotrophic lateral sclero-sis. Neurobiol Aging 36(2):1072–1074
23. Brooks BR, Miller RG, Swash M, Munsat TL, World Federa-tion of Neurology Research Group on Motor Neuron Diseases (2000) El Escorial revisited: revised criteria for the diagnosis of amyotrophic lateral sclerosis. Amyotroph Lateral Scler Other Motor Neuron Disord 1(5):293–299
24. Strong MJ, Abrahams S, Goldstein LH et al (2017) Amyotrophic lateral sclerosis-frontotemporal spectrum disorder (ALS-FTSD): revised diagnostic criteria. Amyotroph Lateral Scler Frontotemporal Degener 18(3–4):153–174
25. Cedarbaum JM, Stambler N, Malta E et al (1999) The ALS-FRS-R: a revised ALS functional rating scale that incorporates assessments of respiratory function. BDNF ALS Study Group (Phase III). J Neurol Sci 169(1–2):13–21
26. Aitkens S, Lord J, Bernauer E et al (1989) Relationship of man-ual muscle testing to objective strength measurements. Muscle Nerve 12:173–177
27. Tortelli R, Copetti M, Panza F et al (2016) Time to generalisa-tion as a predictor of prognosis in amyotrophic lateral sclerosis. J Neurol Neurosurg Psychiatry 87(6):678–679
28. Kimura F, Fujimura C, Ishida S et al (2006) Progression rate of ALSFRS-R at time of diagnosis predicts survival time in ALS. Neurology 66:265–267
29. Miller JM, Moxham J, Green M (1985) The maximal sniff in the assessment of diaphragm function in man. Clin Sci 69:91–96 30. Woolley SC, York MK, Moore DH et al (2010) Detecting
frontotemporal dysfunction in ALS: utility of the ALS cogni-tive behavioral screen (ALS-CBS). Amyotroph Lateral Scler 11(3):303–311
31. Poletti B, Solca F, Carelli L et al (2016) The validation of the Italian Edinburgh cognitive and behavioural ALS screen (ECAS). Amyotroph Lateral Scler Frontotemporal Degener 17(7–8):489–498
32. Goldstein ME, Sternberger NH, Sternberger LA (1987) Phospho-rylation protects neurofilaments against proteolysis. J Neuroim-munol 14(2):149–160
33. Pijnenburg YA, Verwey NA, van der Flier WM, Scheltens P, Teunissen CE (2015) Discriminative and prognostic potential of cerebrospinal fluid phosphoTau/tau ratio and neurofilaments for frontotemporal dementia subtypes. Alzheimer’s Dement 1(4):505–512
34. Petzold A, Altintas A, Andreoni L et al (2010) Neurofilament ELISA validation. J Immunol Methods 352(1–2):23–31 35. Bourbouli M, Rentzos M, Bougea A et al (2017) Cerebrospinal
fluid TAR DNA-binding protein 43 combined with Tau proteins as a candidate biomarker for amyotrophic lateral sclerosis and fron-totemporal dementia spectrum disorders. Dement Geriatr Cogn Disord 44(3–4):144–152
36. Ganesalingam J, An J, Shaw CE et al (2011) Combination of neu-rofilament heavy chain and complement C3 as CSF biomarkers for ALS. J Neurochem 117(3):528–537
37. Lehnert S, Costa J, de Carvalho M et al (2014) Multicentre quality control evaluation of different biomarker candidates for
amyotrophic lateral sclerosis. Amyotroph Lateral Scler Fronto-temporal Degener 15(5–6):344–350
38. Labra J, Menon P, Byth K et al (2016) Rate of disease progression: a prognostic biomarker in ALS. J Neurol Neurosurg Psychiatry 87(6):628–632
39. Chiò A, Logroscino G, Hardiman O et al (2009) Prognos-tic factors in ALS: a criPrognos-tical review. Amyotroph Lateral Scler 10(5–6):310–323