Biometric evaluation of twelve olive cultivars under
rainfed conditions in the region of Calabria, South Italy
A.M. GiuffrèUniversità degli Studi “Mediterranea” di Reggio Calabria (Italy) - Dipartimento di Agraria
INTRODUCTION
The olive tree (Olea europea L.) is one of the most widely
distributed plants in the Mediterranean basin, but it is also cultivated in the Middle East and South America, mainly Argentina. Thousands of cultivars are grown around the world, more than five hundreds only in Italy. Three types of olive threes exist: for oil production, for table olives, for dual use (both oil and table). The main criteria to distinguish among these three olive types are: fruit size, flesh weight/ pit weight ratio and the oil content. When the fruit has an average weight below 3 g, the cultivar is used almost exclusively for oil production, however if it weights more than 5 g it can be a table cultivar. Between 3 and 5 g the fruits have a dual use. When the flesh/pit ratio is higher than 5, the, the fruit is used as a table olive, whereas it is used for oil production if this ratio is lower than 3. An oil content of 12-13% of fresh olive weight is considered to be the minimum limit for oil production. Many cultivars (Marra et al., 2013) have been catalogued in Calabria (South
Italy) and biometric data of drupes are used to choose
the technological process for each cultivar. The quality of fruits and consequentially of olive oil was related to olive harvesting systems in the same geographical area: Abenavoli and Proto (2015) showed that mechanization in oliviculture improve the quality of drupes.
Results on biometrics of olive fruit from NorthEast Portugal were presented by Pinheiro et al. (2005) which
studied the cultivars Verdeal Transmontana, Cobrançosa and Madural and by Peres et al. (2011) which studied the
cultivars Cobrançosa, Cordovil, Madural, Negrinha de Freixo, Santulhana, Verdeal Transmontana., In Central Italy Rosati et al. (2009) studied the cultivars Koroneiki,
Canino, Nocellara del Belice, Ascolana tenera, Arbequina, Moraiolo, Frantoio, Carolea, Leccino and Rosciola. These Authors quantified the influence of cultivar and harvest year on the studied fruits. In the Southern Italian region of Calabria, studies have been conducted mainly on the olive oil produced from the same cultivars studied in this work and the influence of cultivar and harvest year was found for the following parameters: sterols (Giuffrè 2012; Biometrics are widely considered in table olive and olive oil production. Fruit size, flesh content and flesh/pit ratio are among the most important parameters in table olive processing, whereas oil and water content are among the most important parameters in olive oil production. In this work, twelve parameters from drupes of 12 cultivars in three harvest years 2014, 2015, 2016 (Region of Calabria, South Italy) were studied. Fruit weight was highest in Nocellara Messinese cv (more than 5 g in all the three considered harvest years) for this reason these fruits are preferred for table olives processing. Ottobratica cv showed the lowest number of fruits/kg as a consequence of the high weight of its drupes. Pit or stone (endocarp) weight was lowest in Ottobratica, Pendolino and Roggianella cvs (less than 0.5 g). Fresh flesh (mesocarp) weight was highest in Nocellara Messinese cv (4.26 – 4.49 g) and in Picholine cv (3.68 – 3.88 g), whereas flesh dry weight was highest in Frantoio and in Roggianella (more than 40% on pitted fruit), these last two cvs also showed the lowest moisture content i.e. less than 60% on pitted fruit. The longest drupes (longitudinal diameter) were produced by Nocellara Messinese and Picholine cvs measuring more than 25 mm, these two cvs produced also the fruits showing the highest horizontal diameter more than 18 and more than 16 mm respectively. In 10 from 12 cvs the highest oil content was found on 2016 and Pendolino cv showed the lowest content on 2014 and 2015. Cultivar and harvest year showed a highly significant influence on the olive fruit biometrics.
Keywords: ANOVA; Biodiversity; Biometrics; Cultivar; Drupe; Harvest year; Olive
A B S T R A C T
http://www.ejfa.me/
R E G U L A R A R T I C L E
*Corresponding author:
Dr. Angelo M. Giuffrè, Università degli Studi “Mediterranea” di Reggio Calabria. Dipartimento AGRARIA, Contrada Melissari, 89124 (Reggio Calabria), Italia. Phone +39 (0) 965.1694362, E.mail: [email protected].
Giuffrè et al., 2012; Giuffrè and Louadj, 2013), wax esters
(Giuffrè 2013a; Giuffrè, 2014a), fatty alcohols (Giuffrè, 2013b; Giuffrè, 2014b; Giuffrè, 2014c), triglycerides (Giuffrè, 2013c; Giuffrè, 2014d), fatty acid methyl esters (Piscopo et al., 2016), prediction olive ripening (Benalia et al.,
2017) these results have to be associated to the biometrics to implement the information on each cultivar and on its possible use in relation to the production geographical area. The aim of this work was to describe the biometrics of fruits from 12 of the main olive cultivars growing in the Calabria and to study the influence of cultivar and harvest year on biometrics, also in relation to fruit use.
MATERIALS AND METHODS
Cassanese, Coratina, Frantoio, Itrana, Leccino, Nocellara Messinese, Nociara, Ottobratica, Pendolino, Picholine, Roggianella and Sinopolese were the cultivars chosen for this experiment. All cultivars grown in the same geographical area of the Gioia Tauro Plan at 115 m on the sea level (South-West Calabria, Italy). The maximum temperature of this geographical area is 42-43 °C on August (in the morning) and the minimum is -1.5 °C on January/ February (in the night). The rain fell per year (mean between 2014-2015-2016) was 575 mm. Calabria is the second Italian region for olive oil production: 755,032 tons on 2016 (Istat. it, 2017). Ottobratica and Sinopolese are autochthonous for this area, Cassanese originates from Nord-East Calabria and all other cultivars were allochthonous for this geographical area and for this region. Ten 25-30 year-old trees were randomly selected for each cultivar. Plants were chosen along an oblique line between two opposite corners of the orchard. Trees of all cultivars were own-rooted and the same fertilisation program was applied each year with N, P and K in a ratio 20/10/10. Pruning was conducted every two years, deadwood was removed each year. The ground is flat, alluvial, with silt and sand. The environment is humid and temperate. Olive trees were not irrigated. The antiparasitic treatments were mainly against: Bactrocera oleae, Spilocaea oleaginea and Colletotricum gloeosporioides. Fruits
(3 kg per tree) were manually and randomly collected in the 2014, 2015 and 2016 harvest years when the maturity index was 3 (IOC, 2011). Each cultivar grown in a specific and unirrigated orchard. Plants were healthy and uniform in size. Biometric data were determined within 6 hours of olive picking. Oil was extracted by a Soxhlet apparatus as follows: the dried olive flesh was weighed and packaged with filter paper before being placed overnight in the Soxhlet in a petroleum ether bath at room temperature, thereafter the temperature was increased up to the petroleum ether boiling point and the oil extraction was conducted with the continuous method for 6 hours. Moisture content was calculated as a percentage of weight of the pitted fruit.
Statistical analysis
Means and standard deviations were statistically analysed by Excel 2010 software. The SPSS version 17.0 was used for correlations (T-test at p < 0.05), one-way ANOVA
(Tukey’s test at p < 0.05), two-way ANOVA (with p < 0.05)
and hierarchical cluster analysis (HCA, Euclidean distance as similarity measurement and furthest neighbour method as amalgamation rule). Principal component analysis (PCA) was conducted by the XLSTAT (2016). A 12 x 3 factorial design (12 olive cultivars x 3 harvest years) was applied. Seven samples (n=7) for each cultivar and for each harvest year were prepared, each sample was analysed in triplicate.
RESULTS AND DISCUSSION
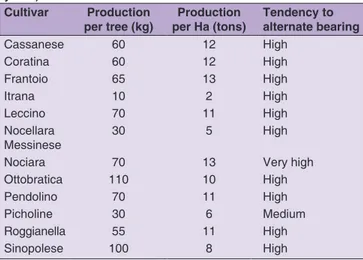
ProductionNociara cv shows the most pronounced alternate bearing and the dupes’ production is concentrated in the on-crop year whereas almost no production there is the off-crop year. However, Nociara cv is also the most producing among the cultivars studied in this work, 13 tons per hectare as mean of two harvest years (on-crop and off-crop years). Ottobratica and Sinopolese shown the highest production per tree (100 kg as a mean of two harvest years), (Table 1).
Fruit weight
Fruit weight is one of the most important parameters and it is mainly considered when fruits are bought for a table olive use. It is correlated with the ovary weight at olive bloom (Rosati et al., 2009). The IOC (2004) size-graded
the fruits with relation to their number per kilogramme or hectogramme (Table 2). In table olive processing size homogeneity is fundamental, for this reason, within each size as defined in table 2, it is stipulated that after removing from a 100 olives aliquot, the olive having the largest horizontal diameter and the olive having the smallest
Table 1: Olive production per tree and per hectare, data are the mean of two years production (on‑crop and off‑crop years)
Cultivar Production
per tree (kg) per Ha (tons)Production Tendency to alternate bearing
Cassanese 60 12 High Coratina 60 12 High Frantoio 65 13 High Itrana 10 2 High Leccino 70 11 High Nocellara Messinese 30 5 High
Nociara 70 13 Very high
Ottobratica 110 10 High
Pendolino 70 11 High
Picholine 30 6 Medium
Roggianella 55 11 High
horizontal diameter, the difference between the horizontal diameters of the remaining olives may not exceed 4 mm. The IOC classifies olives in three main categories: small-sized (less than 3 g), medium-small-sized (3-5 g), and large-sized (> 5 g). By the IOC classification, only Nocellara Messinese was constantly in the large-sized category and produced the heaviest drupes. Cassanese and Picholine produced medium-sized fruits (more than 4 g) in all the three studied years, i.e. drupes more heavy than drupes from Sayali cv obtained in North Tunisia (Hannachi, et al.,
2008). Itrana produced medium-sized olives in two out of the three considered harvest years (Fig. 1). Ottobratica produced the smallest fruits in all the harvest years, always less than 1.5 g, i.e. less than 1/3 weight of the fruits from the cultivars producing the heaviest drupes. In traditional home olive table preparation in Calabria, all the 12 studied cultivars are used for both table olives preparing and for oil extraction, but in a industrial process, Nocellara Messinese, Cassanese, Picholine and Itrana are preferred. Cultivar very highly significantly influenced fruit weight (p< 0.001); harvest year influenced less this parameter
(p< 0.05), (Table 3). Aganchich et al (2008) studied olive
trees (Moroccan Picholine cv) and found that plants irrigated with 100% of the crop evapotranspiration on the
two sides of the root system produced drupes having a significant lower weight if compared with plants submitted to partial rootzone drying.
Hannachi et al. (2008) examined the fresh weight of drupes
from cultivars and from oleaster in Tunisia and verified the influence of the geographical area on this parameter, in addition drupes from cultivars were found to be more heavy than drupes from oleaster.
Flesh weight
Many aspects are related to the flesh weight. Fruit size and consequently flesh weight influence parasitic attacks:
Psyttalia concolor having a relatively short ovipositor prefers
fruits with a thin mesocarp whereas the Bacrocera oleae larva
prefers to feed deep inside the mesocarp (Wang et al., 2009).
From the point of view of table olive processing the flesh weight and consequently the flesh thickness is one of the parameters influencing the time of brine (NaCl in a aqueous solution) and/or lye (NaOH in a aqueous solution) diffusion into the flesh (Garrido-Fernández et al., 1997).
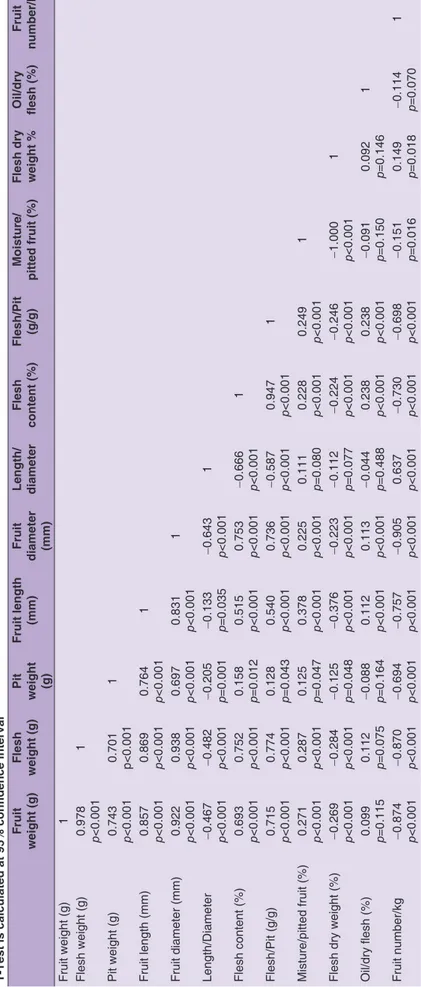
In the present work the flesh weight was found to be in accordance to the fruit weight, in fact Nocellara Messinese had the highest absolute flesh content, being in the 4.0-4.5 g range. Cassanese and Picholine were in the 3.0-4.0 g range. All other cultivars had a flesh weight lower than 3 g (Fig. 2). A very high correlation was found between the fruit weight and the flesh weight (0.978, p < 0.001) whereas pit weight
was less correlated with fruit weight (0.743, p < 0.001),
meaning that the pit had a lesser influence on total fruit weight (Table 4). Ebiad and Abou-Qaoud (2014), studied three cultivars (Nabali Baladi, Nabali Moassan and Souri) growing in a semi-coastal location in Palestina, they found cultivar to significantly influence the flesh weight with the cv Nabali Mohassan to produce drupes having more than twice the flesh weight (2.94 g) if compared with cv Souri (1.22 g). The latter cultivar showed a flesh weight similar to our Frantoio cv which ranged between 1.20 g and 1.37 g from 2014 to 2016 harvest year.
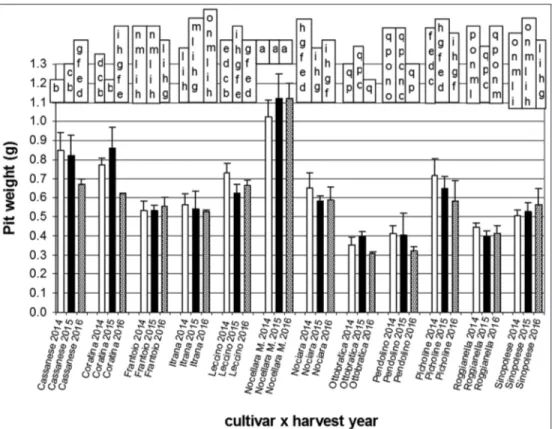
Pit weight
A low pit weight is preferred in both the table processing and the oil extraction industries. Nocellara Messinese showed the highest value in all the three studied years 1.02 g, 1.12 g and 1.12 g for 2014, 2015 and 2016 respectively and it was the only cultivar producing olive pits with a mean fresh weight higher than 1 g. Cassanese, Coratina, Leccino, Nociara and Picholine ranged between 0.6 g and 0.9 g (Fig. 3). The lowest values were always found in Ottobratica, Pendolino and Roggianella. In our work the pit weight was the only parameter not significantly influenced by harvest year (Table 3). All the studied cultivars presented a pit weight higher than the one of Chemlali cv grown in the site of Rouhia in North Tunisia (0.17 g) whereas Leccino and Table 2: Size scale as number of fruits per kilogramme, above
410, the interval is 50 fruits Number of fruits 60/70 121/140 261/290 71/80 141/160 291/320 81/90 161/180 321/350 91/100 181/200 351/380 101/110 201/230 381/410 111/120 231/260 Table 3: Olive fruit biometrics with significant differences. Two‑way ANOVA experiment: cultivar, harvest year, cultivar×harvest year. *** (p<0.001); ** (p<0.01); * (p<0.05); n.s., not significant (p>0.05). Each result is calculated as the mean of seven different replicates for each cultivar and for each harvest year
Cultivar Harvest year Cultivarx Harvest year Fruit weight (g) * * * * * * * Flesh weight (g) * * * * * * * * Pit weight * * * n.s. * * * Flesh/pit * * * * * * * * *
Dried flesh/fresh pitted fruit (%) * * * * * * * * * Fresh flesh/fresh whole fruit (%) * * * * * * * * *
Fruit length (mm) * * * * * * * *
Fruit diameter (mm) * * * * * * * *
Length/diameter * * * * * * *
Moisture (% on stoned fruit) * * * * * * * * * Oil content (% on dry weight) * * * * * * *
Table 4: The correlation matrix is built on the basis of 252 values for each parameter (7 values for each harvest year x 3 harvest years x 12 cultivars), the significance of the T‑Test is calculated at 95% confidence interval Fruit weight (g) Flesh weight (g) Pit weight (g) Fruit length (mm) Fruit diameter (mm) Length/ diameter Flesh content (%) Flesh/Pit (g/g) Moisture/ pitted fruit (%)
Flesh dry weight % Oil/dry flesh (%) Fruit number/kg Fruit weight (g) 1 Flesh weight (g) 0.978 p<0.001 1 Pit weight (g) 0.743 p<0.001 0.701 p<0.001 1 Fruit length (mm) 0.857 p<0.001 0.869 p<0.001 0.764 p<0.001 1 Fruit diameter (mm) 0.922 p<0.001 0.938 p<0.001 0.697 p<0.001 0.831 p<0.001 1 Length/Diameter −0.467 p<0.001 −0.482 p<0.001 −0.205 p=0.001 −0.133 p=0.035 −0.643 p<0.001 1 Flesh content (%) 0.693 p<0.001 0.752 p<0.001 0.158 p=0.012 0.515 p<0.001 0.753 p<0.001 −0.666 p<0.001 1 Flesh/Pit (g/g) 0.715 p<0.001 0.774 p<0.001 0.128 p=0.043 0.540 p<0.001 0.736 p<0.001 −0.587 p<0.001 0.947 p<0.001 1 Misture/pitted fruit (%) 0.271 p<0.001 0.287 p<0.001 0.125 p=0.047 0.378 p<0.001 0.225 p<0.001 0.111 p=0.080 0.228 p<0.001 0.249 p<0.001 1
Flesh dry weight
(%) −0.269 p<0.001 −0.284 p<0.001 −0.125 p=0.048 −0.376 p<0.001 −0.223 p<0.001 −0.112 p=0.077 −0.224 p<0.001 −0.246 p<0.001 −1.000 p<0.001 1 Oil/dry flesh (%) 0.099 p=0.115 0.112 p=0.075 −0.088 p=0.164 0.112 p<0.001 0.113 p<0.001 −0.044 p=0.488 0.238 p<0.001 0.238 p<0.001 −0.091 p=0.150 0.092 p=0.146 1 Fruit number/kg −0.874 p<0.001 −0.870 p<0.001 −0.694 p<0.001 −0.757 p<0.001 −0.905 p<0.001 0.637 p<0.001 −0.730 p<0.001 −0.698 p<0.001 −0.151 p=0.016 0.149 p=0.018 −0.114 p=0.070 1
Fig 1. Variation in fruit weight for three harvest years 2014, 2015 and 2016, for the twelve cultivars. The values represent, for each year, the means of seven replicates ± standard deviation. One-way ANOVA. The values followed by the same letter were not significantly different according to the Tukey’s test at p < 0.05.
Fig 2. Variation in flesh weight for three harvest years 2014, 2015 and 2016, for the twelve cultivars. The values represent, for each year, the means of seven replicates ± standard deviation. One-way ANOVA. The values followed by the same letter were not significantly different according to the Tukey’s test at p < 0.05.
Picholine of the 2014 harvest year had a pit weight similar to Meski cv grown in the site of Makthar in North Tunisia (0.72 g), (Mnasri et al., 2017). The pit size is important in
olive oil extraction, in fact the force applied to broken olives is also related to this parameter. Kiliçkan and Güner (2008) studied some physical properties and mechanical behaviour under compression loading and found that the rupture force, rupture energy, and specific deformation increased as deformation rate and olive fruit size and pit size increased for all compression axes of the fruit.
Flesh/pit ratio
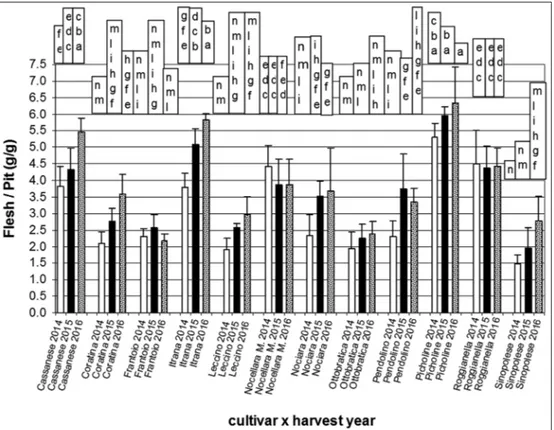
The IOC (2017) indicates 5 as the minimum ratio for the most desirable table olives. From this point of view, Picholine, Itrana, Cassanese and Roggianella are preferred for table olive processing, whereas all other cultivars can be used for oil extraction, mainly the fruits collected from Leccino, Ottobratica and Sinopolese. In the present work, Picholine showed the highest flesh/pit ratio (between 5.31 and 6.34) which signifies the highest relative flesh quantity. Cassanese had a flesh/pit ratio of 3.81 – 5.47, Itrana 3.80 – 5.83, Nocellara Messinese 3.88 – 4.41 and Roggianella 4.44 – 4.49 (Fig. 4). Cultivar and harvest year very highly significantly influenced the flesh/pit ratio (p< 0.001) (Table 3). Ozdemir et al (2016) studied 23 olive candidate cvs and 2 cultivars
grown in Turkey and reported a flesh/pit ratio ranging from
3.34 to 7.00, even if almost all the studied genotypes showed a flesh/pit ratio lower than 6. The two studied Turkish cvs were Ayvalyk and Gemlik which showed a flesh/pit ratio lower than 5, i.e. similarly to our Roggianella cv. Hammami
et al (2011) found a different rate in the increase of flesh and
pit: the mesocarp was found to largely increase with respect to the pit, this was principally due to cell number instead of the cell size; they found a flesh/pit ratio between 3.0 (Lechin cv) and less than 6 in six cvs grown in Spain. Morales-Sillero
et al (2008) found that the pit size can be influenced by a water
deficit at the beginning of fruit growth and as a consequence the flesh/pit ratio in water stressed plants can be greater if compared with fully irrigated trees.
Flesh dry weight of pitted fruit
The flesh determined as dry weight of the pitted fruit showed a high variability between cultivars and between the harvest years. Only Nocellara Messinese showed the same flesh dry weight over the three harvest years (Fig. 5). Almost all cultivars showed a decrease in flesh dry weight from 2014 to 2016. Frantoio and Roggianella showed the highest value, more than 40% on compared to the fresh pitted fruit. Cassanese and Pendolino showed the lowest content (22.77%-22.39% respectively). Desouky
et al. (2010) studied Arbequina, Bouteillan and Koroneiki
cultivars growing in Egypt on 2004 and 2006 harvest years
Fig 3. Variation in pit weight for three harvest years 2014, 2015 and 2016, for the twelve cultivars. The values represent, for each year, the means of seven replicates ± standard deviation. One-way ANOVA. The values followed by the same letter were not significantly different according to the Tukey’s test at p < 0.05.
Fig 4. Variation in flesh/pit ratio for three harvest years 2014, 2015 and 2016, for the twelve cultivars. The values represent, for each year, the means of seven replicates ± standard deviation. One-way ANOVA. The values followed by the same letter were not significantly different according to the Tukey’s test at p < 0.05.
Fig 5. Variation in flesh dry weight (%) calculated on pitted fruit for three harvest years 2014, 2015 and 2016, for the twelve cultivars. The values represent, for each year, the means of seven replicates ± standard deviation. One-way ANOVA. The values followed by the same letter were not significantly different according to the Tukey’s test at p < 0.05.
and found a rapid rate of increase in dry weight in the early phase, thereafter the increment turned to be slow. A similar rate of increase was found by Laila Haggag et al. (2013) in
Egypt in the cultivars Aggizi shame and Aggizi.
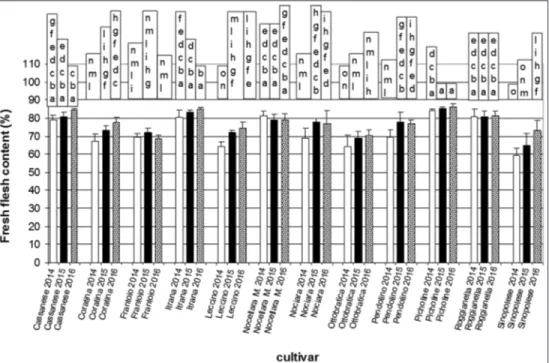
Fresh flesh percentage of whole fruit
The fresh flesh content calculated as a percentage of the whole fruit was highest in Cassanese, Itrana and Picholine, always more than 79% (Fig. 6). This parameter confirms the suitability of these three cultivars to be processed as olive tables. Cultivar and harvest year highly influenced the percentage of fresh flesh. Cultivar, harvest year and the combination of these two variables were very highly significantly influenced this parameter (p< 0.001), (Table 3).
Pinheiro and Esteves da Silva (2005) studied the fresh flesh content of three cvs in NortEast Portugal and found 73.33% in Madural, 75.86% in Cobrançosa, 77.59% in Verdeal Transmontana, similarly to our Nociara and Pendolino cvs.
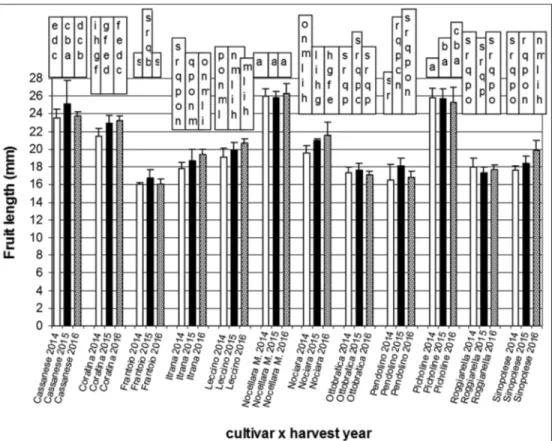
Fruit length, fruit diameter and fruit length/fruit diameter ratio
Nocellara Messinese cv produced the drupes showing the highest longitudinal and horizontal dimeter (more than 25 mm and more than 18 mm, respectively). Picholine and Cassanese cvs showed the second and the third longest drupes, respectively (Figs. 7-8).
In Ottobratica and Pendolino cv were measured the shortest drupes (17-18 mm), (Fig.7). Coratina cv measured less than 15 mm in all the three studied years (Fig. 8). The cultivars
producing the smallest fruits produced drupes similar to those produced from Nabali Baladi cv, Nabali Mohassan cv and Souri cv grown in Palestine (Ebiad and Abu-Qaoud, 2014). Length, diameter and length/diameter ratio influence the olive shape and consequently the olives’ position in the can in table olive industry, in fact, when olives are well-developed in length they are vertically positioned from the base to the top of the can. Ottobratica cv and Sinopolese cv showed the highest length/diameter ratio (Fig. 9). The harvest year significantly influenced the olive fruit biometrics, in 2015 all the twelve studied cultivars produced the heaviest, longest and largest fruits. A very high correlation was found between diameter and flesh weight (0.938, p < 0.001) and
diameter and fruit weight (0.922, p < 0.001), (Table 4). Moisture content
Frantoio and Roggianella presented a moisture content lower than 60% in all the three studied harvest years, whereas Cassanese (more than 75%) and Pendolino (more than 70%) showed the highest values (Fig. 10). Moisture content is an important parameter for the speed at which brine or lye diffuses in the flesh during preservation, for this reason Cassanese and Pendolino are preferred if a fast brine or lye diffusion is required. On the other hand a high moisture content indicates both a lower oil and dry flesh content. The skin (exocarp) is externally covered with a waxy layer which slows down the penetration of the preserving liquid into the endocarp. Cultivar and harvest year highly significantly influenced the moisture content (Table 3). Other studies conducted in Morocco proved that
Figure 6. Variation in fresh flesh content (%) for three harvest years 2014, 2015 and 2016, for the twelve cultivars. The values represent, for each year, the means of seven replicates ± standard deviation. One-way ANOVA. The values followed by the same letter were not significantly different according to the Tukey’s test at p < 0.05.
Fig 7. Variation in fruit length for three harvest years 2014, 2015 and 2016, for the twelve cultivars. The values represent, for each year, the means of seven replicates ± standard deviation. One-way ANOVA. The values followed by the same letter were not significantly different according to the Tukey’s test at p < 0.05.
Fig 8. Variation in fruit diameter for three harvest years 2014, 2015 and 2016, for the twelve cultivars. The values represent, for each year, the means of seven replicates ± standard deviation. One-way ANOVA. The values followed by the same letter were not significantly different according to the Tukey’s test at p < 0.05.
Fig 9. Variation in length/diameter ratio for three harvest years 2014, 2015 and 2016, for the twelve cultivars. The values represent, for each year, the means of seven replicates ± standard deviation. One-way ANOVA. The values followed by the same letter were not significantly different according to the Tukey’s test at p < 0.05.
Fig 10. Variation in moisture content (%) calculated on pitted fruit for three harvest years 2014, 2015 and 2016, for the twelve cultivars. The values represent, for each year, the means of seven replicates ± standard deviation. One-way ANOVA. The values followed by the same letter were not significantly different according to the Tukey’s test at p < 0.05.
the water content in fruits of Picholine marocaine is also influenced by irrigation (Aganchich et al., 2008).
Oil content
Oil content of the fruit is depends on many parameters such as the position of the fruit in the canopy (IOC, 2007; Bartolini et al., 2014), in fact, when olive harvesting is
carried out, the drupes growing in the internal part of the canopy or on its NorthWest side have generally a lower oil content because they receive less light compared to the drupes growing in the external part of the canopy or compared to those growing on its SouthEast side. For this reason it is very important to conduct a random sampling. In our work, cultivar and harvest year were proved to influence the oil content. In each of the three studied harvest years, a different cultivar produced the highest oil quantity, Ottobratica, Nociara and Leccino for 2014, 2015 and 2016 respectively (Fig.11). Frantoio, Nocellara Messinese and Roggianella were the cultivars showing the least influence of the harvest year. Sinopolese produced almost twice as much oil in 2016 compared to the previous year. Almost all cultivars showed the highest oil production in the 2016 harvest year. A low oil content is preferred for table olives because oil acidification during storage reduces the olive quality. Lavee and Wodner (2004) studied cvs Barnea and Manzanillo in Israel and found that the oil content on dry weight in drupes of
different sizes from irrigated high yielding olive trees was higher than in drupes from irrigated low yielding olive trees when fruits were at full black maturation, whereas the contrary was at early stages of green maturation. Their results showed that drupes Barnea and Manzanillo cvs at full black maturation contained about 55% of oil on pulp dry weight and calculated by a refractometric method.
Fruit number/kg
Fruit number per kg is related to fruit weight. Fruit drop is closely correlated with water stress and plant nutritional status (IOC, 2007). Ottobratica produced the highest fruit number per kg with an high variability between the harvest years: 1015, 782 and 963 fruits for 2014, 2015 and 2016 harvest years respectively (Fig. 12). A high variability was also found in the other cultivars with the exceptions of Nocellara Messinese which produced fewer than 200 fruits/ kg for each harvest year. Cultivar very highly significantly influenced the fruit number/kg (p < 0.001), whereas harvest
year showed a lower, although significant, effect (p < 0.05),
(Table 3).
Cluster analysis
Cluster analysis was found to available to find similarities in olive cultivars (Obaid et al., 2014). All the cultivars
considered in our study were found to cluster into two
Fig 11. Variation in oil content (%) calculated on dried flesh for three harvest years 2014, 2015 and 2016, for the twelve cultivars. The values represent, for each year, the means of seven replicates ± standard deviation. One-way ANOVA. The values followed by the same letter were not significantly different according to the Tukey’s test at p < 0.05.
main clades (Fig. 13). Clade 1 contained the cultivars more suitable for the olive oil production, whereas clade 2 contained those cultivars more suitable for table olives. Ottobratica and Sinopolese were suitable for olive oil extraction and were the only two cultivars autochthonous to the area studied in this work, they showed a high similarity and were both clustered in the same sub-cluster at a distance of 1. Frantoio and Roggianella were suitable for olive oil extraction and formed a lateral sub-cluster at the distance of 3. Nocellara Messinese, the cultivar
showing the largest fruit was at a distance of 3 and formed a sub-cluster with Itrana and Picholine which were at a distance of 2.
Principal component analysis
The PCA was performed to identify the association of biometrics of olive fruits with specific regions. This analysis is available to extract useful features (Distante et al., 2002). In addition, the 12 cultivars were distinguished
according to their biometric parameters. Eleven Eigen values were obtained and together accounted for 100% of the cumulative variability, with a highest value of 7.194. Two Eigen Values were chosen in the graphic 7.194 with 59.95 % of the variability and 2.064 with 17.20% of the variability, accounting for about 77% of variance. The visualization of the discrimination between the different olive cultivars on the plane of the first two functions led to a distinct separation (Fig.14). The different cultivars were split between the four sides of the plane which demonstrate the significant difference between the cultivars. The graphic also shows how the parameters are linked or separated from the cultivar factor. The fruit weight was positively correlated with the flesh weight and negatively correlated with the fruit number/ kg. Fruit weight was more correlated with fruit diameter than with fruit length. Flesh dry weight calculated as a
Fig 12. Variation in number of fruit/kg for three harvest years 2014, 2015 and 2016, for the twelve cultivars. The values represent, for each year, the means of seven replicates ± standard deviation. One-way ANOVA. The values followed by the same letter were not significantly different according to the Tukey’s test at p < 0.05.
Fig 13. Two-dimensional dendrogram obtained from the cluster analysis of the fruit biometrics from the 12 olive cultivars. Vertically the cultivars; horizontally the differentiation level between cultivars.
percentage of flesh fresh weight was the only parameter in the bottom left loading plot. The fruit length/fruit diameter ratio was in the top left loading plot with fruit number/kg ratio. Ottobratica and Sinopolese, the two autochthonous cultivars for the geographical area where this study was conducted, were in the same loading plot and were characterised by the fruit number/kg. Nocellara Messinese and Picholine were characterised by fruit weight and by flesh weight. Moisture seems to be independent of cultivar but it appears to be in relation with the fruit length.
CONCLUSION
Olive cultivars grown in South Calabria (Italy), even if cultivated in the same geographical area and with the same agronomic conditions, demonstrated a high biometric variability which was due to the influence of cultivar and a consequence to the biodiversity of this geographic region. Cultivar and harvest year were found to significantly affect the biometrics of drupes. Cassanese, Itrana and Picholine produced the drupes with the highest fresh flesh percentage and the highest flesh/pit ratio, for this reason they can be preferred for table olive production. Leccino, Nociara and Ottobratica cultivars produced the drupes with the highest oil quantity. The cultivars producing the smallest fruits (Ottobratica and Sinopolese) were clustered in the group of the autochthonous cultivars; the large-sized olives were from allochthonous cultivars (Nocellara Messinese, Cassanese and Picholine).
AKNOWLEDGEMENTS
This research was supported by: Distretto ad alta tecnologia agroindustriale della Calabria AGRIFOODTECH – PROGETTO PON03PE_00090_2. Sustainable models and new technologies for olives and olive oil.
REFERENCES
Abenavoli, L. M. and A. R. Proto. 2015. Effects of the divers olive harvesting systems on oil quality. Agron. Res. 13: 7-16. Aganchich, B., A. El-Antari, S. Wahbi, H. Tahi, R. Wakrim and R.
Serraj 2008. Fruit and oil quality of mature olive trees under partial root zone drying in field conditions. Grasas. Aceites. 59: 225-233.
Bartolini, S., A. Leccese and L. Andrein. 2014. Influence of canopy fruit location on morphological, histochemical and biochemical changes in two oil olive cultivars. Plant Biosyst. 148: 1221-1230. Benalia, S., B. Bernardi, J. Blasco, A. Fazari and G. Zimbalatti. 2017.
Assessment of the ripening of olives using computer vision. Chem. Eng. Trans. 58: 355-360.
Desouky, I. M., F. L. Haggag, M. M. M. Abd El-Migged and E. S. El-Hady. 2010. Change in some physical and chemical fruit properties during fruit development stage of some olive oil cultivars. Am. Eurasian J. Agric. Environ. Sci. 7: 12-17.
Distante, C., M. Leo, P. Siciliano and K. C. Persaud. 2002. On the study of feature extraction methods for an electronic nose. Sens. Actuators B. 87: 274-288.
Ebiad, R. and H. Abu-Qaoud. 2014. Morphological and biochemical characterization of three olive ‘Olea europaea L.’ cultivars in Palestine. Jordan J. Agric. Sci. 10: 130-142.
Garrido-Fernández, A., M. J. Fernández-Díez and M. R. Adams. 1997. Table Olives, Production and Processing, Chapter of a
Fig 14. Biplot (scores and loadings). Cultivars are listed as follow: 1, Cassanese; 2, Coratina; 3, Frantoio; 4, Itrana; 5, Leccino; 6, Nocellara Messinese; 7, Nociara; 8, Ottobratica; 9, Pendolino; 10, Picholine; 11, Roggianella; 12, Sinopolese.
Book, Chapman & Hall Editor, Great Britain, p. 134.
Giuffrè, A. M. 2012. Steroli, eritrodiolo e uvaolo in olio di oliva da cultivar coltivate in Calabria. Ind. Aliment. 51: 20-26.
Giuffrè, A. M., L. Louadj, M. Poiana and A. Macario. 2012. Composition en sterols des huiles extraites d’olives de cultivars de la province de Reggio Calabria (Sud d’Italie). Riv. Ital. Sostanze Grasse. 89: 177-183.
Giuffrè, A. M. and L. Louadj. 2013. Influence of crop season and cultivar on sterol composition of mono-varietal olive oils in Reggio Calabria (Italy). Czech J. Food Sci. 31: 256-263. Giuffrè, A. M. 2013a. Influence of harvest year and cultivar on wax
composition of olive oils. Eur. J. Lipid Sci. Technol. 115: 549-555. Giuffrè, A. M. 2013b. Alcoli alifatici e terpenici in olio di oliva estratto
da cultivar coltivate in Calabria. Ind. Aliment. 52: 28-35. Giuffrè, A. M. 2013c. Influence of cultivar and harvest year on
triglyceride composition of olive oils produced in Calabria (Southern Italy). Eur. J. Lipid Sci. Technol. 115: 928-934. Giuffrè, A. M. 2014a. Wax ester variation in olive oils produced in
Calabria (Southern Italy) during olive ripening. J. Am. Oil Chem. Soc. 91: 1355-1366.
Giuffrè, A. M. 2014b. Evolution of fatty alcohols in olive oils produced in Calabria (Southern Italy) during fruit ripening. J. Oleo Sci. 63: 485-496.
Giuffrè, A. M. 2014c. The effects of cultivar and harvest year on fatty alcohol composition of olive oils from South West Calabria (Italy), Grasas. Aceites. 65: e011.
Giuffrè, A. M. 2014d. Variation in triacylglycerols of olive oils produced in Calabria (Southern Italy) during olive ripening. Riv. Ital. Sostanze Grasse. 91: 221-240.
Hammami, S. B. M., T. Manrique and H. F. Rapoport. 2011. Cultivar-based fruit size in olive depends on different tissue and cellular processes throughout growth. Sci. Hortic. Hamsterdam. 130: 445-451.
Hannachi, H., C. Breton, M. Msallem, S. B. El-Hadj, M. El-Gazzah and A. Bervillé. 2008. Differences between native and introduced olive cultivars as revealed by morphology of drupes, oil composition and SSR polymorphisms: A case study in Tunisia. Sci. Hortic. 116: 280-290.
IOC. 2004. Trade Standard Applying to Table Olives, COI/OT/NC No. 1, Resolution No. RES-2/91-IV/04, Trade Standard Applying to Table Olives.
IOC. 2007. Production Techniques in Olive Growing. International Olive Council, Madrid.
IOC. 2011. Guide for the Determination of the Characteristics of Oil-Olives. COI, OH, Doc. No. 1.
IOC. 2017. Available from: http://www.internationaloliveoil.org/ estaticos/view/78-tips. [Last accessed on 2017 Sep 07]. Istat.it. 2017. Available from: http://www.agri.istat.it/jsp/dawinci.jsp?q
=plC270000010000032100&an=2016&ig=1&ct=311&id=15A|21
A|32A. [Last accessed on 2017 Sep 06].
Kiliçkan, A. and M. Güner. 2008. Physical properties and mechanical behavior of olive fruits (Olea europaea L.) under compression loading. J. Food Eng. 87: 222-228.
Laila, H. F., M. F. M. Shahin, E. A. E. Genaidy and A. A. Fouad. 2013. Changes in fruit weight, dry matter, moisture content and oil percentage during fruit development stages of two olive cultivars. Middle East J. Agric. Res. 2: 21-27.
Lavee, S. and M. Wodner. 2004. The effect of yield, harvest time and fruit size on the oil content in fruits of irrigated olive trees (Olea europaea), cvs. Barnea and Manzanillo. Sci. Hortic. 99: 267-277. Marra, F. P., T. Caruso, F. Costa, C. Di Vaio, R. Mafrica and A.
Marchese. 2013. Genetic relationships, structure and parentage simulation among the olive tree (Olea europaea L. subsp. Europaea) cultivated in Southern Italy revealed by SSR markers. Tree Gen. Genomes. 9: 961-973.
Mnasri, S. R., O. D. Saddoud, S. Rouz, M. Ben Saleh and A. Ferchichi. 2017. Morphological analysis of the autochthon olive varieties cultivated in the North West of Tunisia. J. New Sci. Agric. Biotechnol. 37: 2042-2048.
Morales-Sillero, A., H. Rapoport, J. E. Fernández and A. Troncoso. 2008. Olive fruit flesh and pit growth under differing nutrient supply. Sci. Hortic. Hamsterdam. 117: 182-184.
Obaid, R., H. Abu-Qaoud and R. Arafeh. 2014. Molecular characterization of three common olive (Olea europaea L.) cultivars in Palestine, using simple sequence repeat (SSR) markers. Biotechnol. Biotechnol. Equip. 28: 813-817.
Ozdemir, Y., A. Ozturk, E. Guven, M. A. Nebioglu, N. A. Tangu, M. E. Akcay and S. Ercisli. 2016. Fruit and oil characteristics of olive candidate cultivars from Turkey. Notulae Bot. Hortic. Agrobot. Cluj-Napoca. 44: 147-154.
Peres, A. M., P. Baptista, R. Malheiro, L. G. Dias, A. Bento and A. Pereira. 2011. Chemometric classification of several olive cultivars from Trás-os-Montes region (Northeast of Portugal) using artificial neural networks. Chemometr. Intell. Lab. Syst. 105: 65-72.
Pinheiro, P. B. M. and J. C. G. Esteves da Silva. 2005. Chemometric classification of olives from three Portuguese cultivars of Olea
europaea L. Anal. Chim. Acta. 544: 229-235.
Piscopo, A., A. De Bruno, A. Zappia, C. Ventre and M. Poiana. 2016. Characterization of monovarietal olive oils obtained from mills of Calabria region (Southern Italy). Food Chem. 213: 313-318.
Rosati, A., M. Zipanćič, S. Caporali and G. Padula. 2009. Fruit weight is related to ovary weight in olive (Olea europaea L.). Sci. Hortic. Hamsterdam. 122: 399-403.
Wang, X. G., M. W. Johnson, K. M. Daane and Y. Yokoyama. 2009. Larger olive fruit size reduces the efficiency of Psyttalia concolor, as a parasitoid of the olive fruit fly. Biol. Control. 49: 45-51.