ISSN 2291-4951 E-ISSN 2291-496X
Published by Science and Education Centre of North America
Addressing Longevity’ Heterogeneity in Pension Scheme Design
Mercedes Ayuso1, Jorge Miguel Bravo2, Robert Holzmann3,*1Department of Econometrics, Statistics and Spanish Economy, University of Barcelona, Spain 2Information Management School, Nova University of Lisbon, Portugal
3Austrian Academy of Sciences, Vienna, Austria; and University of New South Wales, Sydney, Australia
∗ Corresponding author: Robert Holzmann, Email: [email protected]
Received: March 01, 2017 Accepted: May 28, 2017 Online Published: August 31, 2017 DOI: 10.12735/jfe.v6n1p1 URL: http://dx.doi.org/10.12735/jfe.v6n1p1
Copyright © Mercedes Ayuso et al.**
Abstract
This paper demonstrates that the link between heterogeneity in longevity and lifetime income across countries is mostly high and often increasing; that it translates into an implicit tax/subsidy, with rates reaching 20 percent and higher in some countries; that such rates risk perverting redistributive objectives of pension schemes and distorting individual lifecycle labor supply and savings decisions; and that this in turn risks invalidating current reform approaches of a closer contribution-benefit link and life expectancy-indexed retirement age. The paper suggests and explores a number of interventions in the accumulation, benefit determination, and disbursement stages to address longevity’ heterogeneity.
JEL Classifications: D9, G22, H55, J13, J14, J16
Keywords: Defined Contribution Scheme, Tax/Subsidy Structure, Proxied Life Expectancy, Two-Tier Contribution Structure
1. Introduction
Increased longevity is quite likely one of the most important socioeconomic advances to happen to mankind. This trend started only about 250 years ago in then advanced economies and has since spread across the world. While a welcome development, longer lives create challenges for all societal institutions, particularly those providing retirement income, health care, and long-term care. Nonetheless, longevity is a strong indicator of societal progress, similar to increased available income and consumption per capita.
Yet as with income per capita, advances in longevity –measured via a reduction in mortality rates or, conversely, increased life expectancy at specific ages – is not homogenous across socioeconomic groups
** This is an open access article distributed under the terms of the Creative Commons Attribution 4.0 International
License (http://creativecommons.org/licenses/by/4.0/). Licensee: Science and Education Centre of North America
How to cite this paper: Ayuso, M., Bravo, J. M., & Holzmann, R. (2017). Addressing longevity heterogeneity in
(Brown & McDaid, 2003). International evidence, currently available only for highly developed countries, suggests that heterogeneity in longevity arises across many socioeconomic dimensions, is often sizable, is becoming more prevalent, and shows few signals of abating in the near future (Ayuso, Bravo, & Holzmann, 2016).
Some authors have analyzed heterogeneity of longevity across different socioeconomic factors such as age(Oeppen & Vaupel, 2006; World Health Organization [WHO], 2015), gender (Eurostat, 2015), race (Kaiser Family Foundation, 2009), education (Miech, Pampel, Kim, & Rogers, 2011; Fiske, Kaplan, Spittel, & Zeno, 2014), geographic location (Chang et al., 2015; Eurostat, 2015), civil status (Kaplan & Kronick, 2006; Alaminos & Ayuso, 2015;Rendall, Weden, Favreault, & Waldron, 2011), and how some of these factors are highly correlated with (lifetime) income (Hoffmann, 2005; Fong, 2015). Income across the life-cycle forms the basis for contributions and savings efforts that in turn give rise to disbursement in the form of pensions/annuities. Since heterogeneity of longevity is positively linked to income across individuals’ lifecycle, major implicit taxes result for lower-income groups as do subsidies for higher-income groups if a unique average life expectancy or similar measure is applied when calculating the value of individuals’ lifetime benefit (annuity) at retirement.
Heterogeneity in longevity is conjectured to have important distributive and efficiency effects that risk counteracting current reform efforts. Longevity heterogeneity modifies the redistributive features of pension schemes, since part of the income redistribution may be amplified, neutralized, or even reversed by mortality differentials. The tax/subsidy effect of heterogeneous life expectancy counteracts the desired outcomes of recent pension reform trends, which aim to establish a closer contribution-benefit link with non-negligible effects on labor market outcomes. Population aging calls for appropriate policy responses in pension design, and the most promising one – an increase in retirement age with actuarial adjustments in benefits – risks being compromised by heterogeneity in longevity.
Some determinants of mortality heterogeneity and implications for pricing annuities are analyzed by Meyricke and Sherris (2013). The problem is well known in the context of an insurance competitive market. If the same price for the annuity is offered for all annuity buyers, low risk and high risk individuals are not fairly treated. In order to avoid this situation some different classifications of annuitants can be found (Kwon & Jones, 2006; Steinorth, 2012; Su & Sherris, 2012). Individual unobservable factors, referred as frailty, are very relevant in this context. Meyricke and Sherris (2013) also show relevance of education, marital status, body mass index (BMI), smoking status and medical history to explain differences in annuities valuation according heterogeneity in longevity by using generalized linear mixed models. The use of alternative econometric techniques, as multi-state models and interval-censored data, among others, can be recently found (see Boumezoued, Karoui and Loisel (2017) how changes in marital status along the life of individual impact on life insurance products).
In the context of pensions, an earlier paper explored the scope and trend of longevity across documented socioeconomic dimensions of industrialized countries and provided first estimates on the scope of the tax/subsidy effect of heterogeneity, which can reach 20 percent or more in both directions (Ayuso et al., 2016). This paper deepens the analysis and focuses on the implications for policy design and options for corrections. Specifically, to address heterogeneity in longevity and its link to income, various policy options may be activated at the accumulation, annuitization, or disbursement stage of the contribution-benefit link, or over all three. The analysis herein suggests that such compensating policy design options exist to reduce or at least broadly contain the effects of heterogeneity on reform design and can be operationalized.
The structure of the paper is as follows: Section 2 offers further information on the scope of implicit taxes and subsidies in current pension schemes. Section 3 highlights the implications of longevity heterogeneity for pension reform and design. Section 4 discusses the key policy options to address longevity heterogeneity in benefit design. Section 5 presents exploratory modelling and first estimates associated with compensating for heterogeneity in longevity during the accumulation, annuitization, and disbursement stages. Section 6 offers conclusions and suggestions for next steps.
2. Heterogeneity as Implicit Tax/ Subsidy Mechanism
In OECD countries, mandated pension schemes can be considered one of the most comprehensive redistributive engines that societies have created, equal or second only to public health care schemes. Much of the redistribution that pension schemes create can be considered welfare-enhancing for individuals and society. However, the redistributive effect of heterogeneity in longevity that is positively linked with lifetime income does not fall into that category. Instead, it perverts redistributive intentions and creates major distortions. This section first briefly highlights the key redistributive mechanisms of pension schemes that typically produce a positive welfare economic effect. The second part outlines why heterogeneity in longevity can be considered akin to a tax/subsidy mechanism that risks counteracting redistributive objectives and creating major distortions for individuals’ lifecycle decisions. The last part of this section presents empirical evidence on the scope of the tax/subsidy component for lifetime income, the key socioeconomic factor related to heterogeneity in longevity.
2.1. Welfare-Enhancing Redistributive Mechanisms
Three main mechanisms of mandated pension schemes are typically considered to redistribute income in a welfare-enhancing manner: redistribution of income across lifecycles and generations; creation of a risk pool to address the uncertainty of death; and some redistribution of income from the lifetime rich to the lifetime poor. Each of these three mechanisms is discussed briefly in turn.
2.1.1. Redistribution across Lifecycles and Generations
A key requirement for an individual to optimize consumption across the lifecycle is the ability to save when young and working and to dis-save when old and retired. Having an earnings level sufficiently high to do so is necessary but not sufficient. One also needs a way to exchange resources now for resources in the future. Financial instruments can do this if they are available and accessible for all. Yet even in highly industrialized economies, credible financial institutions and instruments that can span the required 80 or so years (from one’s entry to the labor market until one’s death) are rare.
Establishing and mandating a pension scheme can substitute for the lack of market instruments. The welfare gains for the poorest will be much larger than those for richer individuals, as the latter have other instruments available to them, and do not want to dis-save completely. Under conditions of asymmetric market constraints, pension schemes (and other publicly run intertemporal exchange mechanisms) have huge redistributive effects even if no interpersonal income redistribution takes place. Actually, in social welfare or equality-measured terms, intrapersonal redistributive effects across the lifecycle dwarf any interpersonal redistributive effects by a large margin (Holzmann, 1984; 1990).
2.1.2. Redistribution through Risk Pooling
Providing an efficient mechanism to carry resources into the future is only “Part one” of the welfare-enhancing story of public intervention. “Part two” is to offer a mechanism that addresses the uncertainty of death; i.e., provision of a lifetime annuity. Without such an instrument, individuals risk exhausting their accumulated resources or leaving unintended bequests. By requiring all individuals to participate in a risk pool against the uncertainty of death, governments can offer economies of scale and scope as a monopolistic annuity provider. The welfare effects created can be high unless they are reduced or even turned negative by incomplete markets for other social contingencies or by a mandated replacement rate that is too high – see Davidoff, Brown, and Diamond (2005); Holzmann and Hinz (2005); and Reichling and Smetters (2015).
If all individuals have the same life expectancy across the lifecycle, an annuity has no ex-ante distribution if actuarially fair annuities are provided. Of course, an annuity creates a redistribution ex-post, as some individuals die early and forfeit their resources to those who die later. And if life expectancies are not equal for all, an annuity also creates ex-ante redistributive effects if a common average life expectancy is applied.
The direction of the overall effect depends on the link of life expectancy to lifetime income. If the correlation is positive (as the evidence suggests), the rich gain; if the correlation is negative, the poor do so.
2.1.3. Redistribution from the Lifetime Rich to the Lifetime Poor
Various pension schemes across the world have an explicit redistributive structure that offers higher replacement rates for lower income earners. Such an approach can be rationalized by a variety of considerations, including: welfare economic evaluations of differences in marginal utility of income; the better access of higher-income groups to supplementary occupational provisions that garner generous tax treatment; and the compensation for less complete insurance periods and fluctuating incomes for lower-income groups.
In many countries the idea of a closer link between contributions and benefits has taken hold, as such a link could: eliminate perverse redistributive effects in traditional defined benefit (DB) schemes, which favor white-collar employees with rising wage profiles over blue-collar workers with flat or concave wage profiles; offer more transparency in the redistributive process the link needs to be explicitly introduced; and offer better labor market incentives, including for retirement decisions.
Whatever the motivation, heterogeneity in longevity affects the redistributive game plan. At its worst, it weakens or contradicts pension schemes’ objectives and distorts individuals’ savings and labor supply decisions.
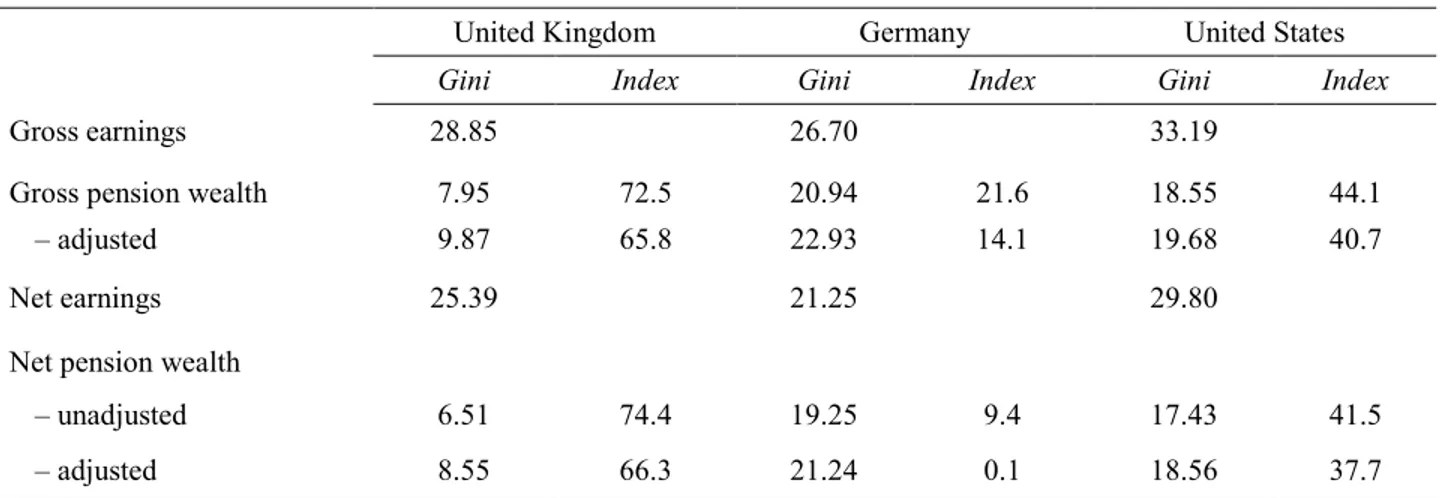
Table 1 shows for three OECD countries how heterogeneity in longevity affects the progressivity of pension schemes (Whitehouse & Zaidi, 2008). The inequality of the contribution base (measured via gross earnings) is lowest in Germany, which has a measure of income inequality (Gini coefficient) of 26.70. The highest inequality is in the United States, with a Gini coefficient of 33.19, while the United Kingdom’s Gini coefficient (28.84) is closer to that of Germany. Measuring the inequality of retirement income through pension wealth (i.e., the present value of pensions until death at retirement), the United Kingdom has the lowest Gini coefficient (7.95), reflecting the most redistributive pension scheme. The United States comes second (18.55) followed by Germany (20.94). Correcting pension wealth for differences in longevity, the Gini coefficients for all countries increase and the measure of progressivity points in the same direction. Introducing an income tax at both the accumulation and decumulation stages lowers all Gini coefficient values; the already low progressivity of Germany’s pension scheme is essentially eliminated once heterogeneity in longevity is considered.
Table 1: Gini coefficients and index of progressivity before and after adjusting for heterogeneity
United Kingdom Germany United States
Gini Index Gini Index Gini Index
Gross earnings 28.85 26.70 33.19
Gross pension wealth 7.95 72.5 20.94 21.6 18.55 44.1 – adjusted 9.87 65.8 22.93 14.1 19.68 40.7
Net earnings 25.39 21.25 29.80
Net pension wealth
– unadjusted 6.51 74.4 19.25 9.4 17.43 41.5 – adjusted 8.55 66.3 21.24 0.1 18.56 37.7
Source: Whitehouse and Zaidi, (2008, Table IV. 2).
These model calculations based on the OECD pension model quite likely underestimate the regressive effects of heterogeneity, as only data for income tertiles are available. A more fine-grained analysis by income decile or even ventile would likely show much sharper results.
2.2. Heterogeneity in Longevity as an Implicit Tax/Subsidy Mechanism
To assess the redistributive/distortionary effects of heterogeneity in longevity, the model herein follows Ayuso et al. (2016) and characterizes differences in longevity by lifetime income levels as a tax/subsidy mechanism.
Consider individuals who have all accumulated the same savings amount at retirement to be converted into an annuity. Assume they retire at the same age and face the same interest rate, but have different life expectancies.
Let t (s) be the implicit tax (subsidy) rate. AK is the accumulation at retirement, α is the annuity rate, p is the pension, and PW is pension wealth. The subscript i denotes individual values and subscript a the average values of these variables.
The pension for each individual is the annuity rate applied to the identical wealth accumulation:
pi = α.AK (1)
Each individual’s PWi is different from everyone else’s to the extent that his/her life expectancy (LE)
differs. PW can be written in this simple form if the interest rate equals the growth rate (indexation) of pensions:
PWi = pi.LEi = α.AK.LEi (2)
With these elements, the tax (subsidy) rate is easily defined as the difference in pension wealth compared to the average:
t(s)i = (α.AK.LEi – α.AK.LEa) / α.K.LEa = LEi/ LEa – 1 (3)
with negative values representing the tax rate and positive values the subsidy rate.1
Equation (3) offers a simple assessment of the effect of heterogeneity in longevity on income distribution and incentives.
If life expectancy is positively correlated with lifetime income/accumulated contributions then individuals with above-average income receive a subsidy; those with below-average income have to pay a tax that is higher the stronger the correlation. This effect renders a neutral pension scheme pro-rich, and a pro-poor scheme less pro-poor or even pro-rich.
The implicit tax payment at the time of retirement has the same tax rate as taxing the contribution payment throughout active life (assuming no market imperfections), and the tax rate is higher the lower the contribution base/income. For the lowest income earners, the tax rate can be quite high and can thus affect decisions to join the formal labor market, with implications for the amount worked and contributions paid (i.e., the contribution density). And the tax/subsidy is also likely to affect retirement decisions.
To understand the potential scope of perverse redistribution of longevity heterogeneity and the incentive effects for individuals, the actual scope of implicit taxes and subsidies must be recognized.
2.3. The Scope of the Tax/Subsidy Component
In recent years more empirical evidence became available on the link between heterogeneity in longevity (particularly life expectancy at retirement) and key socioeconomic characteristics (particularly gender,
1 If the interest and indexation rates differ, the formula is slightly more complex, with results that differ from
education, and income). This subsection presents estimated tax/subsidy rates for measures of lifetime income from high-income countries around the world.
Table 2 presents the results for recent US data from a 2015 study by the National Academies of Sciences, Engineering, and Medicine. It translates the reported gaps in life expectancy between the third income quintile (assumed to be the pool average) and other income quintiles into tax/subsidy rates for actuarial annuities.
Table 2. Implicit tax and subsidy rates by lifetime income quintiles in the United States 1/
Male Quintile 1 Quintile 2 Quintile 3 Quintile 4 Quintile 5
Cohort 1930 -5.3 -3.2 0.0 +6.0 +12.8
Cohort 1960 -21.9 -15.3 0.0 +13.2 +16.2
Female Quintile 1 Quintile 2 Quintile 3 Quintile 4 Quintile 5
Cohort 1930 -0.3 -3.1 0.0 +3.1 +11.7
Cohort 1960 -12.7 -8.3 0.0 +2.2 +29.3
Note: 1/ Applies for fully actuarial annuity. – signals a tax, and + a subsidy rate. The estimates assume the pension
indexation rate is equal to the discount rate.
Source: Ayuso et al. (2016) based on National Academies of Sciences, Engineering, and Medicine (2015).
The estimated tax/subsidy rates for both men and women for the outer quintiles are indeed very high and dramatically increase between birth cohorts that are only 30 years apart. The tax rates reach 21.9 percent for men and 12.7 percent for women; the highest subsidy rate is for women, at a rate of 29.3 percent, while for men the highest subsidy rate is 16.2 percent.
Table 3. Implicit tax and subsidy rates by lifetime income differences in selected OECD countries1/
Low income High income
Male Australia -18.7 8.1 Canada -11.7 10.6 Chile -4.2 8.2 New Zealand -10.2 13.1 Germany* -12.3 6.8 Female Australia -11.0 13.8 Canada -6.6 6.2 Chile -6.5 4.3 New Zealand -5.5 8.7 Germany* -9.6 3.9
Note: 1/ Applies for fully actuarial annuity. – signals a tax, and + a subsidy rate. The estimates assume the pension
indexation rate is equal to the discount rate. Reference value: average population life expectancy observed in the same year that data for lifetime income are observed (Australia: 2009; Canada: 2006; Chile: 2013; New Zealand: 2001). *Reference value for Germany: average life expectancy between the second and third
quartiles (assumed to be the pool average according available information). Note that in this last case data refer to cohorts between 1991 and 1993.
Source: Authors’ calculations based on OECD (2016a; 2016b). For Germany, authors’ calculations according to
Table 3 provides estimates of implicit tax/subsidy rates for other OECD countries across the world. The estimated tax/subsidy rates for Australia in Table 3 come close to those for the United States in Table 2. For low-income men, the tax rate amounts to 18.7 percent; for high-income women, the subsidy rate amounts to 13.8 percent. Except in Chile, the scope of rates is still sizable in the other countries.
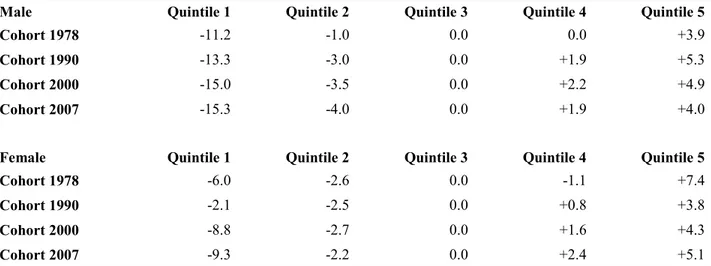
Table 4 presents the tax/subsidy rates for Swedish people aged 35 along different cohorts. Variable family income is divided into quintiles (as in Table 2, using the third quintile as the pool average). Although lower than in the United States, the estimated tax/subsidy rates for both men and women for the outer quintiles are again high and increase between birth cohorts. The increase is larger for men than for women. The tax rates for men reach 15.3 percent in the 2007 cohort (9.3 percent for women). The subsidy rate is higher for women in this cohort, at a rate of 5.1 percent, while for men the rate is 4.0 percent. An increase in the tax rates in the lowest quintile is observed for men along cohorts; a similar result is observed for women.
Table 4. Implicit tax and subsidy rates by lifetime income quintiles at age 35 in Sweeden1/
Male Quintile 1 Quintile 2 Quintile 3 Quintile 4 Quintile 5
Cohort 1978 -11.2 -1.0 0.0 0.0 +3.9
Cohort 1990 -13.3 -3.0 0.0 +1.9 +5.3
Cohort 2000 -15.0 -3.5 0.0 +2.2 +4.9
Cohort 2007 -15.3 -4.0 0.0 +1.9 +4.0
Female Quintile 1 Quintile 2 Quintile 3 Quintile 4 Quintile 5
Cohort 1978 -6.0 -2.6 0.0 -1.1 +7.4
Cohort 1990 -2.1 -2.5 0.0 +0.8 +3.8
Cohort 2000 -8.8 -2.7 0.0 +1.6 +4.3
Cohort 2007 -9.3 -2.2 0.0 +2.4 +5.1
Note: 1/ Applies for fully actuarial annuity. – signals a tax, and + a subsidy rate. The estimates assume the pension
indexation rate is equal to the discount rate.
Source: Authors’ calculations based on data in Hederos Eriksson, Jäntti, Lindahl, and Torssander (2014).
The presented data in all three tables do not dip deep into the tails of low and high income and thus underestimate the tax rates for the truly poor and truly rich. Lifetime decile or ventile data are likely to move the tax/subsidy rate estimates much higher into the two-digit level.
3. Implications for Pension Reform and Scheme Redesign
Socioeconomic differences in mortality and life expectancy have important implications for the analysis of pension schemes and for the redesign of pension policies. This is because these differences modify the redistributive features and overall progressivity of pension schemes and alter the incentives provided by the pension scheme for both labor supply and the timing of retirement and benefit uptake, counteracting the desired effect of recent pension reforms. This section discusses selective implications of systematic longevity heterogeneity for key areas of pension scheme design, and analyzes how this affects the reform objectives and reform directions of recent years.2
3.1. Perverting the Redistributive Objectives of Pension Schemes
One of the key functions of a pension system is to provide insurance against individual longevity risk though risk pooling. Pension schemes typically combine a proportional system of contributions with pension benefits (closely or loosely) linked to contributions, paid out as a collective lifetime annuity, typically from the time of retirement. Survival probabilities play a key role in computing initial (and, in some cases, subsequent) pension benefits (e.g., through annuity factors in defined contribution [DC] and non-financial defined contribution [NDC] schemes, and through demographic/sustainability factors in DB/points schemes). They also critically determine the time during which the pension will be paid, and thus the lifetime value of the flow of pension benefits. In many countries (e.g., Portugal, Denmark), they also define the qualifying conditions for pensions (e.g., by linking the statutory retirement age to life expectancy, by underlying the parameters that determine the bonus [penalties] for late [early] retirement). The defining characteristic of collective annuities is that they do not depend on an individual's survival probabilities but on the longevity prospects of the "average" (often national) plan participant. As a result, individuals with a high (low) life expectancy receive benefits for a longer (shorter) period compared to the average individual.
In the presence of systematic differences in the level and gradient of improvements in mortality and life expectancy over time across different socioeconomic groups, even if a pension scheme is actuarially fair for the population as a whole, it will be actuarially unfair to groups with systematically shorter life expectancy. In the presence of positive correlation between lifetime income and longevity, the risk-pooling mechanism thus implies an unintended redistribution from low-income groups to high-income groups, also reinforcing the redistribution in favor of women. The fact that the provision of insurance may have regressive distributional effects, and that a pension promise is worth more ex-ante to a rich person than to a poor one because of socioeconomic differences in longevity, challenges the design of pension schemes, which often include explicit redistributive features offering higher replacement rates for lower income earners. The extent to which longevity heterogeneity offsets the formal progressivity built into the retirement benefit program depends critically on the degree to which retirement benefits are linked to earnings when working.
The potential differences in the level and mortality improvements across socioeconomic groups pose a challenge for pension schemes to establish appropriate prospective life tables on which to base the pricing of annuities and the valuation of their liabilities. Such a task requires sufficiently large datasets and the use of complex statistical methodologies.
3.2. Counteracting the Objectives of Recent Reform Approaches: Strengthening Contributory
Principles
In recent decades, a major trend in pension reform in both public pay-as-you-go (PAYG) and privately funded schemes has been to strengthen the link between pension entitlements and the length and value of contributory records. This reduces the progressivity of the contribution-benefit formula, makes the redistributive process more transparent and explicit, and offers better labor market incentives. The strengthening of contributory principles was accomplished by: (i) shifting from DB to DC schemes; (ii) Increasing the contribution period from “best years” to average lifetime earnings; (iii) linking pension rules to life expectancy and introducing other automatic stabilizers; (iv) increasing the minimum pension eligibility age and equalizing pensionable ages between women and men; and (v) reforming early exit benefits.
Although the design of these reforms differs among countries, they share one common property: they are typically implemented in a uniform way, applied to all participants, and mostly focused on the accumulation stage of retirement schemes. In reality, this reform approach is incomplete in the sense that the tax/subsidy effect of heterogeneous life expectancy contradicts the objectives of a closer contribution-benefit link and actuarial fairness on a lifetime basis. By definition, in an actuarially fair pension no
ex-ante redistribution occurs either toward or away from the average individual. With systematic differences in life expectancy, actuarial fairness concepts cannot be defined across the population, but must be reformulated across homogeneous socioeconomic groups. If the measurement of mortality levels and improvements for subpopulations is politically sensitive or operationally unfeasible, the intragenerational redistributive effects of strengthening contributory principles are likely to aggravate the unintended transfers from low-income (and unskilled) groups to high-income groups since they enforce redistribution from short-lived to long-lived individuals. Moreover, they may work against the political goal of making redistribution in pension schemes explicit and transparent rather than implicit as in traditional DB PAYG schemes.3
Pension reforms that increase the number of years in the benefit formula uniformly for all workers are likely to redistribute in favor of high-skilled (and, generally, high-income) workers, who can more easily remain in the labor market and retire with full careers, whereas low-skilled workers often face late unemployment spells and retire early with significant penalties. On the other hand, pension reforms introducing a uniform automatic link between initial pension benefits and longevity (e.g., through the so-called sustainability factors) are likely to redistribute in favor of low-income workers, for whom the increase in pension entitlements motivated by a longer payout period is higher than the per-period benefit reduction. This is because for individuals with short lifespans, increases in pension entitlements motivated by a relative increase in the payout period are larger than the relative decrease in the per-period benefit level, while the opposite holds for individuals with longer lifespans.
3.3. Achieving Longer Working Lives in Face of Heterogeneity
Reforms seeking to appropriately increase effective retirement ages are one of the most promising options for adjusting to the financial imbalance in pension schemes caused by population aging. Pursuing longer working lives can be justified on the basis of both a macroeconomic setting and an individual welfare-enhancing perspective (Breyer & Hupfeld, 2009). With longevity heterogeneity, individuals of different socioeconomic groups retiring at the same age can expect very different lengths of retirement. Policies encouraging people to retire later, given the average increases in life expectancy, may therefore unevenly penalize individuals in lower socioeconomic groups who would work longer but not necessarily live longer. In the presence of longevity heterogeneity, uniform increases in the minimum pension eligibility age present significant challenges since they are likely to affect labor supply decisions, particularly of older individuals, in a non-uniform way. Although a broad range of factors can in principle affect the retirement decision of older workers,4 four main characteristics of old-age pension schemes are particularly important in this context: the standard and early ages of entitlement to pension benefits; the generosity of pension benefits; the implicit marginal tax attached to continued work; and the earnings-relatedness of a pension scheme.
Standard and early ages of entitlement to benefits indirectly affect the retirement decision of older workers via pension wealth levels and implicit taxes on continued work. Higher longevity partially induces people to retire later, with a bias toward high-productivity (income and education) groups that are better positioned to tackle technological change. This is because the true pension wealth and marginal pension accrual for high-income earners is higher than indicated by the formal benefit schedule. Uniform increases in the retirement age will have redistributive effects depending on individual differences in
3 However, it should be said that retirement income systems are not normally designed around actuarial fairness
concepts alone; they have other objectives, the most obvious of which is adequacy of retirement income.
4 For instance, welfare policies that distort retirement incentives; wealth effects associated with rising living
standards; increased demand for leisure; declining relative productivity; wages of low-skilled older workers in times of rapid technological change; and specific institutional arrangements that reduce the employment opportunities of the older unemployed, thereby discouraging them from participating in the labor market.
lifespan between heterogeneous groups. If the degree of longevity heterogeneity is high, a uniform increase in the statutory retirement age reduces the payout period of the high-skilled less, in relative terms, than that of the low-skilled. However, since an increase in longevity induces people to retire later (and, therefore to pay taxes for a longer period), the redistribution effects from high-income earners to low-income earners via the tax scheme may compensate for the bias toward high-low-income individuals.
The impact of increases in the standard and early entitlement age on the effective retirement age may not be uniform between high- and low-skilled individuals. This is because there are “customary” effects and because low-skilled workers tend to be more myopic or information-constrained; i.e., they do not appropriately assess actuarial incentives/disincentives to continue work embedded in pension schemes and thus tend to retire at the earliest age at which benefits become available. Differences in ex-ante life expectancy might even trigger strategic behavior, with low-income men retiring early and high-income women retiring late, leading to a polarization of retirement behavior. Perceived significant longevity heterogeneity is likely to increase the use of social transfer programs as de facto early retirement schemes by low-income groups, challenging the political goals of recent pension reforms aiming to prolong working careers.
Changes in pension wealth from working for an additional year may convey an implicit marginal tax or subsidy on continued work that is not uniformly distributed across groups with differential longevity if the pension scheme is “actuarially non-neutral.” For individuals already eligible for a pension, in pension schemes in which the receipt of a pension cannot be combined with earnings from work, remaining one year in the labor market implies foregoing one year of benefits and paying (full or reduced) social contributions. If the cost in terms of foregone pensions and extra contributions paid is not exactly offset by an increase in future pension benefits, the pension scheme carries an implicit tax on continued work. With longevity heterogeneity, making incentives for late retirement actuarially neutral requires accurate estimations of life expectancy by individual (or at least by socioeconomic group). In real-world pension schemes, these adjustments always rely on uniform actuarial adjustment factors based on some average life expectancy index. This makes adjustments likely to be worth more ex-ante to people with longer expected lifespans.
The earnings-relatedness of a pension scheme has important implications for the magnitude of the disincentive effects the pension scheme exerts on labor supply behavior. Generally speaking, the tighter pensions are linked to preretirement income, the smaller the tax component of the social security contribution rate. With perceived (and observed) significant differential mortality, the desired effects on labor supply of adopting DC schemes may not fully materialize, particularly among low-income workers.
4. Policy Options for Pension Design
This section explores the policy options that exist to redesign the pension scheme to address the effects of heterogeneity in longevity on pension schemes’ objectives and outcomes. Policy options are best selected if the pension scheme’s objectives are clear. It is suggested herein that the redesign of pension schemes should best eliminate or at least substantially reduce the distortions created by heterogeneity on individual labor supply and savings decisions. Any other distortions purposefully included in the scheme design (such as redistributive features toward lower-income groups) should remain and not be part of the attempted correction. For clarity of presentation, the latter considerations are ignored in the remainder of the paper. The starting position is a pension scheme with no redistributive objectives. This is best approximated by an underlying (financial or non-financial) DC scheme.
The scope of the tax/subsidy effects of heterogeneity in the pension scheme before and after the redesign is suggested as a measure of improvement. A successful redesign should be able to reduce the aggregate tax/subsidy effect by a large amount (best toward zero). A zero-close tax/subsidy effect will emerge if the annuity is calculated based on the actual or best estimate of individual life expectancy. This in itself offers an important indication in what direction the solution may be found.
A simply technical device in this direction consists in differentiated benefit calculations and the use of separate mortality/life expectancy data based on exogenous differences, particularly for gender and perhaps also for race, as these socioeconomic characteristics are difficult to change. Using gender-specific life expectancy values at retirement for the calculation of the lifetime annuity would go a very long way. As the data in Section 2 suggest, with such a differentiation a main share of aggregate tax/subsidy distortions can be significantly reduced (quite likely by a quarter or more in most countries). Such a differentiation may prove politically difficult, as recent legislation in various countries (such as those of the European Union) request unisex mortality data for annuity calculations to be applied. But it may become clear through the debate and analyses that the same arguments in favor of no differentiation with regard to gender may also support no differentiation when the connection between higher lifetime income and higher life expectancy is concerned.
A similar technical approach may be suggested to eliminate the effect of education, geographic location, or civil status and the created differentiation on longevity. The results in Section 2 suggest that the major tax/subsidy effects from such characteristics need corrections. However, technical difficulties may emerge when scheme (re-)design leads to endogenous differences in longevity and corrections lead to corresponding adjustments that have relevant micro- and macro-level side effects. For example, the current scheme design in various countries often favors the higher educated (by recognizing years in education as assimilated insurance periods, or by favoring steep wage/contribution profiles in last-salary schemes). Such structures may induce higher education and possibly higher heterogeneity. Including education characteristics in an approximation of individual life expectancy may reduce such heterogeneity but it also reduces the possible welfare-enhancing effects of more education on productivity.
Hence, what could be an operational benchmark for a policy redesign that is able to deliver a zero distortion (ignoring endogenous effects)? Zero distortion, measured as a tax/subsidy effect of zero, takes place if an actual or virtual accumulation at retirement translates into an annuity based on individual life expectancy at retirement. Thus any redesign that is able mimic such a design or comes close to this benchmark is an improvement. As individuals’ true life expectancy may never be known, approximations that may happen ex-ante or ex-post must be applied.
Conceptually, a benefit redesign may include ex-ante or ex post redistribution. Most of the interventions/scheme redesign will imply redistributions from one group of individuals to other groups. Such redistribution can take place ex-ante (i.e., before heterogeneity emerges) based on empirically tested hypotheses. For example, as lifetime income and life expectancy at retirement are closely related, higher period income can be used as the base for redistributive interventions. Redistribution can also happen once heterogeneity is established – for example, by differentiated estimated life expectancy at retirement and annuitization based on an empirically estimated lifetime income/life expectancy link.
The analysis so far has already indicated alternative stages at which an approximation can occur: accumulation, annuitization, and decumulation all offer opportunities for interventions/scheme redesign to counteract heterogeneity in longevity. The main possible key interventions are the following, although the list is far from complete.
Interventions at contribution payment stage, such as:
Differential social contribution rates by socioeconomic group: high (low) taxes for high- (low-) income groups
Application of a two-tier contribution scheme of individual and flat-rate allocation to individual accounts (in dc schemes)
Differential accrual rates by socioeconomic group: high (low) accruals for low- (high-) income groups
Application of different revalorization indexes (of contribution or benefits accounts) across income groups
Matching contributions for short-lived income groups Interventions at benefit calculation stage, such as:
Linkage of statutory retirement age with socioeconomic group-specific life expectancy Eligibility for retirement benefits based on years of contributions
Early (late) pension claiming bonus-malus adjustments indexed to life expectancy
Calculation of annuity factors for substandard mortality groups using an age-rating or age-shifting model
Calculation of annuity factors for substandard mortality groups, e.g., lifetime deciles Two-tier benefit schemes: lump sum plus earnings-related payments (in db schemes) Use of differential demographic sustainability factors by socioeconomic group Interventions at benefit disbursement stage, such as:
Indexation of annual benefits to cohort-specific life expectancy Use of differential pension indexation rules by socioeconomic group
Deferred annuities with a sharing of common and asymmetric longevity development between annuity calculation and disbursement
Mixed interventions that combine elements of all three stages.
Each of these proposals has conceptual, empirical, and operational advantages that are not discussed in detail in this paper. Instead, Section 5 elaborates on a subset of promising interventions.
5. Modelling Policy Options at Retirement, Accumulation, and Disbursement
Stage
This section presents and reviews alternative policy options that intervene at different stages of the contribution-benefit lifecycle. It starts with an intervention approach at retirement (when a lifetime accumulation is translated into a lifetime annuity); this is followed by an intervention at accumulation stage (when contributions are paid); and the section ends with an intervention at disbursement stage (when benefits are paid out). All interventions explored here are based on: (i) the observation that life expectancy at retirement is closely linked to lifetime contributions/income, and (ii) expectations that changes in that link can be periodically empirically updated for subsets of groups with exogenous longevity differences.
5.1. Intervention at Retirement Stage
Retirement is quite likely the most appropriate stage for intervention. First, it is limited to one point in time and thus offers the greatest transparency and hopefully credibility. Second, at this stage, the full lifetime accumulation for retirement purposes is known. For most people, this accumulation constitutes (together with housing) their most important asset across the lifecycle. Third, the personal characteristics that are likely to determine differences in longevity are pretty much known and should change little from retirement onward. Last and perhaps most important, if the link between lifetime income and longevity heterogeneity holds, it is at this moment that it can be measured and translated into an operational approach.
If (approximate) individual life expectancy at retirement could be determined, then the welfare-economic optimal approach would be to transform the retirement accumulation into a life annuity bi by applying an individualized annuity rate that takes into account estimated individual life expectancy LEi as
well as the expected indexation during retirement d and the assumed discount factor
r
. If d r= then the annuity rateα
boils down to 1/LE.(
, ,)
α
= = i i i i i AK b LE r d AK LE (4)where i denotes individual and AKi the accumulation at retirement.
With such an approach, the tax/subsidy associated with applying a unique annuity rate across all individuals would disappear, as the very reason for its existence would vanish. The challenge of the approach is thus to provide an estimate for LEi that comes as close as possible to the true value.5
The review of determinants of longevity heterogeneity in Alaminos and Ayuso (2015) signaled a large number of socioeconomic characteristics, of which some are essentially exogenous (such as gender and race), while others are endogenous (such as income and education but also geographic location and profession, with strong correlations between the first two particularly).
It would be ideal to empirically establish the relationship between life expectancy and lifetime income at retirement
Y
i and other relevant factors such as educationE
i (e.g., number of years in school or highest level of education achieved):(
, ,
)
ε
=
Σ +
i i i i
LE LE Y E
(5)Lifetime income
Y
i may go beyond retirement accumulation (i.e., accumulated contributions or similar);E
i is a vector of relevant education characteristics; and the other relevant socioeconomic characteristics,Σ
represent both common exogenous and endogenous components.A common approach to modelling differential mortality is to consider a relational model. Under this approach, mortality for people in poorer or better conditions than the average is expressed in relation to average (or standard) mortality. This allows the use of only with one life table (or mortality law), properly adjusted when substandard (also referred to as impaired lives) or preferred risks are dealt with. Standard mortality is indexed with (S) and a different (higher or lower) mortality with (D).6
A simple but popular differential mortality model, the frailty model, is used as an example. This model includes a mortality multiplier by which the actual mortality of each individual differs from a given standard mortality table. Formally, the one-year individual mortality rate for a given individual aged
x
with mortality multiplierλ
is given by:,
1
1
λ
λ
≤
=
S S D x x xq
q
q
otherwise
(6)5 For a proposal to include a linear estimate of the individual life expectancy/income position link into the German
point system, see Breyer and Hupfeld (2009). This results in a revised pension formula that is linear in contribution years but concave in individual point value(s), producing a replacement rate curvature similar to that of the United States and also close to that of the Swiss basic pillar.
6 For a discussion of the suitability of the modelling and forecasting of socioeconomic differences in mortality of
several multiple population extensions of the Lee-Carter model, and the application of a newly introduced relative model based on modelling mortality in socioeconomic subpopulations alongside mortality of a reference population, see Villegas and Haberman (2014).
with
x
∈
[ ]
0,
ω
, and whereω
denotes the highest attainable age of the standard mortality table (i.e., the age that cannot be survived according to that table). The parameterλ
, to be estimated, describes the relative life expectancy of an individual:o For 0< <
λ
1, D< Sx x
q q ; individuals belonging to this group have an above-average life expectancy
o For
λ
=1, D = Sx x
q q ; individuals have an average life expectancy o For 1<
λ
, D>
Sx x
q
q
; individuals have a below-average life expectancy.A particular implementation of equation (3), the so-called “numerical rating system,” is given by:
1
1
ρ
=
=
+
∑
k D S x x h hq
q
(7)where h is a set of risk factors (socioeconomic characteristics) and the rates
ρ
h lead (additively) to higher or lower mortality rates for the individual in relation to the standard values assumed by the chosen risk factors. Let1
1
+
=
+
d
v
r
denote the discount factor for some interest and indexation rates. Let tpx and t xqdenote, respectively, the t-year estimated survival and death probabilities of an individual aged
x
, with(
)
1 01
1
−1 λ
+ == −
= −
∏
t−
D D S t x t x x j jq
p
q
Assuming the pension scheme pays an immediate lifelong annuity at retirement, for a given (real or notional) accumulated capital AKx i, the annual benefit amount would then be:
(
)
, , , 1 0 0 0 1 ω ων
ν
λ
− − − + = = = = = −∑
∑ ∏
x i x i x i x x t t D t S t x x j t t j AK AK b p q (8)Data for such estimation are available at country level through social security administrations that offer either actual lifetime contribution accumulations (under NDC schemes) or approximations (e.g., indexed contributions of last 25 years or more under an NDB scheme) for retirement cohorts of different age and projected or actual mortality rates/life expectancy. Using realized longevity data leads to outdated estimates by the time they become available; using projected longevity data risks introducing significant biases if the expected trend accelerates or reverses. Recent estimates with the latter approach exist for the United States (National Academies of Sciences, Engineering, and Medicine 2015) but seemingly not yet for Europe.
5.2. Intervention at Accumulation Stage
Intervention at the accumulation stage happens at a time when information about an individual is only partially known and when proxies such as income and education are even less reliable as they are still changing. However, from a political economy point of view, a smaller intervention over a longer period may be more palatable than a large one-time intervention. Yet to be politically sustainable the intervention needs to be simple and transparent and thus less prone to political manipulation.
One approach is to apply an estimate of the projected lifetime income based on the period income and calculate and apply the resulting contribution rate required to achieve a predetermined replacement rate at retirement. Highly variable period income across the active lifecycle would lead to corresponding highly variable individual contribution rates. This approach may be possible but would perhaps be irritating and politically infeasible.
The approach proposed here is to mimic the income relationship with longevity through a two-tier contribution allocation structure in which a total contribution rate tc% is split into a social component with a contribution rate of sc% and an individual component of rate nc%. The social component sc% of the average contribution base ya is allocated to each individual account in a lump-sum manner (i.e., sc.ya),
while the individual component nc% is allocated in the traditional way (i.e., nc.y
i). As a result, at
retirement the individual receives a pension benefit that consists of two components:
• A flat-rate benefit that is proportional to the length of activity, social contribution rate, and average contribution base, and
• A contribution-based benefit that is proportional to length of activity, individual contribution rate, and individual contribution base.
Both components are indexed with the same sustainable rate of return and are inversely proportional to life expectancy at retirement.
To derive the contribution split for a cohort, it is proposed to minimize the squared distance between the pension level di that results from applying to the accumulation under a unique contribution rate the
best estimate for individual life expectancy LEi and the pension level bi that results from applying to the
accumulation with the two tier contribution rates the average life expectancy for the cohort LEa :
(9)
with
di = AK(tc)i / LEi = tc .Yi / LE(Yi) (9a)
bi = AK(sc+nc)i / LEa = (sc.Ya+nc.Yi)/ LEa (9b)
(9c) LE(Yi) =f(LEa, Yi/Ya, …);f’ > 0, f’’ >< 0 (9d) In this simplified setting the pension base is the lifetime income Y that results from the aggregated period income of individual yi and equals the contribution base. This assumes perfect markets; hence, only
lifetime income counts, not how it is distributed over the individual’s lifecycle. The budget constraint assures that the expenditure for the individualized pension benefits di fits the revenues from the split
contribution rate.
To gain intuition about the magnitude of the contribution split and its capacity to compensate for unequal life expectancy, which is linked with lifetime income, the analysis makes use of the tax/subsidy structure of both the heterogeneous life expectancy and the split contribution rate.
Based on Ayuso et al. (2016), Section 2 demonstrated that applying a single average cohort life expectancy value to calculate the annuity when the individual values are actually different amounts to a tax or subsidy, depending on the individual’s life expectancy value compared to the average. If the interest rate equals the growth rate (indexation) of pensions, this boils equation (3) down to:
t(s)i = LEi/ LEa - 1 (3a) with negative values representing the tax rate and positive values the subsidy rate.
Similarly, applying a two-tier contribution schedule to individuals with equal life expectancy but different lifetime incomes measured at retirement amounts to a tax for those with above-average income and a subsidy for those with below-average income:
t(s)i = ((tc – nc)/tc)*(1 – Ya/Yi) (10) with negative values again representing the tax rate and positive values the subsidy rate.
Equating the tax/subsidy rates in (3a) with the tax/subsidy rates of (10) provides the link for how the relationship between individual life expectancy and individual lifetime income needs to be structured so that any deviation in one is compensated by the other and no tax/subsidy element remains.
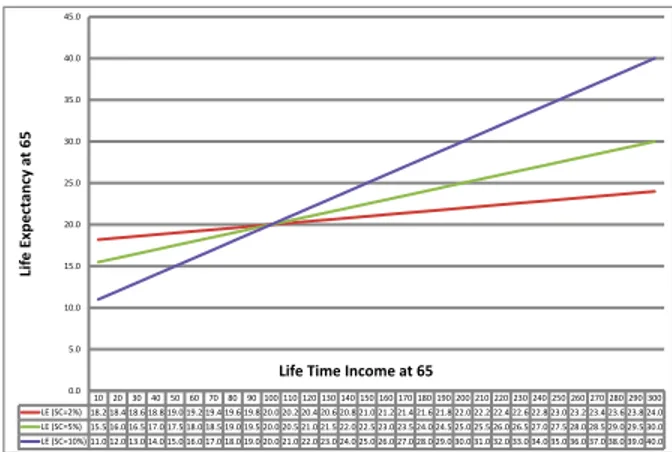
LEi = LEa [1 – (tc – nc)/tc) (1 – Ya/Yi)] (11) Figure 1 presents this linear link graphically for a selection of social contribution rates (sc = tc – nc) of 2, 5, and 10 percentage points und a total contribution rate of 20 percent, normalized values of lifetime income between 10 and 300, in steps of 10 (with an average of 100), and an assumed average life expectancy of 20 years at the assumed retirement age at 65.
10 20 30 40 50 60 70 80 90 100 110 120 130 140 150 160 170 180 190 200 210 220 230 240 250 260 270 280 290 300 LE (SC=2%) 18.2 18.4 18.6 18.8 19.0 19.2 19.4 19.6 19.8 20.0 20.2 20.4 20.6 20.8 21.0 21.2 21.4 21.6 21.8 22.0 22.2 22.4 22.6 22.8 23.0 23.2 23.4 23.6 23.8 24.0 LE (SC=5%) 15.5 16.0 16.5 17.0 17.5 18.0 18.5 19.0 19.5 20.0 20.5 21.0 21.5 22.0 22.5 23.0 23.5 24.0 24.5 25.0 25.5 26.0 26.5 27.0 27.5 28.0 28.5 29.0 29.5 30.0 LE (SC=10%) 11.0 12.0 13.0 14.0 15.0 16.0 17.0 18.0 19.0 20.0 21.0 22.0 23.0 24.0 25.0 26.0 27.0 28.0 29.0 30.0 31.0 32.0 33.0 34.0 35.0 36.0 37.0 38.0 39.0 40.0 0.0 5.0 10.0 15.0 20.0 25.0 30.0 35.0 40.0 45.0 Lif e E xp ec ta nc y at 65
Life Time Income at 65
Figure 1. A Two-tier contribution scheme and the tax/subsidy neutral link between life expectancy and life time income at 65
Source: Authors’ elaborations
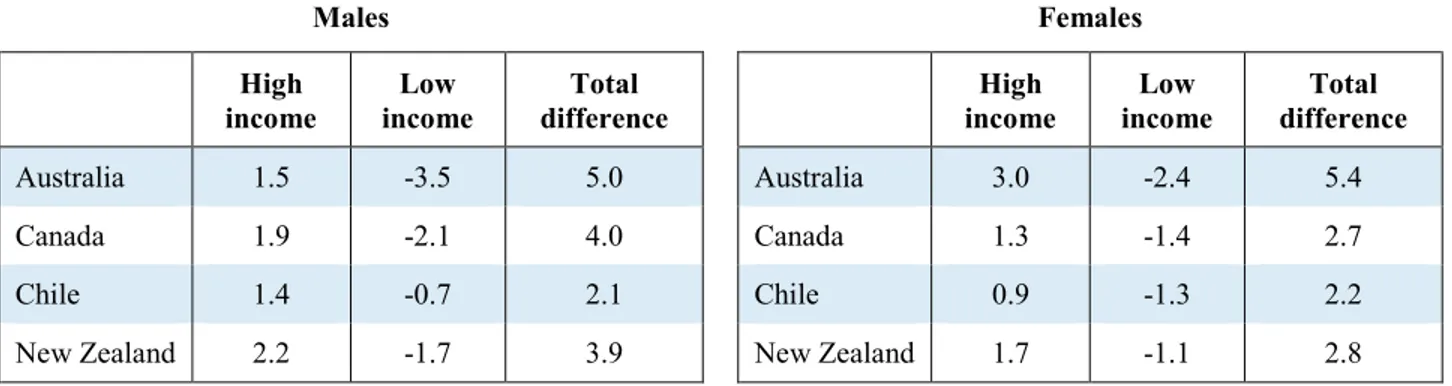
The selected numerical example suggests that the investigated contribution split for the social contribution rate would go a long way to comprise the empirically found positive link between life expectancy and lifetime income Ayuso et al. (2016). For example, a social contribution amounting to a quarter of the total contribution rate (in this numerical example, 5 out of 20 percentage points) would accommodate a lower life expectancy of 2.5 years for somebody who has only 50 percent of the average lifetime income or a 2.5 years higher life expectancy for somebody who has double the average lifetime income – i.e., a difference in life expectancy of five years at age 65 between roughly the 8th and 2nd lifetime income decile. For many countries, the total difference in life expectancy is typically smaller and thus the needed contribution split is also reduced (Table 5).
Table 5. Difference in Life Expectancy at Age 65 by Income Group, Relative to the Population Average
Males Females
income High income Low difference Total income High income Low difference Total
Australia 1.5 -3.5 5.0 Australia 3.0 -2.4 5.4 Canada 1.9 -2.1 4.0 Canada 1.3 -1.4 2.7 Chile 1.4 -0.7 2.1 Chile 0.9 -1.3 2.2 New Zealand 2.2 -1.7 3.9 New Zealand 1.7 -1.1 2.8
Note: Australian figures shown for age 60.
Source: OECD (2016a)
The two-tier contributory pension scheme’s ability to compensate for heterogeneity in longevity also emerges from estimates for Korea, which has such a structure (Han & Lee, 2012). Measures of implicit rates of return for low-, middle-, and high-income groups exhibit a progressive benefit structure when homogenous mortality rates are applied. When differentiated mortality rates that are lower for high-income groups are applied, the implicit rates of return show a much less progressive structure that is, however, not overturned.
If confirmed by more data and an application of the estimation process proposed under Equations (9a-d), the approach would be fully operational. The application could periodically (e.g., every 10 years) re-estimate the contribution split, with rules for triggers and, perhaps, additional ex-post adjustments during the disbursement stage.
5.3. Intervention at Disbursement Stage
In view of the scope of heterogeneity in longevity and its translation into taxes and subsidy equivalents until first disbursement, an intervention after the annuity is determined may need to be limited to corrections for longevity differentials that happen after retirement. Doing otherwise would imply major nominal benefit reductions for some and benefit increases for others. Nominal reductions in benefits for retirees are politically close to impossible as events in recent years demonstrated (such as in Sweden). And from a design point of view, a potential benefit reduction creates a higher welfare loss than equivalent increases as the effects are not symmetric for the elderly, given their increasingly limited risk-management instruments available to react to such income shocks.
An intervention after annuitization may be triggered by two kinds of changes in longevity:
• Homogenous shocks that affect pension cohorts in a similar manner, as they leave heterogeneity among cohorts essentially unchanged (perhaps through a medical breakthrough). In this case the intervention may consist of a risk-sharing mechanism across generations.
• Asymmetric developments that decrease or increase heterogeneity, with the latter perhaps more relevant for policy concerns and interventions.
Evidence on the development of mortality at different ages for different socioeconomic groups has a long tradition in demographic and medical sciences that has expanded to many other disciplines (Rogers & Crimmins, 2011). Summing up the literature and empirical evidence suggests that all outcomes are possible depending on the socioeconomic dimension investigated yet the effects are not large. For example, Marmot and Shipley (1996) study of British civil servants of different grades suggested that
socioeconomic differences in mortality persist beyond retirement age and increase in magnitude with age. Social differentials in mortality based on an occupational status measure seem to decrease to a greater degree after retirement than those based on a non-work measure. Hoffmann’s (2005) work based on the US Health and Retirement Study suggested that socioeconomic mortality differences are stable across age but clearly decline with decreasing health. The first finding that health rather than age is the equalizer combined with the second finding of unequally distributed health leads to the conclusion that in old age, the impact of socioeconomic status is transferred to health and is stable across ages. These and other findings suggest that there is limited need for additional corrections in heterogeneity of longevity after retirement.
If there were such a need for intervention, one approach – at least for second and third pension pillars – could be to use deferred annuities: that is, the conclusion of an annuity contract at retirement (e.g., at age 65) and using differentiated/proxied life expectancies at this age but with a delayed beginning of the disbursement (e.g., at age 75 or 80). At this age of disbursement, a reassessment of heterogeneity in life expectancy is undertaken and some risk sharing of the changes in life expectancy introduced. This would decrease annuities for those who had gained and increase annuities for those who had relatively lost. As the adjustment happens before the annuity is disbursed the first time and prior alerts can be provided (e.g., starting five years before), some time for adjustment is offered. Whether this is politically feasible – even for minor adjustments – needs to be explored.
6. Conclusions and Next Steps
This paper argues and demonstrates that heterogeneity in longevity by lifetime income is high and often rising; that it translates into an implicit tax/subsidy mechanism with rates in some countries reaching 20 percent and above; that such rates risk perverting redistributive objectives of pension schemes and distorting individual lifecycle labor supply and savings decisions; and that such perversions and distortions risk invalidating or at least diminishing recent reform approaches, particularly those moving to a closer contribution-benefit link and increasing the retirement age.
Given these challenges it seems important to develop mechanisms that neutralize or at least significantly reduce the effect of heterogeneity in longevity through changes in pension design. Such interventions can happen at the level of contribution payment, annuity calculation, and benefit disbursement. If the tax/subsidy mechanism is the correct assessment of the implications of longevity heterogeneity on a pension scheme, then the best intervention is at the level of annuity calculation, followed by interventions at the contribution payment and lastly at benefit disbursement.
The first proposed corrective intervention takes place at the time of annuity calculation and approximates individual life expectancy when calculating the individual annuity value. Differentiation by gender would go a long way, while differentiation by lifetime income level/accumulated contributions could build on data by social security institutions, as recently done by the US National Academies of Sciences, Engineering, and Medicine. The better the approximation and differentiation between individuals, the lower the implicit tax or subsidy. However, the stronger the proposed differentiation, the higher a political resistance against such an approach will be or, if implemented, the incentives for arbitrage games.
A second approach is to correct at the level of contribution collection and to implement a two-tier contribution structure that splits the contribution rate into an individual and a social component, with the latter receiving benefits proportional to the average contribution base. At retirement this is equivalent to offering individuals a benefit that consists of an individualized benefit and a lump-sum benefit. Asking what life expectancy and lifetime income relationship must exist to neutralize the tax/subsidy mechanism for a chosen individual/total contribution rate relation allows identifying the life expectancy/lifetime income link. Empirical data on the latter indicate that for most countries a social contribution rate of 2 to 5 percent out of a total contribution rate of 20 percent would be sufficient.
Interventions after retirement seem justified only if they address changes in heterogeneity that occur after retirement. Empirical studies suggest that heterogeneity after retirement remains broadly constant and changes are linked less to income but instead to changes in individuals’ health status.
These promising preliminary results require deeper modelling and empirical exploration. The paper offers suggestions in this direction but to do so requires access to copious individual-level administrative data.
Acknowledgements
An earlier version of the paper was prepared for and discussed at the Forum of Experts of the BBVA Pension Institute, Madrid, of which the author is a member; it was also presented at the University of New South Wales (November 2016) and the World Bank (December 2016). We would like to thank the participants for their engaging discussion and useful comments and suggestions. All remaining errors are our own doing. M. Ayuso thanks the Spanish Ministry of Economy and Competitiveness and the ERDF under grant ECO2015-66314-R.
References
[1] Alaminos, E., & Ayuso, M. (2015). Una estimación actuarial del coste individual de las pensiones de jubilación and viudedad: Concurrencia de pensiones del Sistema de la Seguridad Social español [An actuarial estimation of the individual cost of retirement and widowhood pension: An application to the Spanish case]. Estudios de Economía Aplicada, 33(3), 817-838.
[2] Ayuso, M., Bravo, J. M., & Holzmann, R. (2016). Sobre la heterogeneidad de la longevidad entre los distintos grupos económicos: ámbito de aplicación, tendencias e implicaciones para los planes de pensiones vinculados a los ingresos [On the heterogeneity of longevity among socio-economic groups: Scope, trends and implications for earnings-related pension programs] (IZA Discussion Paper No.10060). Bonn, Germany: IZA. Retrieved from http://ftp.iza.org/dp10060.pdf.
[3] Boumezoued, A., Karoui, N. E., & Loisel, S. (2017). Measuring mortality heterogeneity with multi-state models and interval-censored data. Insurance: Mathematics and Economics, 72, 67-82. https://doi.org/10.1016/j.insmatheco.2016.09.014
[4] Breyer, F., & Hupfeld, S. (2009). Fairness of public pensions and old-age poverty. FinanzArchiv/Public Finance Analysis, 65(3), 358-380.
[5] Brown, R. L., & McDaid, J. (2003). Factors affecting retirement mortality. North American Actuarial Journal, 7(2), 24-43. http://dx.doi.org/10.1080/10920277.2003.10596083
[6] Chang, M.-H., Molla, M. T., Truman, B. I., Athar, H., Moonesinghe, R., & Yoon, P. W. (2015). Differences in healthy life expectancy for the US population by sex, race/ethnicity and geographic region: 2008. Journal of Public Health, 37(3), 470-479. https://doi.org/10.1093/pubmed/fdu059 [7] Davidoff, T., Brown, J. R., & Diamond, P. A. (2005). Annuities and individual welfare. American
Economic Review, 95(5), 1573-1590. http://dx.doi.org/10.1257/000282805775014281
[8] Eurostat. (2015). Mortality and life expectancy statistics. Eurostat Statistics Explained. Retrieved from http://ec.europa.eu/eurostat/statistics-explained/index.php/Mortality_and_life_expectancy_statistics. [9] Fiske, S.T., Kaplan, R. M., Spittel, M. L., & Zeno, T. L. (2014). Educational attainment and life
expectancy. Policy Insights from the Behavioral and Brain Sciences, 1(1), 189-194. http://dx.doi.org/10.1177/2372732214549754
[10] Fong, J. H. (2015). Beyond age and sex: Enhancing annuity pricing. The Geneva Risk and Insurance Review, 40(2), 133-170. http://dx.doi.org/10.1057/grir.2014.12