(http://linkinghub.elsevier.com/retrieve/pii/S0305440307000064)
DOI: 10.1016/j.jas.2006.12.017 (http://dx.doi.org/10.1016/j.jas.2006.12.017)
A CONTRIBUTION TO THE STUDY OF POST-DEPOSITIONAL
ALTERATIONS OF POTTERY USING TL DATING ANALYSIS
Nikolaos Zacharias
a, Alexander Schwedt
b, Jaume Buxeda i Garrigós
c,
Christodoulos T. Michael
a, Hans Mommsen
b, Vasilis Kilikoglou
aA contribution to the study of post-depositional alterations of pottery
using TL dating analysis
Nikolaos Zacharias
a, Alexander Schwedt
b, Jaume Buxeda i Garrigós
c,
Christodoulos T. Michael
a, Hans Mommsen
b, Vasilis Kilikoglou
aa
Laboratory of Archaeometry, Institute of Materials Science, NCSR Demokritos, 15 310 Aghia Paraskevi, Attiki, Greece
b
Gruppe Archäometrie, Institut für Strahlen- und Kernphysik, Universität Bonn, Nussallee 14-16, D 53115 Bonn, Germany
c
ERAUB, Dept. de Prehistòria, Història Antiga i Arqueologia,
Universitat de Barcelona, C/ de Baldiri Reixac, s/n, E-08028 Barcelona, Catalonia, Spain Abstract
In luminescence dating, the potassium concentration significantly contributes to the dose rate value in the age estimation. Within this study, fine-grain thermoluminescence dating has been applied on sherds of calcareous pottery of known age, excavated at a Roman site in Mallorca, Spain. For those of the samples that showed signs of severe potassium leaching, according to chemical and mineralogical examination, the thermoluminescence analysis provided overestimated dates. By using the known archaeological age of the samples, a corrected dose rate value can be estimated which provides the potassium concentration averaged for the burial period. Finally, a step-like model can then be used to estimate the fraction of the burial period after which most of the alteration effects took place.
Keywords: Luminescence, Thermoluminescence, Alteration, Age overestimation,
K-leaching, Over-firing, Archaeological pottery
1. Introduction
A number of techniques are included under the term of luminescence dating, which mainly refer to the phenomena of thermoluminescence (TL; stimulated by heat) and optically stimulated luminescence (OSL; stimulated by light). Luminescence dating requires solution of the equation Age = De /
.
D , where for the equivalent dose estimation (De) the development of a variety of laboratory procedures [15] allow for errors that typically range between 3-8%. Unlikely, for the dose rate estimations (D ),
.
the many parameters incorporated [5] and the potential disturbances they introduce, like possible inhomogeneous distribution of radioactive nuclides on both a macroscopic and microscopic level [6], variations of water context and disequilibria in the U and Th decay chains [2,10], constrain the resulting dates at approximately ±10% (1σ).Early mineralogical studies [12,11] on high/over-fired calcareous archaeological pottery samples indicated significant variations in alkali metal concentrations due to environmental alterations during burial. For especially the K concentration, recent studies [4] propose a leaching process from the glassy phase, while Zacharias et al. [16] examined this effect on Greek Bronze Age pottery and the resulting implications in luminescence dating studies have been reported and discussed therein.
In the present study, archaeological pottery recovered from the excavations of the Roman kiln site of Sa Mesquida (Mallorca, Spain), labelled further on as MCF pottery and dated back to the 1st century AD, was used to perform TL measurements. Neutron Activation Analysis (NAA) provided the concentrations of bulk and profile samples. X-ray Diffractometry (XRD) showed that a variation in the alkali element concentrations is connected to the crystallization of the zeolite analcime (cf. below).
TL measurements performed on sherds not affected by this alteration provided an estimation of the value of the environmental radiation dose, which was then employed for the TL dating of the affected sherds. The straight-forward application of the TL methodology, using the K concentrations measured today, without considering K-leaching effects, resulted in overestimated TL dates for the affected samples.
Using the archaeological age of the sherds, and assuming for a relatively fast alteration process in terms of the burial time, it was then possible to provide an estimation of a time span after which the alteration occurred.
2. Chemical and mineralogical characterization of the MCF pottery group
In a first study [14], the chemical reference group of the Sa Mesquida kiln site was established on the basis of X-ray Fluorescence (XRF) bulk analysis. The study revealed unexpected large spreads in the K, Na and Rb content and the existence of several ware types fired at different equivalent firing temperatures (EFT), according to the mineral phases identified by XRD. These results point to the existence of an alteration of the glassy phase for those high/over-fired sherds, together with the crystallization of the Na-zeolite analcime (Na[AlSi2O6]·6 H2O), a secondary mineral phase which must have formed sometime after firing because of its high water content.
In Schwedt et al. [13], seven samples, representing unaffected individuals, were selected in order to examine for a possible formation of concentration profiles. The samples were cut along their cross section to produce slices of ca. 1mm thickness, and the slices were ground in an agate mortar. The resulting powder samples were then analysed by NAA.
For the present study, uncut fragments of five of the previous seven samples were used for TL measurements to provide additional information of the alteration effects in terms of chronological criteria. In three of them (MCF34, MCF38 and MCF59), XRD showed the presence of analcime, while for the other two (MCF29 and MCF35) this phase was not detected. Table 1 shows the mean values of the corresponding NAA data. As can be seen, most of the measured elements are very homogeneously distributed in all analysed slices pointing to all sherds have being produced from an initially very homogeneous high calcareous paste. It must be taken into consideration that As, Ba and Ca are usually scattered within pottery, and Ni, Ti and Zr can only be measured with high statistical uncertainties at the Bonn NAA facilities [9].
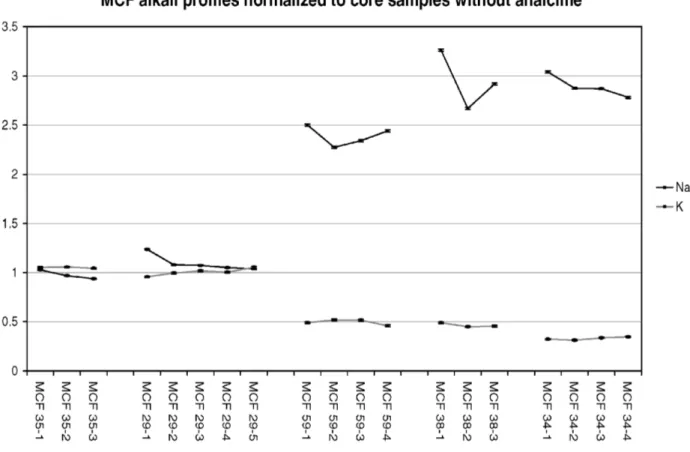
The thermodiffractometric experiments [14] operated with a heating rate of 100 °C/h and at maximum temperatures kept for 1 h, yielded different EFT for the samples: 850-950°C (MCF35), 950-1000°C (MCF29), 1000-1050°C (MCF38 and MCF59) and 1050-1100°C (MCF34). Thus, obviously, the alteration of the glassy phase (leaching of K), and the analcime crystallization (enrichment of Na), is related to the high-/over-fired estimated EFT in such calcareous clays. Figure 1 clearly shows that the more analcime has crystallized, the lower the K and the higher the Na concentration found. Moreover, the measured concentration profiles show that this
chemical alteration takes place quite homogeneously across the whole sherd respectively (Fig 2). In conclusion, there is a significant K-leaching for the high-/over-fired samples, most likely due to the alteration of the extensively developed glassy phase. Therefore, the today measured K concentration does not represent the original value considered as the time-averaged K concentration usually employed in luminescence dating calculations.
3. Thermoluminescence and dose rate measurements
For the TL measurements an external layer of 0.3-0.4 cm was removed from the five fragments with the use of an electric drill rotating at low speed to avoid tribo-TL effects. The remaining assays were gently crushed in a vice and the coarse product was left to settle in an ethyl alcohol column. The 2-8 µm fine grain fraction was then obtained for the preparation of several aliquots (ca. 20) from each sample.
TL glows were recorded with the use of a Littlemore TL 711 set, equipped with an EMI 9635QA photomultiplier and a Corning 7-59 blue pass filter. Measurements ran at a heating rate of 10oC s-1 and the irradiations administered with a 60
Co gamma-source providing 1.73 Gy min-1 and an 241Am alphsource for the a-value estimation.
The TL suitability of the samples was checked for plateau by performing initial test measurements. Using laboratory irradiated aliquots stored for three months the samples were checked against possible fading effects.
For the estimation of the equivalent dose (De) an additive dose multiple-aliquot procedure [7] (foil technique) was used. Using the normalisation procedure of the foil technique, after the 1st TL read out, each aliquot is irradiated with the same test dose and the 2nd TL signal is recorded. Finally, the ratios of the natural, or natural plus a laboratory dose (1st TL), to the TL intensity of the 2nd glow for each aliquot is then used to produce the growth curve for De estimation.
Although NAA provided the U and Th concentrations, PIPS thick source alpha-counting technique was used to examine for possible disequilibrium. Following the Demokritos proposed analysis [8], for which an updated laboratory version enables an illustrative presentation of equilibrium states, no detectable deviation from equilibrium was found in the examined samples. In Table 2 the concentration values for K, Na, Rb, U and Th, resulted from the bulk NAA analysis, are given. By employing the conversion factors of Adamiec and Aitken [1], the alpha- and beta-dose rate values of the samples were estimated.
Since the original water content of the samples was not preserved, the samples were dried at 50oC for two hours and then placed in distilled water for overnight. The saturation content was then estimated by the ratio (wet weight – dry weight)/(dry weight). For the fractional uptake of water the value of 0.50±0.25 [2], was used.
Although the samples were provided without an estimation of the environmental dose value it was indirectly calculated; archaeologically it was well established that the age is 1.95 (± 0.05) ka BP (M.A. Cau Ontiveros and M. Orfila Pons, personal communication), thus the measurement of the equivalent dose allowed, after the subtraction of the alpha- and beta-contribution, the estimation of the environmental dose (Figure 3, Step 1 to 3). In that way, the TL measurement of the unaffected samples MCF29 and MCF35 enabled the estimation of an average environmental dose of 0.73 ± 0.35 Gy ka-1 (Table 3a).
All the studied sherds were recovered from the same excavation point representing one stratigraphical horizon in terms of macroscopical level thus similar
environmental conditions can be assumed for all the samples. Therefore, the estimated average value for the environmental dose resulted from the TL study of the unaffected ones could safely be used for the TL dating procedure of the affected individuals MCF34, MCF38 and MCF59 (Figure 3, Step 4). For the presented altered samples, TL dating resulted in overestimated absolute ages (Table 3a) although within 1σ error bars. In Table 3a the mean calculated TL age is given to demonstrate the average value that would normally be given if TL dating service were requested. This value, which is ca. 18% overestimated, reinforces the need of additional mineralogical analysis when luminescence dating is attempted on pottery that show signs of over-firing.
4. Use of the TL analysis to model the alteration period
In Zacharias et al. [16], it was demonstrated that the effect of K-leaching on the TL age becomes important when alteration takes place during later phases of the burial time. Additionally, in Schwedt et al. (in press), the non- existence of K content profiles ensures the hypothesis that leaching happened as a relatively fast process at some point during burial. This assumption seems to be verified also by considering the occurrence of an important K-leaching (ca. three quarters out of the original mean of 4.63% of K2O) in a 17th century AD majolica assemblage [3].
Therefore, we could consider the burial period approximately as the sum of two parts (t1: time before the alteration, t2=Age-t1: time after the alteration), the dose rate (D ) of which is differing only at their K-doses (t1: Kini , t2: Kfin) Thus, the
.
luminescence equation Age = De /.
D can be formulated as in (1)
Age D = t1
.
D.
ini + t2D.
fin,= t1D.
ini + (Age – t1) D.
fin, (1) where D.
ini refers to the dose rate having the contribution from an initial K concentration and D.
fin with the contribution from the measured today K concentration. Following the steps 5 and 6 of Figure 3, we estimate the average K concentration (Kave) for every affected sample, which accounts for the measured dose considering the archaeological age. This is provided by calculating the total dose rate and subtracting the contributions of the environmental dose and α- and β-doses coming from U, and Th, which are assumed as constant for the whole burial period. This assumption was additionally supported from the equilibrium state found for the decay series of both radioisotopes. Therefore, changes in the dose rates given in equation (1) can be given as changes in K concentrations. Since the K contribution of the two parts must be equal to that of the average K, equation (1) can be rewritten as followsAge Kave= t1Kini + t2Kfin= = t1Kini + (Age – t1) Kfin Finally, the time t1 could be given in the form of equation (2)
Age t ) K (K ) K K ( fin ini fin ave 1 − − = (2)
The initial concentration Kini corresponds in equation (2) to the average K concentration measured from the examined unaffected MCF samples, which is 2.35±0.05%. This value is used under the assumption of an initial very similar chemical composition for the whole group (in agreement with the NAA data of the
other trace elements, cf. Tab. 1). The final concentration Kfin corresponds to the actually determined content for each one of the affected samples.
Thus, by using equation (2), we can approximately date the alteration period for each one of the affected sherds (Table 3b) pointing to an alteration, which basically occurred at ca. 250 – 1000 years BP.
5. Conclusions
The studied Roman pottery that was affected by the post-burial alteration of the glassy phase, experience a leaching of ca. 50% of their original K content, which provided underestimated dose rate values. Although the resulted overestimated TL ages for the altered samples overlap with the archaeological age when considering the lower values within the 1σ error bars, the effect is significant when conventional luminescence service is performed.
Vice versa, a deviation in the TL age can also be used to draw conclusions to the alteration process itself, since the archaeological dose recorded in the sample is the only possibility to determine the time-averaged K concentration in the sample. This can be used as boundary condition to model the alteration process itself: Considering e.g. a step-like model, the total burial period can be effectively considered as two parts, before and after a ‘fast’ alteration process of the glassy phase, the estimation of an average K concentration for the affected samples can be used to approximate the time during which the alteration took place.
This possibility to ‘date the alteration’ allows correlating this time of a strong leaching with major changes in the burial environment of the site that is of significant research interest and should be further investigated.
Acknowledgements
The first stages of the presented work form part of the GEOPRO Research Network funded by DGXII of the European Commission (Contract number ERBFMRX-CT98-0165). The authors would like to thank P. Bakandrea for the preparation of the TL samples and assisting with the experimental work and the staff of the research reactor in Geesthacht, Germany, irradiating the samples for NAA. The authors are indebted to M.A. Cau Ontiveros and M. Orfila Pons, directors of the excavation of Sa Mesquida, for enabling the study and providing the samples.
References
[1] G. Adamiec, M.J. Aitken, Dose-rate conversion factors: update, Ancient TL 16 (1998) 37-50.
[2] M.J. Aitken, Thermoluminecence dating, Academic Press, London, 1985.
[3] J. Buxeda i Garrigós, M. Madrid Fernández, J.M. Gurt i Esparraguera, Provinença i tecnologia de les ceràmiques de „Pisa“ i d' „Obra de Manises“ del dipòsit de la Plaça Gran de Mataró, in: J. A. Cerdà i Mellado (Ed.): La ceràmica Catalana del segle XVII trobada a la Plaça Gran (Mataró), Associació Catalana de ceràmica decorada i terrissa, Barcelona, 2001, pp.156 – 170.
[4] J. Buxeda i Garrigós, H. Mommsen, A. Tsolakidou, Alteration of Na-, K-, and Rb-concentrations in Mycenaean pottery and a proposed explanation using X-Ray Diffraction, Archaeometry 44 (2002) 187–198.
[5] R.B. Galloway, Luminescence dating: Limitations to accuracy attainable, Journal of Radioanalytical and Nuclear Chemistry 247.3 (2001) 679-683.
[6] R. Kalchgruber, M. Fuchs, A.S. Murray, G.A. Wagner, Evaluating dose-rate distributions in natural sediments using α-Al2O3: C grains, Radiation Measurements 37, (2003) 293-297.
[7] C.T. Michael, N. Zacharias, D. Dimotikali, Y. Maniatis, A new technique (foil technique) for measuring the natural dose in TL dating and its application in the dating of a mortar containing ceramic grains, Ancient TL 15 (1997) 36-42.
[8] C.T. Michael, N. Zacharias, A new technique for thick-source alpha counting determination of U and Th, Nuclear Instruments and Methods 439.1 (2000) 167-177.
[9] H. Mommsen, Provenance determination of pottery by trace element analysis: Problems, solutions and applications, Journal of Radioanalytical and Nuclear Chemistry 247 (2001) 657-662.
[10] J.M. Olley, R.G. Roberts, A.S. Murray, Disequilibria in the uranium decay series in sedimentary deposits at Allen's cave, nullarbor plain, Australia: Implications for dose rate determinations, Radiation Measurements 27.2 (1997) 433-443.
[11] J.S. Olin, G. Hartbottle, E.V. Sayre, Elemental Compositions of Spanish and Spanish-Colonial Majolica Ceramics in the Identification of Provenience, In: G.F. Carter (Ed.): Archaeological Chemistry II, Advances in Chemistry Series, 171, American Chemical Society, Washington D.C., 1978, pp. 200-229.
[12] M. Picon, Remarques preliminaries sur deux types d’alteration de la composition chimique des ceramiques au cours du temps, Figlina 1 (1976) 159–166.
[13] A. Schwedt, H. Mommsen, N. Zacharias, J. Buxeda i Garrigós, Analcime crystallization and compositional profiles – comparing approaches to detect post-depositional alterations in archaeological pottery, Archaeometry (in press).
[14] E. Tsantini, J. Buxeda i Garrigós, M.A. Cau Ontiveros, M. Orfilia Pons, Caracterización arqueométrica de la cerámica común producida en la villa romana de Sa Mesquida (Mallorca), Pyrenae 35 (2004) 157 – 186.
[15] A. Wintle, Luminescence dating: laboratory procedures and protocols, Radiation Measurements 27 (1997) 769-817.
[16] N. Zacharias, J. Buxeda i Garrigós, H. Mommsen, A. Schwedt, V. Kilikoglou, Implications of burial alterations on luminescence dating of archaeological ceramics, Journal of Archaeological Science, 32.1 (2005) 49-57.
MCF samples 19 slices M σσσσ (%) As 4.97 (21.) Ba 357. (15.) Ca% 14.2 (10.) Ce 66.5 (1.9) Co 9.65 (4.7) Cr 70.3 (9.0) Cs 10.6 (4.8) Eu 1.11 (4.3) Fe% 3.08 (2.7) Ga 21.6 (7.1) Hf 4.98 (3.8) K % 1.56 (46.) La 35.4 (1.6) Lu 0.38 (4.8) Na% 0.93 (43.) Nd 27.8 (12.) Ni 73.8 (53.) Rb 101. (43.) Sb 0.77 (5.9) Sc 13.4 (1.9) Sm 5.07 (12.) Ta 1.11 (4.2) Tb 0.76 (5.6) Th 12.4 (2.2) Ti% 0.47 (26.) U 2.56 (7.9) W 2.89 (7.7) Yb 2.74 (3.8) Zn 94.4 (8.2) Zr 99.1 (25.)
Table 1. Average concentrations M and their spreads (standard deviations) σ of the analysed sample slices. Unless indicated otherwise, concentrations are given in ppm (=µg/g), spreads in % of M.
samples Na (wt %) K (wt %) Rb [µg g-1] U [µg g-1] Th [µg g-1] MCF29 0.51±0.04 2.30±0.08 147±8.3 2.50±0.08 13.00±0.28 MCF35 0.45±0.02 2.40±0.02 148±2.5 2.28±0.08 12.00±0.28 MCF34 1.3±0.05 0.76±0.03 46±2.1 2.90±0.36 13.00±0.29 MCF38 1.3±0.12 1.10±0.04 83±2.5 2.50±0.10 12.00±0.22 MCF59 1.1±0.05 1.10±0.06 77±5.7 2.60±0.12 12.00±0.16
Table 2. Concentration values and experimental errors of the alkali metals Na, K, Rb and the actinides U, Th, for the TL studied MCF samples.
Table 3a samples ARCH_AGE [ka] De [Gy]
.
D [Gy ka-1] W α-value.
Dα [Gy ka-1].
Dβ [Gy ka-1].
Denv [Gy ka-1].
Denv-ave [Gy ka-1] MCF29 1.95±0.05 9.22±0.76 4.73±0.43 0.17±0.08 0.14±0.03 1.71±0.34 2.28±0.15 0.74±0.53 0.73±0.35 MCF35 1.95±0.05 9.03±0.87 4.63±0.47 0.15±0.07 0.14±0.02 1.59±0.27 2.32±0.11 0.72±0.51.
Denv-ave [Gy ka-1] TL_AGE [ka, ±1σ] TL_AGEave [ka, ±1σ] MCF34 MCF38 0.73±0.35 0.73±0.35 7.91±0.83 8.55±0.73 3.41±0.46 3.65±0.47 0.16±0.08 0.17±0.08 0.11±0.02 0.13±0.02 1.44±0.28 1.51±0.30 1.24±0.08 1.41±0.08 2.32±0.33 2.34±0.31 2.31±0.18 MCF59 0.73±0.35 8.43±0.68 3.69±0.45 0.17±0.08 0.13±0.02 1.54±0.26 1.42±0.08 2.28±0.29 Table 3b samples ARCH_AGE [ka] De [Gy] W.
Dα [Gy ka-1].
Dβ(U,Th) [Gy ka-1].
Denv-ave [Gy ka-1].
D [Gy ka-1].
Dβ(K) [Gy ka-1] Kave (wt %) unaffected burial period [ka] MCF34 1.95±0.05 7.91±0.83 0.16 1.44±0.28 0.70±0.04 0.73±0.35 4.06±0.44 1.19±0.14 1.67±0.20 1.12±0.10 MCF38 1.95±0.05 8.55±0.77 0.17 1.51±0.30 0.63±0.02 0.73±0.35 4.38±0.41 1.51±0.15 2.14±0.21 1.62±0.13 MCF59 1.95±0.05 8.43±0.68 0.17 1.54±0.26 0.64±0.02 0.73±0.35 4.32±0.36 1.41±0.13 1.99±0.18 1.39±0.09Table 3. TL dating results for MCF samples. W factor stands for the saturation content. 3.a. The α-value corresponds to the effectiveness of the alpha-particles, D
.
αthe effective alpha-dose rate,.
Dβ the beta-dose rate,
.
D the total dose-rate value and D
.
env the environmental dose-rate. Byapplying the TL dating procedure (cf. Figure 3) for the samples MCF29, MCF35, an average environmental dose-rate resulted which was then used for the TL age estimation of the samples MCF34, MCF38, MCF59. The average TL_AGE is the mean value calculated from the three ages following error propagation. 3.b. Estimation of the K beta-dose rate (D
.
β(K)) which provides an average (during burial period) K concentrationFigure 1. Dependency of Na and K concentrations on the extent of analcime crystallization, semiquantified by the integrated intensity in counts per second (CPS) of the 5.61 Å peak. Indicated bars are min-max-error bars.
Figure 2. Na and K concentration profiles in the analysed samples. All values expressed as relative to the average concentrations of the core slices for the unaffected samples.
Figure 3. Steps in TL dating procedure applied to MCF pottery.
1-3. Estimation of the environmental dose using the unaffected samples, 4. TL dating for the affected samples. 5-7 Estimation of the ‘unaffected burial period’ for the affected samples.


![Table 3a samples ARCH_AGE [ka] D e [Gy] . D [Gy ka -1 ] W α -value . D α [Gy ka -1 ]](https://thumb-eu.123doks.com/thumbv2/123dokorg/2973694.27661/11.1263.100.1166.178.787/table-samples-arch-age-gy-gy-value-gy.webp)