A T E S T FOR COMPARING DISTRIBUTION FUNCTIONS W I T I I STRONGLY UNBALANCED SAMPLES
In statistical practice the problem of testing a hypothesis which states that two independent random variables have the same probability distribution occurs rather often. In typical applications, especially in the fields of economics and the life sci-ences, the sizes of the random samples obtained from populations with comparable distributions are similar, and this fact was the fundamental premise used in con-structing the classical non-parametric tests (see the textbooks Fisz, 1763, or Wilks, 1762). Yet with the expansion of computer technology in modern engineer-ing, during work in the on-line regime in automatic control systems, the need has appeared for statistical inference regarding the equality of two distributions on the sole basis of one current value of the selected vector quantities, and thus in a case when one of the random samples is one-element. The present paper will be devoted to this issue.
A
new test is proposed based on kernel estimators tech-nique and the methodology of order statistics. investigations indicate that its properties are more advantageous than in the case of the classical tests fa-miliar from the literature.The paper is organized into short parts. In section the form of the proposed test will be presented. The next two sections, and 4, contain descriptions of the kernel estimator of the density function and the order estimator of the
which are used to determine the form of the statistic and the critical set. Final comments and the results of empirical verification of the test developed here are found in section
Consider the independent n-dimensional random variables
X
and that the distribution of the first of them has a density function. Let thesamples and (therefore of sizes m and l),obtained respectively from the above variables, be given. At significance level the hypothesis of the equality of the distribution functions of the variables
X
andY
will be verified.In the proposed form of the test, the criterion for the above hypothesis is the statistic
where denotes the kernel estimator of the density function of the random variable X generated on the basis of the X,, X,, The falsehood of the hypothesis being verified is shown by small values of the statistic S, and so critical interval will be accepted in left-sided form:
where the critical value a is accepted to be the estimator of order of the distribution of the statistic S, obtained from the sample (for
the definition of the see in practice this such a
value g that the probabilities of intervals ( - and [g, to and - respectively).
The next sections will briefly present the procedures for constructing the kernel estimator of the density function and the order
which completes the test proposed above.
The kernel estimator of the density function of the n-dimensional random vari-able
X,
calculated on the basis its m realizations X, , X,,, is defined by the dependencewhere the measurable and symmetrical
F
: with a unique in-tegral and a weak global maximum in point is called the kernel, the positive con-stanth
is known as the smoothing parameter, andD
means the n X n-dimensional, diagonal of the of the variable X's standard deviationswhile denotes the coordinate of the vector Detailed concern-ing the rules for choosconcern-ing the function and fixing the value the parameter
h
is found in Silverman (1986).Most often used in practice is the exponential kernelIf density function being estimated is of the class and moreover both this function and its second derivative are bounded, then the value of the
ing parameter is most often determined using the mean square criterion. The ap-proximate value can then be calculated by assuming the distribution of the
variable
X;
in this case, for the exponential kernel one obtainsmany applications, it proves to be advantageous to introduce the concept of modification of the parameter. construction of
can be done in manner:
A) the estimator is calculated in accordance basic dependence
the parameters = 2, stated as
c of f
.
, given inwith modified is defined
of the procedure the of estimator, but
its to choice
in practice grounds to accept
approxi-mate dependence
can be found in
tor other forms of the matrix D, different kernels diverging from the normal as well as a methodol-ogy smoothing parameter when it proves impossible to
simplified issues are also presented in mathematicixed differing concept has been by Devroe and
(1985).
A
detailed review of the methods used fix the smoothing parameter isOF
In view of the features of the test here proposed, a modified concept of the or-der estimator, based on the form recommended in the survey paper by Parrish
will be proposed below for estimating the quantile.
Consider the l-dimensional random variable its m-element random sample and a non-zero natural number k no greater than the size of this sample: 1 S k m. Let denote the k-th order statistic of the random variable (for its definition see e.g. the textbook by 1963; the value of the statistic means in practice the k-th element, in terms of magnitude, of the random sample
If
the size of the random sample m and the order of the quantile R the conditionthen the quantile estimator may be defined by the following formula (Parrish, 1990):
given that
where
[b]
constitutes an integral part of the numberb
ER. If the support of therandom variable is of the form [0, then in the case
formula can be supplemented by
It is obvious, in fact, that in such case
lim =
lim lim
Ultimately, the generalized order estimator of the quantile can be proposed in the form
when 0,5
where the number is given by formula (12).
For the purposes of the test designed here, the random variable introduced in this section should be defined as
A test with unbalanced
The degree of the quantile is identical with the assumed level of significance of the test:
Finally, the quantile estimator (17) obtained above is equal to the test's critical value introduced b y formula (2):
I n conclusion, it should be noted that, taking into account the levels of signifi-cance applied in practice, typically or which in the task at hand determine - through equality (20)- the degree of the quantile
R ,
conditionsand (13) exhaust all the possibilities actually encountered.
Differing concepts of the quantile estimators can be found in the survey paper by Parrish which deals with order estimators, and by and Marron
where estimators are considered.
The presented above provides the procedure necessary to con-struct a non-parametric test of significance regarding the equality of the distribu-tion funcdistribu-tions of two independent n-dimensional variables, in a case where one sample is one-element. Having obtained the random samples
..
.,
andafter assuming the level of significance should successively:
A)
generate the kernel estimator of the density function in accordance with the instructions given in sectiona) calculate the of the smoothing parameter, using formula (6);
h)
give the basic form of the estimator along with (4)-(5);C) introduce a modification the smoothing parameter, on the basis of algo-rithm (7)-(9);
B)
define values of the random sample for the distribution of the statisticSusing dependence (19);
C ) calculate the quantile of order
R
(taking into account formula (20) equal to the assumed level of significance applying dependence (17) together with (12);thanks to the results of item
(A),
the form of test statistic (1) and -on the basis of item (C)-critical set making use of equality (21);44
longs to the critical set, then the hypothesis of the equality of the distribution functions should be rejected; in the opposite case, there are no grounds to do so.
The correctness of the results obtained using the above test has been posi-tively verified by means of comprehensive simulation investigations. In order to as-sure a stable outcome with the precision presented below, the results here de-scribed were obtained testing from 10.000 to 100.000 samples.
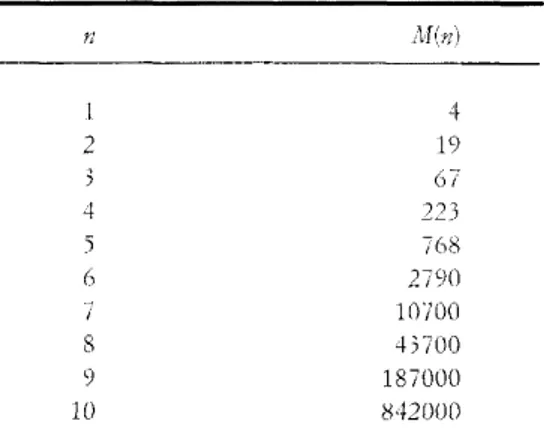
Accordingly, table shows the comparative results of the power of the test here designed and the classic Smirnov test (see Fisz, 1963, or Wilks, 1962) for a typical case when the random variables
X
andY
are l-dimensional and have normal distri-butions with unit variance and expectations - and that is, and (In the case of a one-element random sample, the Smirnov statistic has an asymptotic (with respect to size m) uniform distribution on the intervalIn analyzing the contents of table 1, it should be noted that:
A) the test proposed here holds steady at the assumed level of significance for smaller sizes of the random sample
.
.
X, than does the classic Smirnov test;B) the test designed in this paper has greater power.
(Even if in one case or another the number of type 2 errors proves to be less for the Smirnov test, this is always associated with a disproportionately large number of type errors). Similar encouraging results were obtained for many other tested distributions, including also asymmetric and "long-tailed"; for an illustration, see table given for exponential distribution with unit variance and expectations -and that is, and It should be emphasized that the Smirnov test has been characterized as the most useful among the classical tests in the case considered here of a one-element sample. Indeed, it can easily be observed that - for example - the series tests popular in the literature (see e.g. Fisz, 1963, or Wilks, 1962) are in this situation most often completely unsuitable for practical applications. In their basic form, when the value of the statistic constitutes the re-ceived number of the series, it can assume only the values or 3, and so the infor-mation assembled by this method is exceedingly scanty. Also in the case of other series tests here examined, not so inordinately disadvantageous, e.g. Mann-(Fisz, 1963; Wilks, the results were significantly worse than those presented in table The lack of data which would enable the critical value to be fixed constitutes a serious hindrance to the widespread application of the popular tests of significance for the case of a one-element sample, since these tests do not take such cases into account; not the distribution of statistics is given i n an asymptotic form with respect to the size of both random samples, and thus in a form that is here utterly useless.
The crucial problem in using kernel estimators is the selection of the smoothing parameter value. It should be underlined that the designed test proved to be only very slightly sensitive for that value. Table shows the results obtained for the smoothing parameter
h
decreased and increased two- and four-fold (!) with respect to the value given by dependence (6). Thus the power of the test and the minimum sample size guaranteeing the assumed level of significance undergo only insignifi-cant changes, for such an extreme differentiation. This very advantageous feature can be explained by the empirical method of fixing the critical value (by estimatingA test for comparing functions with strongly samples 45
of: the test designed in this paper, the test, for the
variablesXandY with by and
given in cases with are those whew the level of held
of: a) the in this the t a t , the
variablesXand with exponential standard by- and
given in the cases with hold are those the assumed of significance steady
unbalanced samples
the quantile), which prompts a sort of self-adaptation of tlie procedure. This posi-tive property was precisely the reason for the earlier forcing of an approximate mula (6)instead of the sophisticated suitable Tor use in other applications of kernel estimators (see Jones and 1996).
The data displayed in table 1 can also be to ascertain the minimal size of the sample that should be obtained from the variable
X
beforethe test designed in this i e. the smallest permissible value m. It results from the above data, then, that the test proposed guarantees level of
at the minimal size the sample m,,,,,,given by approximate
de-Table in turn, shows the the random assuring
10-percent precision of tlie kernel estimator of a density at the point
distribution, on of the
investi-gated random variables 1986, p. in cases of greater
formula ( 2 2 ) be to
correctness the formulated in
this way In interpreting tlie in the contents
attention tn in
sam-ple size in with increase as
of kernel is of
in the proposed, in
test has applied the
in
gen-eral random and tile
of the at
t o t 49
correct and current operating conditions of the device being supervised. (In prac-tice no limitations occur on the size of the random obtained from the
X,
whereas in view of the requisite speed of operation of' the detectionsystem, the the second variable Y should be
element ) In a when the hypothesis of the of the distributions of the random variables X and
Y
is rejected, one device malfunction. The test de-signed in this paper was satisfactory conditions of practical application in such a task of automatic control..
Ihe aof two n-dimensional of
one-element. estimators statistics been to solve this elaborated is provided for