Chapter 17
An Overview of Global Flavonoid Intake and its Food
Sources
Romina Escobar‐Cévoli, Carlota Castro‐Espín,
Virginie Béraud, Genevieve Buckland and
Raul Zamora‐Ros
Additional information is available at the end of the chapter http://dx.doi.org/10.5772/67655
Abstract
Dietary patterns and food availability differ greatly between regions and countries around the world. As a result, there is a large variability in the intake of total flavonoids and flavonoid subclasses, and subsequently in their major food sources. However, we need to be aware of certain methodological issues when we compare studies on flavo-noid intake.
In order to evaluate the intake of flavonoids, the different potential dietary assessment methodologies (dietary questionnaires and biomarkers) will be presented. Advantages and limitations of using of the two main food composition databases on flavonoids (US Department of Agriculture and Phenol-Explorer databases) will be discussed. The intake of total flavonoid and flavonoid subclasses in the various studies around the world will be comprehensively reviewed. The major food sources of flavonoids by region/country will be described. The main determinants of the intake of flavonoids will be explained as well.
Calculating the intake of flavonoids is the first step before estimating their potential protective effects against chronic diseases and is an essential step for developing future dietary guidelines on flavonoids.
Keywords: flavonoids, intake, food sources, determinants, worldwide
© 2017 The Author(s). Licensee InTech. This chapter is distributed under the terms of the Creative Commons Attribution License (http://creativecommons.org/licenses/by/3.0), which permits unrestricted use, distribution, and reproduction in any medium, provided the original work is properly cited.
1. Introduction
Flavonoids are ubiquitously distributed plant secondary metabolites, particularly in fruits, vegetables, legumes, nuts, chocolate, and derived beverages (e.g., tea, wine, and juices) [1]. They are synthesized through the phenylpropanoid pathway, converting phenylalanine into 4-coumaroyl-CoA, which then enter the flavonoid biosynthesis pathway. Finally, various enzymes modify the basic flavonoid skeleton, leading to the different flavonoid subclasses [2]. In plants, flavonoids fulfill many different functions, such as protecting against ultravi-olet radiation and phytopathogens, and acting as pigments, chemical messengers, physio-logical regulators, and cell cycle inhibitors [2].
Over the last three decades, flavonoids have received a lot of attention in cellular and animal models due to their well-established biological properties such as antioxidant, anti-inflamma-tory, and anti-carcinogenic effects, especially inducing enzymes and modulating metabolic and cell signaling pathways [3]. However, the epidemiologic evidence on the reduction in the chronic disease risk is still limited and usually inconsistent [4, 5]. The strongest evidence of their health-protective effects is for cardiovascular diseases [6] and type 2 diabetes [7]. One of the potential explanations of these inconsistent results is the difficulty in accurately assessing dietary flavonoid intake and the large variability of flavonoid intake among populations/ countries.
This chapter is focused on the large differences in dietary flavonoid intakes and food sources worldwide, but prior to this, it is also important to briefly summarize the complexity of flavonoid chemistry and classification, and the different possible methodologies to assess dietary flavonoid intake.
2. Chemistry and classification of flavonoids
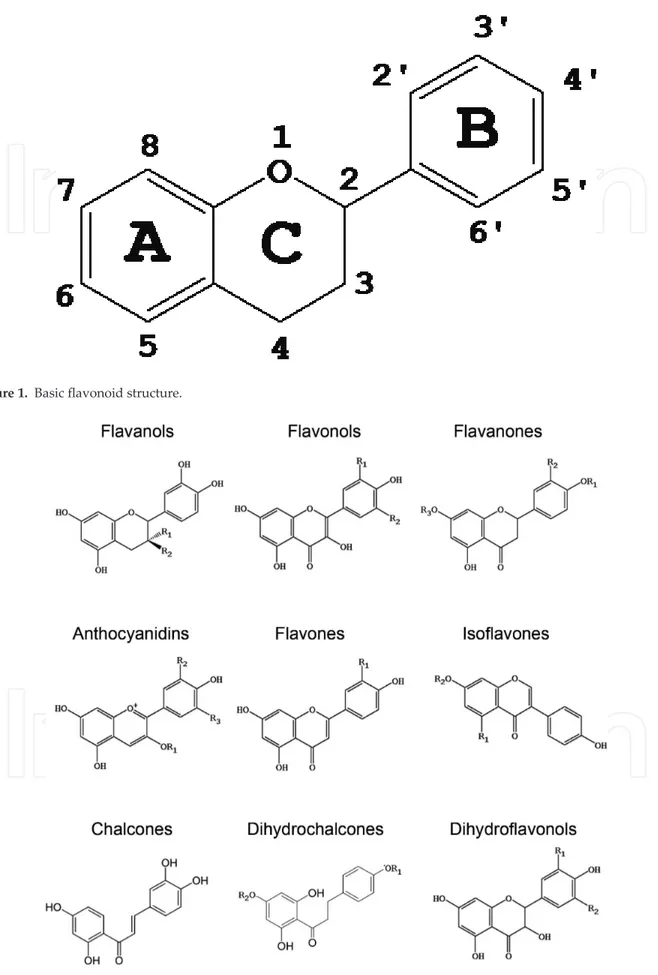
Flavonoids are a group of natural compounds with variable phenolic structures. In 1930, a new substance was isolated from oranges. At that time, it was believed to be a member of a new class of vitamins and was named as vitamin P. Posteriorly, it appeared that this compound was the flavonoid rutin and since then more than 9000 varieties of flavonoids have been identified [8]. Chemically, flavonoids are formed by a C6–C3–C6 structure, which consists of two benzene rings (A and B) linked by a three-carbon chain that form an oxygenated heterocycle (C ring) (Figure 1). They can be divided into nine classes according to their chemical structures: flavanones, flavones, dihydroflavonols, flavonols, flavan-3-ols, or flavanols [including mono-mers, proanthocyanidins, and flavanol-derived compounds (theaflavins and thearubigins)], anthocyanins, isoflavones, chalcones, and dihydrochalcones (Figure 2) [4]. The various classes of flavonoids differ in the level of oxidation and pattern of substitution of the C ring, while individual compounds within a class differ in the pattern of substitution of the A and B rings. Flavonoids in nature occur mostly as glycosides, aglycones (especially flavanols), and, in few cases, as methylated derivatives [3]. The basic flavonoid structure is the aglycone. When glycosides are formed, the glycosidic linkage is normally located in positions 3 or 7 and the Flavonoids - From Biosynthesis to Human Health
Figure 1. Basic flavonoid structure.
Figure 2. Flavonoid classes and their chemical structures.
An Overview of Global Flavonoid Intake and its Food Sources
sugar can be L-rhamnose, D-glucose, glucorhamnose, galactose, or arabinose [9]. This is very relevant because bioavailability differs among flavonoids, depending on the aglycone, the type of monosaccharide attached, and its position [10].
3. Dietary assessment of flavonoids
The most common method of estimating flavonoid intake in epidemiologic studies is to use dietary questionnaires, such as food frequency questionnaires (FFQ), 24-h dietary recalls, and food diaries, to record all food consumption over a known period of time dietary surveys, especially FFQ, are prone to several limitations, particularly regarding the identification of specific foods (e.g., the large variety of products available on the market, different food processing and cooking techniques, distinct ingredients, and preparation of recipes) and accu-rate quantification of portion sizes [11]. Despite this, FFQs are the most common method used in large epidemiological studies, mainly because they are an easy, quick, and an economical way to record the participants’ habitual diet. In order to improve both quantification and quality of the data gathered, the use of a previously validated FFQ on flavonoids or flavo-noid-rich foods is essential. Moreover, the use of innovative technologies and methodologies for the dietary assessment of flavonoid intake such as the collection of multiple 24-HDRs and food records and interactive computer- and camera-based technologies will certainly improve this process [12].
In order to estimate the intake of flavonoids, a food composition table or database is also needed. There are currently two main databases. The first one is the US Department of Agriculture (USDA) database on flavonoids, isoflavones, and proanthocyanidins, which was created in 2003, 1999, and 2004, respectively [13–15]. Since then, several updates have been released. The USDA databases contain worldwide food composition data on the six main flavonoid classes (flavanols, flavonols, flavanones, flavones, isoflavones, and anthocyanidins) expressed as aglycones. Phenol-Explorer is the second most common database [16]. It was developed in 2009 and contains worldwide data, but in this case, on all nine flavonoid classes (including chalcones, dihydrochalcones, and dihydroflavonols) expressed as they are found in nature (mainly as glycosides) and analyzed with chromatography without hydrolysis. Phenol-Explorer also contains data on chromatography after hydrolysis and, in this case, flavonoids are expressed as aglycones, but these are not usually used. In the studies using Phenol-Explorer using flavonoid data expressed as aglycone equivalents, flavonoid glycoside contents are converted into aglycone contents using their respective molecular weights [17, 18]. The other important difference between databases is that Phenol-Explorer does not contain data on thearubigins because the composition data quality on thearubigins is very low [19]. The non-specific spectrophotometric method used to date only provides a crude estimation of their concentrations in black teas, which are the only known food sources of thearubigins.
These differences between databases (classes of flavonoids, aglycones vs. glycosides, and inclu-sion of thearubigins) complicate the comparison among studies using different databases. In this book chapter, we have mostly compared studies using the USDA databases or Phenol-Explorer with data expressed as aglycones. In our comparisons, we have also made distinctions between Flavonoids - From Biosynthesis to Human Health
the studies including proanthocyanidins and thearubigins, which are the most controversial flavonoid compounds.
4. Geographical differences in total flavonoid intake and their food sources
The intake of flavonoids varies greatly by country/geographical region due to different dietary patterns; although differences in the flavonoid classes included, the dietary assessment methods, the food composition database use, and the method of expression (glycoses vs aglycones) applied complicate these comparisons. Table 1 summarizes the most important descriptive studies assessing flavonoid intakes in different countries/regions. The mean intake of flavonoids worldwide ranges between 150 and 600mg/day expressed as aglycones without thearubigins [20–26]. Taking into account thearubigins, the flavonoid intake could increase by a negligible amount in populations with low black tea intake, but would double the intake in black tea-consuming countries, such as the UK (from ∼500 to >1000mg/day) [27].Europe is the continent with the most number of studies assessing the intake of total flavo-noids, and therefore, it is possible to describe their intake quite accurately. Moreover, studies like the European Prospective Investigation into Cancer and Nutrition (EPIC) study allow us to compare the intake in 10 European countries using the same methodology [21, 26]. In Europe, an increasing south-to-north gradient is usually observed [26]. Despite the high intake of fruits, vegetables, and red wine in Mediterranean (MED) countries, the intake of total flavonoids in these countries (250–400mg/day) is lower than in non-MED countries (350–600 mg/day), even without taking into account thearubigins. This is due to the much higher consumption of tea in non-MED compared to MED countries. These differences would be larger if thearubigins were also included [27]. The highest total flavonoid intake in Europe is in the UK, due to the traditional tea culture [21, 26]. Eastern European countries, such as Poland, also have a high intake of total flavonoids (∼600mg/day), related to their high tea consumption [32, 40]. Southern regions of France are considered as a MED region, while northern regions as a non-MED region; therefore, France has an intermediate intake of total flavonoids, with the main food sources being fruit, tea, and red wine (a combination of food sources from MED and non-MED countries) [33]. In Scandinavian countries with a low con-sumption of tea, such as Finland, the intake of total flavonoids (200–250mg/day) is lower than MED countries, since the consumption of fruit is lower as well [31].
In Australia, there are various studies describing the intake of total flavonoids [20, 28, 29]. As a high tea-consuming country, Australia has a high intake of total flavonoids (650–700mg/day), including thearubigins. In the three Australian populations documented, black tea contributes to at least 75% of total polyphenols.
In America, several studies have estimated the intake of total flavonoids, especially in the US [22, 34–36, 41], since the USDA databases were developed there [13–15]. In the US, the mean intake of total flavonoids varies from 250 to 400mg/day, including proanthocyanidins and thearubigins [22, 34–36, 41]. Although the consumption of tea is not very high, tea is still the main food source of total flavonoids in the US, probably due to a low consumption of fruits An Overview of Global Flavonoid Intake and its Food Sources
Study Country Population Dietary assessment FCDB Aglycones vs. glycosides Total flavonoid intake (mg/day) Major class contributor Main food sources References
NNS95 Australia 17,326 24-HDR USDA Aglycones 225§ Flavanols** Black tea [20]
Calcium Intake Fracture Outcome Age-Related Extension Study
Australia 1136 SemiQ-FFQ USDA Aglycones 696 Flavanols** Black tea [28]
The Blue Mountains Eye Australia 79 3 4-WFR USDA Aglycones 683 Flavanols** Black tea [29]
EPIC MED 36,037 24-HDR USDA, PE Aglycones 370* PA Fruit [21]
PE Glycosides 449* PA Fruit [26]
Non-MED
USDA, PE Aglycones 374* PA Fruit [21]
PE Glycosides 522* PA Tea [26]
PREDIMED Spain 7200 FFQ PE Glycosides 443 PA Fruit [27]
TOSCA.IT Italy 2573 FFQ USDA Aglycones 364 PA Fruit [30]
SUVIMAX France 4942 6 24-HDR PE Aglycones 436* PA Fruit, tea, red
wine
[17]
Glycosides 505*
FINDIET 2002 Finland 2007 24-HDR Own database Aglycones 209* PA Berries, fruit [31]
HAPIEE Poland 10,477 FFQ PE Aglycones 898* Flavanols** Tea, cocoa [32]
Polish National Multicenter Health Survey
Poland 6661 24-HDR USDA, PE Aglycones 524.6 Flavanols** Tea, apples [33]
Glycosides 403*
NIH-AARP US 491,840 FFQ USDA Aglycones 203*§ Flavanols** Tea [34]
NHS I & NHS II & HPFS US 156,957 FFQ USDA Aglycones 391 PA Tea [35]
NHANES US 8809 24HDR USDA Aglycones 264 Flavanols** Tea [20, 36]
Mexican Teachers’ Cohort Mexico 106,466 FFQ PE Aglycones 140* PA Fruit and
orange juice
[23]
Glycosides 235*
Health Survey-São Paulo Brazil 1103 24-HDR PE Glycosides 54.6* Flavanones Citrus fruit,
beans
[37]
Cross-sectional study China 3317 SemiQ-FFQ USDA Aglycones 225* Flavanols** Soy, pome fruit [24]
Flavonoids - From Biosynthesis to Human Health
Study Country Population Dietary assessment FCDB Aglycones vs. glycosides Total flavonoid intake (mg/day) Major class contributor Main food sources References
Case-control China 66 FFQ USDA Aglycones 65§ Flavonols – [38]
KNHANES Korea 33,581 24-HDR USDA, PE,
own database
Aglycones 318 PA Fruit, tofu,
onions
[25]
Tehran Lipid and Glucose Study
Iran 2618 FFQ USDA Aglycones 1652 Flavanols** Vegetables,
fruit
[39]
PE=phenol explorer; WFR=weighed food record; 24HDR=24-h dietary recall; MED=Mediterranean countries; Non-MED=non-Mediterranean countries; PA=proantho-cyanidins; SemiQ-FFQ=semi-quantitative FFQ; FFQ=food frequency questionnaire; FCDB=food composition database.
*Without thearubigins. §Without proanthocyanidins.
**Flavanols is a combination of flavan-3-ol monomers and flavanol-derived compounds. Table 1. Intake of total flavonoids (mg/day) in different countries/regions.
An Overview of Global Flavonoid Intake and its Food Sources
http://dx.doi.org/10.5772/67655
and vegetables. In the US, some differences in the total flavonoid intake among ethnicities have been observed [22, 36]. Non-Hispanic whites have the highest intake of flavonoids (>300mg/day), whereas non-Hispanic blacks, Mexican Americans, and other ethnicities consume approximately 200mg/day. Data on other countries in America is very limited, and to the best of our knowledge, Brazil [37] and Mexico [23] are the only other countries with available data. The intake of total flavonoids is around 150 and 50mg/day in Mexico and Brazil, respectively. These are the countries with the lowest intake of total flavonoids that have been published worldwide. Although, the studies in these countries did not take thearubigins into account, the contribution of thearubigins to total flavonoids is insignificant because Brazilians and Mexicans rarely drink tea. The main food source of total flavonoids is citrus juices, followed by fruit in Mexico and beans in Brazil [23, 37]. In these Latin-American countries, a potential relevant underestimation of total flavonoids cannot be ruled out because of missing food composition data on some tropical foods, such as fruits and vegeta-bles (e.g., mamey, zapote, papaya, sweet potato, nopal, guava, jicama, and prickly pears) that are frequently consumed in their diets and may be good sources of flavonoids.
In Asian countries, very little complete data are available, as there is only data for East Asian countries (such as China [24, 38] and South Korea [25]). The total flavonoid intake in China ranges from 65mg/day without proanthocyanidins [38] to 225mg/day with proanthocyanidins [24]. In both studies, thearubigins are not included, but Chinese people drink green tea, but not black tea. Thearubigins are formed during the fermentation of green tea to black tea. In South Korea, the intake of total flavonoids is slightly higher than in China (320mg/day) [25]. In East Asian countries, soy and its derived products (the main food sources of isoflavones) are one of the most important contributors to total flavonoids, although proanthocyanidins and flavan-3-ol monomers are the most abundant flavonoids in South Korea and China, respectively. In Japan, China, and South Korea, there are many studies focusing on isoflavones, due to their potential phytoestrogenic effects [42], but not on total flavonoids. In the Middle East, a recent study in Iran has been conducted showing a mean intake of 1650mg/day [39]. This is the highest mean of total flavonoid intake worldwide. This high amount is because of the elevated consumption of black tea in these Middle East populations.
In summary, there is a high heterogeneity between countries in total flavonoid intake. The highest intake is in Iran [39], followed by the UK (>1000mg/day) [27] and the lowest intake is in Brazil and Mexico (<150mg/day) [23, 37]. The populations with a higher intake of total flavonoids are those with a high consumption of tea, especially black tea. In this case, the main contributor to total flavonoids is thearubigins, and this may be partially explained due to the inaccurate measurement of thearubigin content in black tea [19]. Populations with a lower intake of total flavonoids are those with a low consumption of tea. In these cases, the main food sources are fruit and proanthocyanidins become the main contributor to total flavonoids. In East Asia, isoflavones are also important contributors to total flavonoids due to the high consumption of soy-derived products. Further studies are warranted to estimate the intake of total flavonoids in other regions of the world with little available data, such as Latin America, Africa, and Middle East. More research on the content of flavonoids in food is also needed in order to improve the existent food composition data, adding new foods (e.g., tropical foods) and refining the thearubigin data.
Flavonoids - From Biosynthesis to Human Health 378
5. Determinants of the total flavonoid intake
Total flavonoids, as with most nutrients and dietary compounds, are positively correlated to total energy intake. Therefore, subjects consuming more energy are also more likely to be those with a higher intake of total flavonoids, even though one of the most relevant food sources is tea which is a non-caloric beverage. For this reason, if we want to study the determinants of total flavonoid intake, we should adjust our models for total energy intake.
Men usually consume higher amounts of total flavonoids, but after adjusting for total energy, women actually tend to consume more total flavonoids, as reported in the US [22] and South Korean populations [25]. However, men have a higher flavonoid intake in MED countries [21] and France [33] as men tend to drink more wine, particularly red wine. In contrast, the opposite was found in non-MED countries because women tend to consume more tea than men [21].
Young adults are more likely to consume less total flavonoids than older adults [21–23, 33]. The age range with the highest intake of total flavonoids is between 55 and 70 years, probably because they consume a more traditional dietary pattern and therefore more fruit, vegetables, red wine, and tea (depending on the region). On the other hand younger adults (20–40 years) tend to follow a more Westernized diet, with less plant-based foods. Although total flavonoid intake is usually higher in the older age groups, subjects are likely to keep their dietary habits throughout adulthood. Therefore, no significant differences have been found in the estimation of total flavonoid intake after several years of follow-up [22, 41].
Fruit, tea, red wine, and vegetables are the most important food sources of total flavonoids [21, 26]. These plant-based foods are characteristic of healthy and traditional diets, and therefore, subjects with high adherence to healthy dietary and lifestyle habits are more likely to have a higher intake of total flavonoids. For example, individuals with a normal weight (BMI < 25), a high education level, and a high socioeconomic status and who are physically active and non-smokers (never and former non-smokers) tend to have a higher total flavonoid intake [22, 23, 26, 33].
6. Flavanols: intake and food sources
Total flavanols or flavan-3-ols is the most consumed flavonoid class by far worldwide (Table 1), contributing to >80% of total flavonoids. Flavanols are divided into three subclasses: flavan-3-ol monomers (including catechins and epicatechins), proanthocyanidins (including oligomers and polymers of flavanols), and flavanol-derived compounds (including thearubigins and theaflavins). In nature, flavanols are predominantly found as aglycones.
The intake of total flavanols ranges from 11mg/day in Brazil [37] to 629mg/day in Australia [29] (Table 2). These large differences among populations are due to different intakes of the main food sources (i.e., tea and fruit). Depending on the intake of tea (a beverage rich in flavan-3-ol mono-mers and derived compounds) and fruit (foods rich in proanthocyanidins) a rank of countries/ regions can be proposed: (i) countries with a very high consumption of tea (such as Australia, An Overview of Global Flavonoid Intake and its Food Sources
UK, and Poland), which have a mean intake between 450 and 600mg/day [28, 29, 33, 43, 44]; (ii) countries with a moderate consumption of tea or a very high consumption of fruit (such as MED countries, Germany, and the US), which have a mean intake of 250–400mg/day [17, 35, 43, 45]; (iii) countries with a low consumption of tea and low-moderate consumption of fruit (such as Scandinavian countries, South Korea, and Latin-American countries), with a mean intake rang-ing from 50 to 150mg/day [23, 25, 31, 37]. In Latin-American countries, an underestimation of the total flavanol intake is probable, since there is little food composition data available on tropical foods, especially on fruit [13–16].
6.1. Flavan-3-ol monomers
Intake of flavan-3-ol monomers varies between 10mg/day in Mexico [23, 58, 59] and 270mg/day in Poland [32], contributing to approximately 15–30% of total flavanols. The main food sources of flavan-3-ol monomers are tea, fruit (e.g., apples, stone fruits), red wine, and cocoa products [1]. The intake of these foods and beverages will determine the levels of flavan-3-ol monomers in the diet. Countries with a high intake of tea have a major intake of these compounds, such as Australia, UK, and Poland (150–250mg/day), followed by countries with a high consumption of fruit and red wine, such MED countries and France (50–100mg/day), and finally countries with a low consumption of tea and certain types of fruit, such as Latin American and Finland (<l50;mg/day) (Table 2).
6.2. Proanthocyanidins
Proanthocyanidins account for >75% of total flavanols in countries with a low intake of tea (MED countries) and <40% of total flavanols in countries with a high intake of tea (non-MED countries) [40, 43]. Proanthocyanidins are characteristic flavonoids in fruit, particularly apples, stone fruits, and berries, as well as red wine, but not in tea [1]. The highest intake of proantho-cyanidins is in MED countries, including France (>200mg/day) [17, 43, 53], followed by non-MED countries and the US (150–200mg/day) [32, 35, 36, 43, 45], and finally Latin-American and Asian countries (<150mg/day) [23–25] (Table 2).
6.3. Flavanol-derived compounds
Theaflavins and thearubigins occur exclusively in tea [1]. Theaflavins are consumed in low amounts (<3mg/day) in countries with low tea consumption and larger amounts (10–30mg/ day) in countries with an important tea culture (Table 2) [43]. The same pattern can be applied to thearubigins, which can only be found in black tea. The intake ranges from 1mg/day in Spain to 530mg/day in the UK, where it contributes to almost 50% of total flavonoids [40].
7. Flavanones: intake and food sources
Flavanones are normally the second main flavonoid class (8–10%) [21]. The variation in flava-none intakes is relatively small between most of the countries (30–40mg/day) (Table 2). The highest intake is in Greece and Spain (∼60mg/day as aglycones) [27, 55], and the lowest intake Flavonoids - From Biosynthesis to Human Health
Study name Country N
Dietary
assessment FCDB
Glycosides vs.
aglycones Anthocyanidins Flavones Flavonols Flavanones
Total Flavanols
Isoflavones Chalcones Dihydrochalcones Dihydroflavonols References Total Flavan -3 -olmonomers PA Flavanol-derived compounds
Total Theaflavins Thearubigins
NNS95 Australia 17,326 24HDR USDA Aglycones 2.9 0.5 20.7 6.9 187.9 239.2 26.2 213.0 [20]
Calcium Intake Fracture Outcome Age Related Extension Study
Australia 1136 SemiQ-FFQ USDA Aglycones 28.0 56.0 570 [28]
Longitudinal Assessment of Ageing in Women
Australia 511 Diet history USDA Aglycones 4.1 [46]
The Blue Mountains Eye Australia 79 3 4-d WFR USDA Aglycones 7.0 1.9 28.7 21.2 629 [29]
Membership database of Flemish Dietetic Association
Belgium 45 SemiQ-FFQ &
4DFR
based on USDA Aglycones 6.9 4.3 19.6 37.7 107 [47]
EPIC MED 36,037 24HDR USDA, PE Aglycones 37.4 5.6 24.8 33.7 282 48.5 218.4 15.0 1.5 13.5 0.4 [40, 43, 48–
50]
PE Glycosides 48.5 14.9 32.4 29.7 316 57.7 251.7 6.5 0.6 0.004 2.3 4.6 [26]
Non-MED USDA, PE Aglycones 27.3 4.1 29.5 31.8 430 93.1 180.1 157.1 7.1 150.0 0.7 [40, 43, 48–
50]
PE Glycosides 43.9 10.1 39.2 38.0 385 134.6 224.7 25.8 0.54 0.004 2.7 3.0 [26]
EFSA database Northern Europe 30,000 FFQ & 24HDR USDA, PE Aglycones 241 58.8 160.0 113.2 7.9 105.3 [51]
Central Europe 449 99.5 114.5 235.9 17.3 218.6
Southern Europe 283 35.2 110.5 45.2 3.1 42.1
PREDIMED Spain 7200 FFQ PE Glycosides 38.5 41.6 80.4 132.0 147 26.7 117.0 0.3 <0.01 <0.01 3.0 2.8 [27]
Austrian institutionalized elderly population
Spain 304 FFQ PE Glycosides [52]
Case-control study in Italy Italy 4154 FFQ USDA Aglycones 20.0 0.5 21.6 38.3 325 57.4 267.0 0.03 [53, 54]
An Overview of Global Flavonoid Intake and its Food Sources
http://dx.doi.org/10.5772/67655
Study name Country N
Dietary
assessment FCDB
Glycosides vs.
aglycones Anthocyanidins Flavones Flavonols Flavanones
Total Flavanols
Isoflavones Chalcones Dihydrochalcones Dihydroflavonols References Total Flavan -3 -olmonomers PA Flavanol-derived compounds
Total Theaflavins Thearubigins
TOSCA.IT Italy 2573 FFQ USDA, PE Aglycones 33.1 10.5 39.7 19.0 65 0.07 3.3 2.3 0.2 [30] Case-control study in
Greece
Greece 200 SemiQ-FFQ USDA Aglycones 12.2 3.0 9.6 58.1 10.9 0.8 [55] SU.VI.MAX study France 4942 6 24HDR PE Aglycones 35.0 18.0 34.0 13.0 87.0 227.0 9.0 5 [17] German National Nutrition
Survey II
Germany 15,371 Diet history USDA, PE Aglycones 386 119.8 196.4 69.7 [45] HAPIEE study Poland 10,477 FFQ PE Glycosides 29.7 15.5 106.1 103.8 270.0 176.3 1.6 11.3 [32] Polish National Multicenter
Health Survey
Poland 6661 24HDR USDA Aglycones 20.9 0.6 32.0 9.2 462 0.2 [33] PE Glycosides 22.0 4.3 47.9 7.3 315 0.03 <0.01 7 0.07 Leeds Women's Wellbeing
Study (LWW), the Diet and Health Study (DH)
UK 246 3- 7d FR USDA, PE Aglycones 19.1 2.8 58.3 21.4 506 2.4 1.9 [44] Case-control study in
Scotland
Scotland 1456 SemiQ-FFQ Own database Aglycones 1.0 28.0 20.6 115.2 33.5 [56] FINDIET 2002 Study Finland 2007 24-HDR Own database Aglycones 47.0 5.4 27.0 128 12.0 20.0 0.9 [31] NIH-AARP Diet and
Health Study
US 491,840 FFQ USDA Aglycones 12.7 1.2 19.1 37.1 101.9 0.6 [34] NHS I & NHS II & HPFS US 156,957 FFQ USDA Aglycones 13.9 1.8 18.4 41.0 307 55.6 251.3 [35] NHANES US 8809 24HDR, FFQ USDA Aglycones 3.0 1.5 12.9 14.4 230.6 74.1 1.1 [20, 36] Women's Health Initiative US 96 FFQ USDA Aglycones 2.1 [57] Mexican Teachers’ Cohort Mexico 106 SemiQ-FFQ PE Glycosides 27.0 1.0 12.9 60.2 121 17.4 103.9 0.0 0.0 0.0 2.1 <0.01 1.4 <0.01 [23] Mexican case-control study Mexico 478 FFQ USDA Aglycones 6.6 35.6 6.9 [58] Cohort study in the state of
Morelos
México 50 FFQ USDA Aglycones 7.5 29.3 10.0 [59]
Flavonoids - From Biosynthesis to Human Health
Study name Country N
Dietary
assessment FCDB
Glycosides vs.
aglycones Anthocyanidins Flavones Flavonols Flavanones
Total Flavanols
Isoflavones Chalcones Dihydrochalcones Dihydroflavonols References Total Flavan -3 -olmonomers PA Flavanol-derived compounds
Total Theaflavins Thearubigins
Health Survey-São Paulo (ISA-Capital 2008)
Brazil 1103 24HDR PE Glycosides 6.8 3.6 14.6 16.1 11 1.5 [37]
Health conditions, nutrition, and use of medication by the elderly in Viçosa (Minas Gerais)
Brazil 620 Recall of habitual consumption PE Aglycones 2.2 4.7 23.7 36.4 377 1 [60] Cross-sectional Chinese study
China 3317 SemiQ-FFQ USDA Aglycones 5.3 0.7 14.0 5.8 123.9 48.7 6.3 [24]
Shanghai Breast Cancer Study
China 1823 FFQ USDA Aglycones 68.6 [61]
Case-control study in Shanghai
China 1393 FFQ Own database Aglycones 27.4 10.4 123.8 3.54 [62]
Study in Suihua, northern China
China 887 FFQ Own database Aglycones 29.2 32.6 [63]
Case-control in China China 560 FFQ Own database Aglycones 29.2 [64]
Case-control in the northeast of China
China 66 FFQ USDA Aglycones 17.2 2.1 22.8 5.1 13.3 [38]
KNHANES Korea 33,581 24HDR USDA, PE Aglycones 37.0 1.0 64.6 35.9 122 50.6 70.8 0.1 0.6 57.5 [25]
Case-control in Japan Japan 340 FFQ Own database Aglycones 39.6 [65]
PE=phenol explorer; WFR=weighed food record; 24HDR=24-h dietary recall; MED=Mediterranean countries; Non-MED=non-Mediterranean countries; PA=proanthocyanidins; SemiQ-FFQ=semi-quantitative FFQ; FFQ=food frequency questionnaire; FR=food record; FCDB=food composition databaseB_118796_SE_LE
Table 2. Intake of flavonoid classes and subclasses (mg/day) in different countries/regions.
An Overview of Global Flavonoid Intake and its Food Sources
http://dx.doi.org/10.5772/67655
is in China (∼5mg/day) [24, 38]. Flavanone intake patterns perfectly match the consumption of their main food sources: citrus fruit and citrus juices [1].
8. Flavonols: intake and food sources
Flavonols are usually the third principal flavonoid class (7–9%) [21]. The mean intake of flavo-nols generally varies between 20 and 40mg/day (Table 2). In some countries (South Korea, China, and Poland) [25, 32, 62], a higher intake of flavonols is reported (>60mg/day as agly-cones), but some of these values are probably overestimated. Flavonols are widely distributed in fruit and vegetables, particularly apples, onions, some leafy vegetables, and red wine [1].
9. Anthocyanidins: intake and food sources
Anthocyanidins are present in all red-blue-purple fruits and vegetables (e.g., berries, apples, pears, grapes, plums, and aubergine) along with red wine. They are responsible for the color of these foods. Depending on the region, anthocyanidins fluctuate from the second to the fourth most consumed flavonoid class (7–10%) [21]. The mean intake of anthocyanidins range from 20 to 40mg/day in most of the countries (Table 2). Countries with a high consumption of berries, such as Finland, are the top consumers of anthocyanidins (∼50mg/day) [31], while Brazil and the US have a particularly low intake (<15mg/day) [20, 34, 35, 37, 60].
10. Flavones: intake and food sources
Flavones are the fifth most common flavonoid class, accounting for 1–2% of total flavonoids [21]. Their intake varies between 1 and 5mg/day using the USDA database [13] and 5–20mg/ day as aglycones using the Phenol-Explorer [16] (Table 2). Flavones are widely distributed in plant-based foods, fruits, vegetables, juices, wine, etc. It is important to highlight that the richest sources of flavones are herbal teas, and this food item is rarely recorded in dietary questionnaires, and therefore, an underestimation of flavone intake is quite probable.
11. Isoflavones: intake and food sources
Isoflavones are the flavonoid class with the lowest intake among the typical flavonoid classes (flavanols, flavanones, flavonols, anthocyanidins, flavones, and isoflavones). The intake of flavonoids is normally <2mg/day in Westernized countries, as they mainly occur in soy prod-ucts [48]. However, in the UK health conscious group of the EPIC study, including vegans and vegetarians, the mean intake rises to 18mg/day [48]. In Asian countries, where the consump-tion of soy is very common, the mean intake of isoflavones ranges from 30 to 70mg/day, contributing to almost 20% of total flavonoids.
Flavonoids - From Biosynthesis to Human Health 384
12. Other minor flavonoids: intake and food sources
Chalcones, dihydrochalcones, and dihydroflavonols are three minor subclasses of flavonoids. Food composition data on these classes are limited and only available in Phenol-Explorer [16], but not in the USDA database [13]. Chalcones are found in beer and broad beans, and their mean intake is very low (<0.01mg/day expressed as glycosides) (Table 2). Dihydrochalcones are present in apples and derived products (e.g., cider and apple juice). The mean intake is between 1.5 and 3mg/day expressed as glycosides [17, 26], except in Poland where the intake is double (Table 2) [32, 33]. The principal food source of dihydroflavonols is wine, and therefore, the countries with a greater intake of wine, such as France and MED countries, have the highest consumption (∼5mg/day expressed as glycosides) (Table 2) [17, 26]. Countries with a low wine intake, such as Poland, have a negligible intake (<0.1mg/day expressed as glycosides) [33].
13. Conclusions
Overall, the mean intake of total flavonoids worldwide is around 400mg/day, ranging from 150 mg/day in Latin-American countries to 600mg/day in Australia and the UK, without considering thearubigins. Tea (rich in flavan-3-ol monomers and thearubigins) is the most important food source of total flavonoids in countries with a tea culture, while fruits (rich in proanthocyanidins) are the main food source in the remaining countries. Flavanols is the main contributor to total flavonoids (75%), followed by far by flavanones, flavones, and anthocyanidins (7–10% each) and flavones and isoflavones (1–2% each). Chalcones, dihydrochalcones, and dihydroflavonols are also minor flavonoid subclasses. It is important to highlight that the intake of isoflavones is extremely high in East Asian countries (30–70mg/day) compared to Western countries (<2mg/ day), since isoflavones mostly occur in soy products. Older women with healthy lifestyle and dietary habits and higher educational levels and incomes are the sector with the highest intake of total flavonoids.
Finally, more composition data are needed, particularly for tropical foods, to improve the estimation of total flavonoids, especially in some specific regions. Further studies are warranted to increase the descriptive analyses in several areas where little data are available to date, such as Latin America, Africa, and the Middle East. An accurate estimation of flavo-noid intake is the first step before estimating their potential protective effects against chronic diseases and is an essential step for developing future dietary guidelines on flavonoids.
Acknowledgements
This project has been supported by the Instituto de Salud Carlos III project CP15/00100 and cofunded by FEDER funds/ European Regional Development Fund (ERDF)- a way to build Europe.
An Overview of Global Flavonoid Intake and its Food Sources
Author details
Romina Escobar-Cévoli, Carlota Castro-Espín, Virginie Béraud, Genevieve Buckland and Raul Zamora-Ros*
*Address all correspondence to: [email protected]
Unit of Nutrition and Cancer, Cancer Epidemiology Research Program, Catalan Institute of Oncology, Bellvitge Biomedical Research Institute (IDIBELL), Barcelona, Spain
References
[1] Pérez-Jiménez J, Neveu V, Vos F, Scalbert A. Identification of the 100 richest dietary sources of polyphenols: an application of the Phenol-Explorer database. Eur J Clin Nutr. 2010;64,Suppl 3:S112–20.
[2] Falcone Ferreyra ML, Rius SP, Casati P. Flavonoids: biosynthesis, biological functions, and biotechnological applications. Front Plant Sci. 2012;3:222.
[3] Kumar S, Pandey AK. Chemistry and biological activities of flavonoids: an overview. Sci World J. 2013;2013:162750.
[4] Zamora-Ros R, Touillaud M, Rothwell JA, Romieu I, Scalbert A. Measuring exposure to the polyphenol metabolome in observational epidemiologic studies: current tools and applications and their limits. Am J Clin Nutr. 2014;100:11–26.
[5] van Dam RM, Naidoo N, Landberg R. Dietary flavonoids and the development of type 2 diabetes and cardiovascular diseases: review of recent findings. Curr Opin Lipidol. 2013;24:25–33.
[6] Jiang W, Wei H, He B. Dietary flavonoids intake and the risk of coronary heart disease: a dose-response meta-analysis of 15 prospective studies. Thromb Res. 2015;135(3):459–63. [7] Liu YJ, Zhan J, Liu XL, Wang Y, Ji J, He QQ. Dietary flavonoids intake and risk of type 2
diabetes: a meta-analysis of prospective cohort studies. Clin Nutr. 2014;33(1):59–63. [8] Xiao ZP, Peng ZY, Peng MJ, Yan WB, Ouyang YZ, Zhu HL. Flavonoids health benefits and
their molecular mechanism. Mini Rev Med Chem. 2011;11:169–77. [9] Middleton E. The flavonoids. Trends Pharm Sci. 1984;5:335–8.
[10] Manach C, Williamson G, Morand C, Scalbert A, Rémésy C. Bioavailability and bioefficacy of polyphenols in humans. I. Review of 97 bioavailability studies. Am J Clin Nutr. 2005;81(1 Suppl):230S–42S.
[11] Zamora-Ros R, Rabassa M, Llorach R, González CA, Andres-Lacueva C. Application of dietary phenolic biomarkers in epidemiology: past, present, and future. J Agric Food Chem. 2012;60:6648–57.
Flavonoids - From Biosynthesis to Human Health 386
[12] Illner A-K, Freisling H, Boeing H, Huybrechts I, Crispim S, Slimani N. Review and evaluation of innovative technologies for measuring diet in nutritional epidemiology. Int J Epidemiol. 2012;41:1187–203.
[13] USDA. USDA database for the flavonoid content of selected foods. Beltsville, MD: USDA, 2003.
[14] USDA. USDA database for the isoflavone content of selected foods. Beltsville, MD: USDA, 1999.
[15] USDA. USDA database for the proanthocyanidin content of selected foods. Beltsville, MD: USDA, 2004.
[16] Neveu V, Pérez-Jiménez J, Vos F, Crespy V, du Chaffaut L, Mennen L, Knox C, Eisner R, Cruz J, Wishart D, et al. Phenol-Explorer: an online comprehensive database on polyphe-nol contents in foods. Database (Oxford) 2010;2010:bap024.
[17] Pérez-Jiménez J, Fezeu L, Touvier M, Arnault N, Manach C, Hercberg S, Galan P, Scalbert A. Dietary intake of 337 polyphenols in French adults. Am J Clin Nutr. 2011;93 (6):1220–8.
[18] Zamora-Ros R, Barupal D, Rothwell JA, Jenab M, Fedirko V, Romieu I, Aleksandrova K, Overvad K, Kyrø C, Tjønneland A, et al. Dietary flavonoid intake and colorectal cancer risk in the European Prospective Investigation into Cancer and Nutrition (EPIC) cohort. Int J Cancer. 2017;140(8):1836–1844.
[19] Lakenbrink C, Lapczynski S, Maiwald B, Engelhardt UH. Flavonoids and other poly-phenols in consumer brews of tea and other caffeinated beverages. J Agric Food Chem. 2000;48:2848–52.
[20] Johannot L, Somerset S M. Age-related variations in flavonoid intake and sources in the Australian population. Public Health Nutr. 2006;9(8):1045–54.
[21] Zamora-Ros R, Knaze V, Luján-Barroso L, Romieu I, Scalbert A, Slimani N, Hjartåker A, Engeset D, Skeie G, Overvad K, et al. Differences in dietary intakes, food sources and determinants of total flavonoids between mediterranean and non-mediterranean coun-tries participating in the European Prospective Investigation into Cancer and Nutrition (EPIC) study. Br J Nutr. 2013;109(8):1498–507.
[22] Chun OK, Chung SJ, Song, WO. Estimated dietary flavonoid intake and major food sources of US adults. J Nutr. 2007;137(5):1244–52.
[23] Zamora-Ros R, Biessy C, Rothwell JA, Monge A, Lajous M, Scalbert A, López-Ridaura R, Romieu I. Dietary polyphenol intake and their major food sources in the Mexican Teachers’ Cohort. J Acad Nutr & Diet. 2017; Submitted.
[24] Zhang Z, He L, Liu Y, Liu J, Su Y, Chen Y. Association between dietary intake of flavonoid and bone mineral density in middle aged and elderly Chinese women and men. Osteoporos Int. 2014;25(10):2417–25.
An Overview of Global Flavonoid Intake and its Food Sources
[25] Jun S, Shin S, Joung H. Estimation of dietary flavonoid intake and major food sources of Korean adults. Br J Nutr. 2016;115(3):480–9.
[26] Zamora-Ros R, Knaze V, Rothwell JA, Hémon B, Moskal A, Overvad K, Tjønneland A, Kyrø C, Fagherazzi G, Boutron-Ruault MC, et al. Dietary polyphenol intake in Europe: the European Prospective Investigation into Cancer and Nutrition (EPIC) study. Eur J Nutr. 2016;55(4):1359–75.
[27] Tresserra-Rimbau A, Medina-Remón A, Pérez-Jiménez J, Martínez-González MA, Covas MI, Corella D, Salas-Salvadó J, Gómez-Gracia E, Lapetra J, Arós F, et al. Dietary intake and major food sources of polyphenols in a Spanish population at high cardiovascular risk: The PREDIMED study. Nutr Metab Cardiovasc Dis. 2013;23(10):953–9.
[28] Ivey KL, Hodgson JM, Croft KD, Lewis JR, Prince RL. Flavonoid intake and all-cause mortality. Am J Clin Nutr. 2015;101(5):1012–20.
[29] Kent K, Charlton KE, Russell J, Mitchell P, Flood VM. Estimation of flavonoid intake in older Australians: Secondary Data Analysis of the Blue Mountains Eye Study. J Nutr Gerontol Geriatr. 2015;34(4):388–98.
[30] Vitale M, Masulli M, Rivellese AA, Bonora E, Cappellini F, Nicolucci A, Squatrito S, Antenucci D, Barrea A, Bianchi C, et al. Dietary intake and major food sources of poly-phenols in people with type 2 diabetes: the TOSCA.IT Study. Eur J Nutr. 2016. In press. doi: 10.1007/s00394-016-1355-1
[31] Ovaskainen ML, Törrönen R, Koponen JM, Sinkko H, Hellström J, Reinivuo H, Mattila P. Dietary intake and major food sources of polyphenols in Finnish adults. J Nutr. 2008;138 (3):562–6.
[32] Grosso G, Stepaniak U, Topor-Mądry R, Szafraniec K, Pająk A. Estimated dietary intake and major food sources of polyphenols in the Polish arm of the HAPIEE study. Nutrition. 2014;30(11–12):1398–403.
[33] Witkowska AM, Zujko ME, Waśkiewicz A, Terlikowska KM, Piotrowski W. Comparison of various databases for estimation of dietary polyphenol intake in the population of Polish adults. Nutrients. 2015;7(11):9299–308.
[34] Xiao Q, Park Y, Hollenbeck AR, Kitahara CM. Dietary flavonoid intake and thyroid cancer risk in the NIH-AARP diet and health study. Cancer Epidemiol Biomarkers Prev. 2014;23(6):1102–8.
[35] Cassidy A, O’Reilly ÉJ, Kay C, Sampson L, Franz M, Forman JP, Curhan G, Rimm EB. Habitual intake of flavonoid subclasses and incident hypertension in adults. Am J Clin Nutr. 2011;93(2):338–47.
[36] Wang Y, Chung SJ, Song WO, Chun OK. Estimation of daily proanthocyanidin intake and major food sources in the U.S. diet. J Nutr. 2011;141(3):447–52.
[37] Miranda AM, Steluti J, Fisberg RM, Marchioni DM. Dietary intake and food contributors of polyphenols in adults and elderly adults of Sao Paulo: a population-based study. Br J Nutr. 2016;115(6):1061–70.
Flavonoids - From Biosynthesis to Human Health 388
[38] Ma Y, Gao W, Wu K, Bao Y. Flavonoid intake and the risk of age-related cataract in China’s Heilongjiang Province. Food Nutr Res. 2015;59:29564.
[39] Sohrab G, Hosseinpour-Niazi S, Hejazi J, Yuzbashian E, Mirmiran P, Azizi F. Dietary polyphenols and metabolic syndrome among Iranian adults. Int J Food Sci Nutr. 2013;64 (6):661–7.
[40] Zamora-Ros R, Knaze V, Romieu I, Scalbert A, Slimani N, Clavel-Chapelon F, Touillaud M, Perquier F, Skeie G, Engeset D, et al. Impact of thearubigins on the estimation of total dietary flavonoids in the European Prospective Investigation into Cancer and Nutrition (EPIC) study. Eur J Clin Nutr. 2013;67(7):779–82.
[41] Kim K, Vance TM, Chun OK. Estimated intake and major food sources of flavonoids among US adults: changes between 1999–2002 and 2007–2010 in NHANES. Eur J Nutr. 2016;55(2):833–43.
[42] Barnes S. Soy isoflavones--phytoestrogens and what else? J Nutr. 2004;134(5):1225S–1228S. [43] Knaze V, Zamora-Ros R, Luján-Barroso L, Romieu I, Scalbert A, Slimani N, Riboli E, van
Rossum CT, Bueno-de-Mesquita HB, Trichopoulou A, et al. Intake estimation of total and individual flavan-3-ols, proanthocyanidins and theaflavins, their food sources and deter-minants in the European Prospective Investigation into Cancer and Nutrition (EPIC) study. Br J Nutr. 2012;108(6):1095–108.
[44] Yahya HM, Day A, Lawton C, Myrissa K, Croden F, Dye L, Williamson G. Dietary intake of 20 polyphenol subclasses in a cohort of UK women. Eur J Nutr. 2016;55(5):1839–47. [45] Vogiatzoglou A, Heuer T, Mulligan AA, Lentjes MAH, Luben RN, Kuhnle GGC.
Esti-mated dietary intakes and sources of flavanols in the German population (German National Nutrition Survey II). Eur J Nutr. 2014;53:635–43.
[46] Hanna KL, O’Neill S, Lyons-Wall PM. Intake of isoflavone and lignan phytoestrogens and associated demographic and lifestyle factors in older Australian women. Asia Pac J Clin Nutr. 2010;19(4):540–9.
[47] Mullie P, Clarys P, Deriemaeker P, Hebbelinck M. Estimation of daily human intake of food flavonoids. Plant Foods Hum Nutr. 2007;62(3):93–8.
[48] Zamora-Ros R, Knaze V, Luján-Barroso L, Kuhnle GG, Mulligan AA, Touillaud M, Slimani N, Romieu I, Powell N, Tumino R, Peeters PH, et al. Dietary intakes and food sources of phytoestrogens in the European Prospective Investigation into Cancer and Nutrition (EPIC) 24-hour dietary recall cohort. Eur J Clin Nutr. 2012;66(8):932–41
[49] Zamora-Ros R, Knaze V, Luján-Barroso L, Slimani N, Romieu I, Touillaud M, Kaaks R, Teucher B, Mattiello A, Grioni S, et al. Estimation of the intake of anthocyanidins and their food sources in the European Prospective Investigation into Cancer and Nutrition (EPIC) study. Br J Nutr. 2011;106(7):1090–9.
[50] Zamora-Ros R, Knaze V, Luján-Barroso L, Slimani N, Romieu I, Fedirko V, de Magistris MS, Ericson U, Amiano P, Trichopoulou A, et al. Estimated dietary intakes of flavonols, An Overview of Global Flavonoid Intake and its Food Sources
flavanones and flavones in the European Prospective Investigation into Cancer and Nutrition (EPIC) 24 hour dietary recall cohort. Br J Nutr. 2011;106(12):1915–25.
[51] Vogiatzoglou A, Mulligan AA, Luben RN, Lentjes MA, Heiss C, Kelm M, Merx MW, Spencer JP, Schroeter H, Kuhnle GG. Assessment of the dietary intake of total flavan-3-ols, monomeric flavan-3-flavan-3-ols, proanthocyanidins and theaflavins in the European Union. Brit J Nutr. 2013;111:1463–73.
[52] González S, Fernández M, Cuervo A, Lasheras C. Dietary intake of polyphenols and major food sources in an institutionalised elderly population. J Hum Nutr Diet. 2014;27 (2):176–83.
[53] Rossi M, Negri E, Parpinel M, Lagiou P, Bosetti C, Talamini R, Montella M, Attilio G, Franceschi S, Vecchia C La. Proanthocyanidins and the risk of colorectal cancer in Italy. Cancer Causes Control. 2010;21:243–50.
[54] Rossi M, Negri E, Talamini R, Bosetti C, Parpinel M, Gnagnarella P, Franceschi S, Dal Maso L, Montella M, Giacosa A, et al. Flavonoids and colorectal cancer in Italy. Cancer Epidemiol Biomarkers Prev. 2006;15:1555–8.
[55] Lagiou P, Samoli E, Lagiou A, Skalkidis Y, Katsouyanni K, Petridou E, Trichopoulos D. Flavonoid classes and risk of peripheral arterial occlusive disease: a case-control study in Greece. Eur J Clin Nutr. 2006;60(2):214–9.
[56] Theodoratou E, Kyle J, Cetnarskyj R, Farrington SM, Tenesa A, Barnetson R, Porteous M, Dunlop M, Campbell H. Dietary flavonoids and the risk of colorectal cancer. Cancer Epidemiol Biomarkers Prev. 2007;16:684–93.
[57] Frankenfeld CL, Patterson RE, Horner NK, Neuhouser ML, Skor HE, Kalhorn TF, Howald WN, Lampe JW. Validation of a soy food-frequency questionnaire and evalua-tion of correlates of plasma isoflavone concentraevalua-tions in postmenopausal women. Am J Clin Nutr. 2003;77(3):674–80.
[58] Hernández-Ramírez RU, Galván-Portillo MV, Ward MH, Agudo A, González CA, Oñate-Ocaña LF, Herrera-Goepfert R, Palma-Coca O, López-Carrillo L. Dietary intake of poly-phenols, nitrate and nitrite and gastric cancer risk in Mexico City. Int J Cancer. 2009;125 (6):1424–30.
[59] Galvan-Portillo MV, Wolff MS, Torres-Sánchez LE, López-Cervantes M, López-Carrillo L. Assessing phytochemical intake in a group of Mexican women. Salud Publica Mex. 2007;49(2):126–31.
[60] Nascimento-Souza MA, de Paiva PG, Pérez-Jiménez J, do Carmo Castro Franceschini S, Ribeiro AQ. Estimated dietary intake and major food sources of polyphenols in elderly of Viçosa, Brazil: a population-based study. Eur J Nutr. 2016. In press. doi: 10.1007/s00394-016-1348-0.
[61] Frankenfeld CL, Lampe JW, Shannon J, Gao DL, Ray RM, Prunty J, Kalhorn TF, Wähälä K, Patterson RE, Thomas DB. Frequency of soy food consumption and serum isoflavone concentrations among Chinese women in Shanghai. Public Health Nutr. 2004;7(6):765–72. Flavonoids - From Biosynthesis to Human Health
[62] Li G, Zhu Y, Zhang Y, Lang J, Chen Y, Ling W. Estimated daily flavonoid and stilbene intake from fruits, vegetables, and nuts and associations with lipid profiles in Chinese adults. J Acad Nutr Diet. 2013;113(6):786–94.
[63] Sun C, Wang H, Wang D, Chen Y, Zhao Y, Xia W. Using an FFQ to assess intakes of dietary flavonols and flavones among female adolescents in the Suihua area of northern China. Public Health Nutr. 2015;18:632–9.
[64] Li L, Zhang M, Holman CDAJ, Li L, Zhang M, Holman CDAJ. Population versus hospital controls in the assessment of dietary intake of isoflavone for case-control studies on cancers in China. Nutr Cancer. 2013;65(3):390–7.
[65] Hirayama F, Lee AH, Binns CW, Hiramatsu N, Mori M. Dietary intake of isoflavones and polyunsaturated fatty acids associated with lung function, breathlessness and the preva-lence of chronic obstructive pulmonary disease?: possible protective effect of traditional Japanese diet. Mol Nutr Food Res. 2010;54(7):909–17.
An Overview of Global Flavonoid Intake and its Food Sources