1
An in-depth look at DNA crystals through the
prism of molecular dynamics simulations
Antonija Kuzmanic1,2, Pablo D. Dans1,2, and Modesto Orozco1,2,3,4,*
1Institute for Research in Biomedicine (IRB Barcelona). The Barcelona Institute of Science
and Technology. Baldiri Reixac 10-12, 08028 Barcelona, Spain.
2Joint BSC-IRB Research Program in Computational Biology. Baldiri Reixac 10-12, 08028
Barcelona, Spain.
3Department of Biochemistry and Molecular Biology. University of Barcelona, 08028
Barcelona, Spain.
4Lead Contact
*Correspondence should be addressed to: Prof. Modesto Orozco, Tel: +34 934037155,
Email: [email protected].
SUMMARY
X-ray crystallography is the primary tool for the biomolecular structural determination. However, contacts formed through the crystal lattice are known to affect the structures, especially for small and flexible molecules like DNA oligomers, introducing significant structural changes in comparison to solution. Furthermore, why molecules crystallize in certain symmetry groups, which role crystallization additives play and whether they are just innocuous and unspecific crystallization catalysts remain unclear. By using one of the currently best performing DNA force fields and applying significant computational effort, we described the nature of intermolecular forces that stabilize B-DNA crystals in various symmetry groups and solvent environments with unprecedented level of detail. We showed a tight coupling between the lattice stability and the type of crystallization additives, and that certain symmetry groups are stable only in the presence of a specific additive. Additives and crystal contacts induce small but non-negligible changes in the physical properties of DNA.
2 INTRODUCTION
Ever since Linus Pauling laid the foundations of structural biology, X-ray crystallography has been the cornerstone method for solving biomolecular 3D structures. Over 130,000 models derived from X-ray data and deposited in the Protein Data Bank (PDB) (out of ~147,000 models) are the best witnesses of the power of this technique, which has also become the gold standard for validating other structural methods. However, just as any other method, X-ray crystallography has its own shortcomings and obtaining diffractable crystals is not always an easy task.1–3 Through robotic equipment, numerous variants of crystallization buffers are tested until a suitable one is found.4 However, why a given buffer promotes crystallization, what its influence is on the symmetry of the unit cell, as well as the overall structure and physical properties of the biomolecule, is typically unknown.
Thousands of X-ray derived DNA structures have been crucial in understanding the fine details of isolated and protein-bound DNAs.5–7 Unfortunately, artifacts in DNA crystals can lead to conformations which are otherwise undetected in solution. Even in ideal cases, such as the Drew-Dickerson dodecamer (DDD8,9), where crystal structures resemble the solution ones reasonably well, it is unclear how crystallization conditions modulate the symmetry space in which the molecule crystalizes, or the fine details of the structure and the physical properties of the DNA.1,2 Knowing the molecular interactions that stabilize the crystals would help to understand the actual properties of DNA in such systems and the mechanisms through which highly charged molecules are packed in severely crowded conditions, e.g. the cellular nucleus.
Here we use a new generation of supercomputers and a recently developed DNA force field10–12 to analyze the nature of DDD in three known crystal lattices and to explore the effects of crystallization additives on the stability of the crystals and the properties of the DNA.13–15 Through extensive unbiased MD simulations on the multi-microsecond timescale, we demonstrate how the stability of DNA crystals depends on subtle interactions between the packed DNA molecules and the components of the crystallization buffer. We obtained stable atomistic simulations of DNA crystals in biologically relevant timescales,16–21 in various symmetry groups (in which DDD has been crystallized), and in different solvent environments, which allowed us to understand with high level of detail the nature of intermolecular interactions that stabilize the crystals. Through the analysis of numerous simulations, we characterized the physical properties of DNA in a highly crowded environment and how the presence of additives affects them.
3 RESULTS AND DISCUSSION
Are the simulations of DNA crystals stable in the µs regime? The Drew-Dickerson dodecamer is a prototypical B-DNA molecule, whose structure has been determined by X-ray crystallography in various space groups and under diverse conditions,13–15 as well as through high-quality NMR data in solution. We chose to perform our simulations on structures crystallized in 3 different space groups: P3212, P212121, and H3 (PDB codes: 1EHV, 1FQ2, and 463D, respectively). We followed the multistep protocol developed by the Case group,17 which includes a careful stabilization of the internal pressure by calibrating the number of water molecules in the system (see the Supp. Methods section for details and Table S2). Once the internal pressure was adjusted, we ran microsecond long simulations of each crystal, which contained respectively 27, 24, and 36 copies of DDD (Table 1). To our surprise, two of our systems showed a systematic degradation of the crystal lattice, as shown by the center-of-mass (COM) displacements of each duplex with respect to the ideal positions in the crystal (Figure 1). The distortion of the lattice was particularly pronounced along the z-axis and got worse with simulation time for 1EHV and 1FQ2, while the 463D system was completely stable thorough the trajectory. Not only was the lattice intact in 463D, but the MD conformations sampled in the helical space on the base pair step (bps) level were in complete agreement with the average X-ray values (Figure 2), thus establishing that our force field is fully capable of representing local and global features of crystal structures.
We thus centered our efforts on stabilizing the other two crystals starting first with the smallest system: 1EHV. We simulated a larger crystal (81 instead of 27 DDD molecules) with 5 different Na/KCl concentrations (Table 1), ranging from 15 mM to 800 mM (i.e., up to 5 times the assumed physiological salt concentration of the cellular nucleus), without being able to stabilize it (Figure S1). Considering that the increase in crystal’s size had little effect on its stability (Figure S2), we decided to proceed with the smaller system (with 27 DDD copies). The addition of 400 mM MgCl2 produced some improvement in the lattice integrity, but its degradation was still evident during the 4-µs-long simulations (Figure S3 and Supp. Methods for more details). We thus checked if the global degradation of the crystals was due to internal distortions of the double helices by analyzing the 2D distributions of the bps helical parameters from MD simulations. We obtained a good agreement between the values calculated from MD simulations and the X-ray structures (Figure S4), which discards the notion that the lattice distortions were caused by the deterioration of duplex geometries. Even the flexible ends (residue pairs 1-24 and 12-13), which exhibit fast but moderate fraying in solution,11 had in most cases an average RMSD with respect to the X-ray structures under 4 Å, oscillating between 3D conformations compatible with the experimental electron density (Figure S5). We obtained similar results when trying to stabilize, without success,
4 the P212121 1FQ2 crystal (data not shown), which allowed us to discard the possibility of a force field artifact that is space-group specific.
How important are the buffer components in the stabilization of DNA crystals? As we had discarded any obvious explanation for the degradation of the crystal lattice, we focused our attention on the chemical additives used to obtain the DDD crystals in the studied space groups. We noticed that 463D system was crystallized without using spermine (SPM),15 while both 1EHV14 and 1FQ213 crystals were formed in the presence of this polyamine (+4 charge at pH 7). Spermine is normally found in all eukaryotic cells and has been used as an “inert molecular glue” for obtaining thousands of DNA crystals in all the major forms (A, B, Z, etc.).19,20,22 However, the molecular basis of its mechanism of action is mostly unknown, and in fact, spermine electron densities are often absent from the crystal. To check whether the lack of spermine in our simulations was the reason of the degradation of P3212 and P212121 simulations, we repeated the simulations for both crystals at three different spermine concentrations ranging from 1:3 (3 spermine molecules per duplex) up to 1:12 (Table 1). At last, the lattice integrity for both space groups was now preserved in a consistent concentration dependent manner (Figure 3). At the medium spermine concentration tested, 1:9 for 1EHV and 1:6 for 1FQ2, the observed stability is already comparable to the one obtained for 463D with no perceptible drift of the crystal lattice along the y/z-axes (Figures S6 and S7). Clearly the “inert molecular glue” has a major role in preserving the integrity of some of the crystal lattices.
Similarly to 463D, once properly stabilized, we obtained an impressive agreement between the X-ray structures (1EHV/1FQ2) and the MD crystals. This is visible when comparing the rotational helical space (Figure 4), or the groove dimensions, a property which has always been difficult to reproduce accurately by modern force fields (Figure S8). The dynamics of the end residues also seems to be stable according to their RMSD values, which are typically below 2 Å with respect to the crystal position (Figures S9 and S10). In the end, to illustrate the observed structural agreement, we also compared the average structures obtained from crystal MD simulations with the deposited X-ray structure for the three systems stabilized in the µs regime is shown in Figure S11.
To follow each ion along the trajectories of each duplex, we used the curvilinear helicoidal coordinate (CHC)23 method as implemented in Canion/Curves+, which allowed us to calculate ion populations and concentrations in the inner and outer areas of major and minor grooves of DNA duplexes (see Supp. Methods).24,25 We found that the sequence-dependent binding sites observed for K+ and the amino groups of spermine were the same in solution and in crystals, although the sequence dependence was weaker in crystals and the cation distributions seem to be fuzzier (Figure S12).11 The comparison of aqueous simulations with and without spermine (left column in Figure S12) showed that spermine mainly
5 localizes outside the grooves, which was also previously observed in crystal simulations.19,20,22,26 Interestingly, the interiors of the grooves are depleted of cations in all crystal simulations compared to the solution phase.
We also analyzed the cation environment in all the individual duplexes present in each crystal. First, a clear similarity was found in the cation distribution in all the duplexes of a given crystal, confirming the robustness of the average results discussed here (see Suppl. Figures S13-15). Second, spermine distribution was similar around the duplexes in simulations of two different space groups (1EHV and 1FQ2), indicating that the ion distribution is independent of the crystal packing (see Figures S14 and S15). Moreover, spermine mostly preferred the exterior of the central part of the major groove, however, upon entering the groove, spermine was located at non-central sites, which we also observed for solution simulations (see Suppl. Figure S12). Spermine could concentrate up to 12 M around the phosphate groups in the central portion of the duplexes where no DNA intermolecular contacts are present. In contrast, these contacts are particularly pronounced in terminal bases (Figure S16). In summary, spermine has a tendency to move around the exterior of the duplex without any perceptible sequence dependence (as observed in NMR27 and RAMAN28 experiments), most likely screening intermolecular phosphate-phosphate repulsion and facilitating crystal packing. Combined with its rare long-term presence within the insides of the grooves, it is not surprising that spermine electron density is seldom captured. While the temperature for both experiments and MD simulations was in the 284-293 K range for 1EHV, 1FQ2, and 463D (see Supp. Methods), the intermolecular DNA contacts in the crystal froze the duplex structure. DNA’s internal effective temperature was lowered by 200 K (with respect to the thermostat temperature) at the end of the duplexes, which are mostly rigidified, while we observed only ~50 K decrease in the central portion of the duplex (Figure S17). Water molecules and SPM are also affected by the crowded and highly negatively charged environment produced by the packing of the backbone phosphate groups of neighboring duplexes. The rescaled diffusion coefficient29 of water molecules (Figure S18 and Supp. Methods), was reduced by one order of magnitude - from 1.70·10-5 cm2 s-1 in solution DNA simulations to 1.67·10-6 cm2 s-1 in crystal simulations. The reduction in water mobility is visible from a 30-K decrease in its effective temperature. Furthermore, water mobility in crystals is anisotropic, with the preference for the z-axis in 463D and 1EHV, and the y-axis in 1FQ2 following the water channels that are created in each crystal due to the orientation of the duplexes (Figure S19). The effect was even more pronounced for SPM when comparing the 1FQ2 1:6 solution simulations with the 1FQ2 crystal with the same SPM concentration: the diffusion coefficient in the crystal was reduced by three orders of magnitude compared to the solution: from 1.90·10-6 cm2 s-1 to 2.62·10-9 cm2 s-1. Although the mobility of SPM is greatly reduced in the crystal, the lack of specificity in its binding to DNA (extensive and non-specific binding outside the major groove) makes its detection
6 in the experimental electron densities very difficult (see Suppl. Figure S12). As expected, the diffusion of water and SPM in the crystal was correlated and exhibited an SPM-concentration dependent effect as shown in Figure S20.
How do the structural and dynamical properties of DNA crystals compare with solution? We computed the global RMSD of MD simulations (crystal and solution) with respect to the experimental crystal configuration (Table 2). Our calculation expectedly showed that the average MD structure in solution deviates much more from the X-ray structure (with larger deviations in the backbone) than the average conformation from the crystal MD simulations.17 However, for all three system, we obtained an excellent agreement for the internal 10 base pairs, with the RMSD in all cases under 0.9 Å (even 0.52 Å for 1FQ2), ratifying that MD simulations are able to capture the effect of the crystal environment on the DNA. Irrespectively of the original conformation present in the crystal, when we transferred the duplexes to solution, all the simulations converged to the same ensemble that was previously described by multi-microsecond simulations of DDD,11,12,30 showing a strong consensus, and the lack of memory in the simulations (Figure S21 and S22). Moreover, as confirmed by WAXS experiments,22 SPM has a negligible effect on the structure of DNA in aqueous solution (Figure S21 and S22). As shown in Figure 5, the solution simulations were generally able to sample the X-ray values within the first standard deviation, indicating that the overall structures in solution and in the crystal are very similar. However, a close inspection shows small local discrepancies between the average MD solution simulations and the X-ray values at several bps, although these differences (Figure S23 and S24) tend to disappear when average properties of the entire duplex are computed.11
We also analyzed how crystal modifies the flexibility and dynamical behavior of the duplex. As expected, DNA in crystals was much more rigid than in solutions, which can be seen from the force constants associated with helical deformations. As expected from helical parameters, the differences are especially pronounced for the terminal residues which are much more mobile in water (Figure S25). Interestingly, same sequence-dependent pattern of flexibility is found for the crystal and solution simulations - for all degrees of freedom and for all studied crystals. This suggests that the strong reduction of terminal movements is a consequence of the specific DNA packing required for crystallization. The analysis of the essential dynamics (see Methods) of DNA in solution and in the crystal indicates a high degree of similarity: 93-98% for solution vs solution simulations, while the similarity decreases to 78-95% for crystal vs crystal MD comparisons, and to 75-84% when comparing crystal to solution (Figure S26). This finding suggests that the essential dynamics of the duplexes in the crystals slightly differs from the one in solution, and that the variability in the type of movements between different crystal lattices is larger than in solution. These results indicate that the small structural discrepancies in the average helical parameters, discussed above, arose from dynamic, rather than static, properties of the DNA. However, they also
7 suggest a reasonable maintenance of the intrinsic deformation pattern of DNA in crystals, which would explain how processes which require deformation of the DNA can be reproduced (on longer timescales) in crystal environments, e.g., binding of small molecules in soaking experiments.31,32
We finally focused our analysis on two paradigmatic structural polymorphisms that seem to be causally connected in solution, namely the backbone BI/BII polymorphism (related to ε and ζ torsions), and the bimodal behavior of the twist helical parameter observed for d(CpG) steps.11,24,33–35 BII populations are detected in both crystal and solution simulations, but the base pair steps for which such minor populations were observed are different (Figure 27). In agreement with the experiments (X-ray and 1H/31P-NMR),36 BII state was observed less frequently for d(CpG) and d(GpA) steps in the crystal than in the solution simulations, while the opposite was observed for d(GpC) steps. Quite similar results were observed for d(ApA) and d(ApT) steps. This would suggest that the differences in BII propensities between X-ray and NMR structures are not spurious effects related to the uncertainties of the refinement process, but a consequence of crystal packing. As expected from previous studies,37 when transferred to solution, the BI/BII propensities observed in the crystals converged to the solution ones in the sub-microsecond timescale.
Polymorphisms at the base level (i.e. the existence of two stable conformational substates) were much more difficult to detect experimentally.38 On the one hand, NOEs often lack the required resolution to introduce dual restraints in the simulation procedure, and on the other hand, “substate-washing-effect” produced by the averaging of structures present in the crystal annihilate minor substates in the final refined structures.38,39 As we have individual data for each duplex in the crystal, we can analyze minor polymorphism with high accuracy. Thus, we explored the twist polymorphism at the d(CpG) step for the three simulated crystals and compared the results to the solution trajectories. We found that the bimodal behavior was mitigated in the crystals due to both averaging effects and a lower propensity for the bimodal twist (Figures 28-30).24,35 The two and three substates observed in the 2D density plots of roll vs twist and twist vs tilt, respectively, were all found among the duplexes present in the crystal units, but not simultaneously in a unique duplex as in the solution simulations. This correlated perfectly with the reduced amount of cations found inside the minor groove of d(CpG) steps in the crystals simulations,24 and with the smaller mobility of crystal DNA that reduces the kinetics of substate inter-conversion. These results suggest that the solvent environment created around the duplexes in the crowded crystal affects the DNA dynamics and limits its conformational space compared to the free DNA in solution. Therefore, taking extra caution is necessary before using X-ray data to evaluate small-scale polymorphisms which can be crucial for DNA recognition by ligands.
8 CONCLUSIONS
Even with recent advances in cryoEM, X-ray crystallography remains a dominant technique in structural biology that shows no signs of slowing down. However, one of its main challenges still lies in obtaining diffractable crystals. Conditions that lead to such crystals are a priori unknown and the knowledge gained in the field has been mainly empirical. Typically, several types of solvent buffers are usually tried out but since the electron density of ions and chemical additives is rarely observed, it has been impossible to know which buffer components finally end up in the crystal and at which concentration. For example, spermine has been used to obtain thousands of DNA crystals, yet the molecular basis of its mechanism of action was mostly unknown until now. Furthermore, atomistic MD simulations were not able to provide relevant information on the intermolecular forces that dominate within the crystal structure, due to issues with obtaining stable crystal simulations on relevant timescales. In this work, we presented the first stable multi-microsecond long MD simulations of crystals of the Drew-Dickerson dodecamer in all the symmetry groups it has been experimentally crystallized in. We achieved this by using one the latest generation classical force fields and by modeling correctly the solvent environment around DNA duplexes which allowed us to understand the importance of chemical additives in the crystallization buffer. Once stable, an impressive global and local structural agreement was obtained between the modeled and experimental DNA crystals. This allowed us to unravel the interactions and physical properties of water molecules, ions and spermine at the atomic level, giving their quantifiable overview. Water molecules and spermine diffused 10 and 1,000 times more slowly in the crowded crystal environment than in solution, respectively. Most of the spermine molecules, which could concentrate up to 12 M around DNA, were bound to phosphate groups outside of the major groove without a specific sequence dependence. Moreover, we showed that previous discrepancies in local structure between solution simulations and X-ray structures, or the ones between solution NMR and X-ray structures in the description of the backbone polymorphism, were mainly due to packing effects that modify the solvent-solute interactions, affecting the dynamics of the DNA and limiting its conformational space compared to its free behavior in solution. Our work expands the limits of the field and opens the door to further systematic studies of the effect of crystallization conditions on the obtained structures. In the near future, MD simulations of crystals could be used to anticipate and predict the effects of a given additive, reducing the number of trial and error iterations usually involved in the experimental obtainment of stable DNA crystals.
9 EXPERIMENTAL PROCEDURES
Systems setup. X-ray structures of the Drew-Dickerson dodecamer used as the starting conformations in the unbiased MD simulations are those deposited under PDB codes 1EHV (1.8-Å resolution),14 1FQ2 (1.2-Å resolution),13 and 463D (1.45-Å resolution).15 Both 1EHV and 1FQ2 entries contain the full DNA duplex, while the 5’ cytosines are missing in 463D and were modelled in with PyMOL v1.8.240 by
using 1EHV as the template. The dodecahedral simulation boxes for solution systems (labelled sol) were created by solvating a single DNA duplex with TIP3P water molecules,41,42 leaving a 10-Å solvent layer around the duplex (~20,000 atoms). K+, Na+, and Cl- ions (Smith and Dang parameters)43,44 were added to reach neutrality and the final concentration of 400 mM (with 4:3 potassium to sodium ratio). In the case of 1FQ2 1:6 sol system, 6 spermine molecules were randomly added prior to solvation with TIP3P water and neutrality was reached with Cl -ions. For the crystal systems, the simulation boxes were built following the dimensions of the unit cells reported in the PDB using PyMOL v1.8. The Na/KCl and MgCl2 systems were completed by first adding TIP3P water and then the ions to reach neutrality and the final concentrations listed in Tables 1 and S1 (using Smith and Dang43,44 parameters for Na/KCl systems and Allnér-Nilsson-Villa45 parameters for MgCl2). The SpmCl4 and MgCl2∙6H2O crystal systems were completed by first randomly adding spermine or hexacoordinated Mg2+ ions (using Yoo and Aksimentiev46,47 parameters, quantities in Tables 1 and S1), then TIP3P waters followed by monovalent counter ions. System sizes ranged from 44,000-60,000 atoms for the smaller crystals, while the 1EHV systems with 81 duplexes had ~170,000 atoms.
Relaxation and equilibration of the systems. Energy of the simulated systems (listed in Table 1) was initially minimized through steepest-descent energy minimization. The initial velocities for the atoms were taken from Maxwell distribution at 100 K and the systems were subsequently heated to the final temperature (corresponding to the temperatures at which the crystals were grown; Table 1) in five steps of ~50 K simulated for either 100 or 1000 ps at constant volume and temperature using velocity rescale thermostat.48 In parallel, atomic position restraints for the DNA molecules were uniformly relaxed. To achieve internal pressure close to 1 bar in crystal simulations, additional TIP3P water molecules were randomly placed within each system, which was first minimized and equilibrated, and then 50-ns production simulations were run, in a trial and error process until a suitable pressure was obtained (see Supp. Methods for further details).
Production trajectories. Once simulation conditions matched those expected in the crystal or in solution, production runs (1-4 µs long) were generated using GROMACS 5.0.4 biomolecular simulation package49 with a 2-fs integration step and coordinate output of 10 ps. Constant volume conditions were employed for the
10 crystal simulations, while the constant pressure (1 bar) was used in solution simulations. All simulations were done at constant temperature (284-295 K depending on the reported crystallization conditions). Parrinello-Rahman barostat50 and velocity rescale thermostat were used.48 Periodic boundary conditions and particle mesh Ewald51 were used in conjunction with state-of-the-art simulation conditions. DNA was described using the recently developed parmbsc1 force field.10 See Methods for additional details of the simulations.
Analysis. Center of mass (COM) displacements were calculated after the optimal roto-translational fitting of the whole system to the ideal crystal. RMSD values were calculated for each duplex after the optimal roto-translational fitting to the original X-ray structures (see Suppl. Methods for details). Diffusion coefficients were calculated from a linear fit of mean square displacements over time using Einstein’s equation. The effective temperature of water molecules in crystals was estimated from the corresponding diffusion coefficients which were first scaled by 1/2.56 (to account for the overestimation of the water diffusion by the TIP3P water model) as described in our previous work,29 while effective DNA temperature was inferred at the base pair step level from the analysis of helical covariance matrices, which provided the stiffness matrices associated to harmonic deformations in the helical space.52 Essential dynamics was determined by the diagonalization of the Cartesian covariance matrices. Similarity in essential deformation modes were computed using Hess53 and Pérez et al. metrics,52 without considering the capping base pairs. Additional details on the analysis and the associated packages are shown in Suppl. Methods.
Data availability. All trajectories reported here are deposited in the BigNASim54 database and can be freely downloaded: http://www.irbbarcelona.org/BIGNASim/
SUPPLEMENTARY DATA
Further details on the setup and analysis of the trajectories, and additional results are provided in the Supplementary Methods, Figures and Tables respectively.
ACKNOWLEDGEMENTS
M.O. is an ICREA (Institucio Catalana de Recerca i Estudis Avançats) academia researcher. P.D.D. is a PEDECIBA (Programa de Desarrollo de las Ciencias Ba sicas) and SNI (Sistema Nacional de Investigadores, Agencia Nacional de Investigacio n e Innovacio n, Uruguay) researcher. Funding: Spanish Ministry of Science [BFU2014-61670-EXP, BFU2014-52864-R], Catalan SGR, the Instituto Nacional de Bioinforma tica; European Research Council (ERC SimDNA), European Union's Horizon 2020 research and innovation program [676556], Biomolecular and Bioinformatics Resources Platform (ISCIII PT 13/0001/0030) co-funded by the
11 Fondo Europeo de Desarrollo Regional (FEDER) (all awarded to M.O.); MINECO Severo Ochoa Award of Excellence (Government of Spain) (awarded to IRB Barcelona). The project was awarded computer resources from the PRACE 12th call (awarded to A.K., P.D.D. and M.O.).
AUTHOR CONTRIBUTIONS
Original Idea, P.D.D.; Conceptualization, A.K., P.D.D., M.O.; Investigation, A.K.; Formal Analysis, A.K., P.D.D.; Visualization, A.K.; Resources, P.D.D., M.O.; Writing - Original Draft, P.D.D.; Writing - Reviewing & Editing, A.K., P.D.D., M.O.; Supervision, P.D.D., M.O.; Funding Acquisition, M.O.
DECLARATION OF INTERESTS The authors declare no competing interests.
REFERENCES AND NOTES
1. Zheng, J. et al. (2009). From molecular to macroscopic via the rational design of a self-assembled 3D DNA crystal. Nature 461, 74–77.
2. Zhang, W., Szostak, J. W. and Huang, Z. (2016). Nucleic acid crystallization and X-ray crystallography facilitated by single selenium atom. Front. Chem. Sci. Eng. 10, 196–202.
3. Saenger, W. (1984). Methods: X-Ray Crystallography, Potential Energy Calculations, and Spectroscopy. In Principles of Nucleic Acid Structure, W. Saenger, ed. (Springer-Verlag New York), pp 29-50.
4. Yeung, H. et al. (2016). Radiation Damage and Racemic Protein
Crystallography Reveal the Unique Structure of the GASA/Snakin Protein Superfamily. Angew. Chemie Int. Ed. 55, 7930–7933.
5. Mooers, B. H. M. (2009). Crystallographic studies of DNA and RNA. Methods 47, 168–176.
6. Westhof E. (2016) Perspectives and Pitfalls. In Nucleic Acids Crystallography, E. Ennifar, ed. (Humana Press New York), pp 3-8.
7. Egli, M. (2004). Nucleic acid crystallography: current progress. Curr. Opin. Chem. Biol. 8, 580–591.
8. Drew, H. R. et al. (1981). Structure of a B-DNA dodecamer: conformation and dynamics. Proc. Natl. Acad. Sci. U. S. A. 78, 2179–2183.
9. Drew, H. ., Samson, S. and Dickerson, R. E. (1982). Structure of a B-DNA dodecamer at 16 K. Proc.Natl.Acad.Sci.USA 79, 4040–4044.
10. Ivani, I. et al. (2015). Parmbsc1: A refined force field for DNA simulations. Nat. Methods 13, 55–58.
11. Dans, P. D. et al. (2016). Long-timescale dynamics of the Drew-Dickerson dodecamer. Nucleic Acids Res. 44, 4052–4066.
12 Nucleic Acids Res. 45, 4217–4230.
13. Sines, C. C., McFail-Isom, L., Howerton, S. B., VanDerveer, D., and Williams, L. D. (2000). Cations Mediate B-DNA Conformational Heterogeneity. J. Am. Chem. Soc. 122, 11048–11056.
14. Johansson, E., Parkinson, G. and Neidle, S. (2000). A new crystal form for the dodecamer C-G-C-G-A-A-T-T-C-G-C-G: symmetry effects on
sequence-dependent DNA structure. J. Mol. Biol. 300, 551–561.
15. Liu, J. and Subirana, J. A. (1999). Structure of d(CGCGAATTCGCG) in the presence of Ca(2+) ions. J. Biol. Chem. 274, 24749–24752.
16. York, D. M., Yang, W., Lee, H., Darden, T. and Pedersen, L. G. (1995). Toward the Accurate Modeling of DNA: The Importance of Long-Range Electrostatics. J. Am. Chem. Soc. 117, 5001–5002.
17. Liu, C., Janowski, P. A. and Case, D. A. (2015). All-atom crystal simulations of DNA and RNA duplexes. Biochim. Biophys. Acta 1850, 1059–1071.
18. Babin, V., Baucom, J., Darden, T. A. and Sagui, C. (2006). Molecular dynamics simulations of polarizable DNA in crystal environment. Int. J. Quantum Chem. 106, 3260–3269.
19. Korolev, N., Lyubartsev, A. P., Nordenskiöld, L. and Laaksonen, A. (2001). Spermine: an “invisible” component in the crystals of B-DNA. A grand
canonical Monte Carlo and molecular dynamics simulation study. J. Mol. Biol. 308, 907–917.
20. Korolev, N., Lyubartsev, A. P., Laaksonen, A. and Nordenskiöld, L. (2002). On the competition between water, sodium ions, and spermine in binding to DNA: a molecular dynamics computer simulation study. Biophys. J. 82, 2860– 2875.
21. Korolev, N., Lyubartsev, A. P., Laaksonen, A. and Nordenskiöld, L. (2003). A molecular dynamics simulation study of oriented DNA with polyamine and sodium counterions: diffusion and averaged binding of water and cations. Nucleic Acids Res. 31, 5971–5981.
22. Katz, A. M. et al. (2017). Spermine Condenses DNA, but Not RNA Duplexes. Biophys. J. 112, 22–30.
23. Lavery, R., Maddocks, J. H., Pasi, M. and Zakrzewska, K. (2014). Analyzing ion distributions around DNA. Nucleic Acids Res. 42, 8138–8149.
24. Dans, P. D. et al. (2014). Unraveling the sequence-dependent polymorphic behavior of d(CpG) steps in B-DNA. Nucleic Acids Res. 42, 11304–11320. 25. Pasi, M., Maddocks, J. H. and Lavery, R. (2015). Analyzing ion distributions
around DNA: sequence-dependence of potassium ion distributions from microsecond molecular dynamics. Nucleic Acids Res. 43, 2412–2423. 26. Yoo, J. and Aksimentiev, A. (2016). The structure and intermolecular forces
of DNA condensates. Nucleic Acids Res. 44, 2036–2046.
27. Wemmer, D. E., Srivenugopal, K. S., Reid, B. R. and Morris, D. R. (1985). Nuclear magnetic resonance studies of polyamine binding to a defined DNA sequence. J. Mol. Biol. 185, 457–459.
28. Deng, H., Bloomfield, V. A., Benevides, J. M., Thomas, G. J. and Jr. (2000). Structural basis of polyamine-DNA recognition: spermidine and spermine interactions with genomic B-DNAs of different GC content probed by Raman spectroscopy. Nucleic Acids Res. 28, 3379–3385
29. Hospital, A., Candotti, M., Gelpí, J. L. and Orozco, M. (2017). The Multiple Roles of Waters in Protein Solvation. J. Phys. Chem. B 121, 3636–3643.
13 30. Galindo-Murillo, R. et al. (2016). Assessing the Current State of Amber Force
Field Modifications for DNA. J. Chem. Theory Comput. 12, 4114–4127. 31. Das, K., Martinez, S. E., Bauman, J. D. and Arnold, E. (2012). HIV-1 reverse
transcriptase complex with DNA and nevirapine reveals non-nucleoside inhibition mechanism. Nat. Struct. Mol. Biol. 19, 253–259.
32. Burmeister, W. P. et al. (2015). Crystal Structure of the Vaccinia Virus Uracil-DNA Glycosylase in Complex with Uracil-DNA. J. Biol. Chem. 290, 17923–17934. 33. Hartmann, B., Piazzola, D. and Lavery, R. (1993). BI-BII transitions in B-DNA.
Nucleic Acids Res. 21, 561–568.
34. Balaceanu, A. et al. (2017). The Role of Unconventional Hydrogen Bonds in Determining BII Propensities in B-DNA. J. Phys. Chem. Lett. 8, 21–28. 35. Pasi, M. et al. (2014). μABC: A systematic microsecond molecular dynamics
study of tetranucleotide sequence effects in B-DNA. Nucleic Acids Res. 42, 12272–12283.
36. Heddi, B., Oguey, C., Lavelle, C., Foloppe, N. and Hartmann, B. (2009).
Intrinsic flexibility of B-DNA: The experimental TRX scale. Nucleic Acids Res. 38, 1034–1047.
37. Robertson, J. C. and Cheatham, T. E. (2015). DNA Backbone BI/BII
Distribution and Dynamics in E2 Protein-Bound Environment Determined by Molecular Dynamics Simulations. J. Phys. Chem. B 119, 14111–14119. 38. Maehigashi, T. et al. (2012). B-DNA structure is intrinsically polymorphic:
even at the level of base pair positions. Nucleic Acids Res. 40, 3714–3722. 39. Kuzmanic, A., Pannu, N. S. and Zagrovic, B. (2014). X-ray refinement
significantly underestimates the level of microscopic heterogeneity in biomolecular crystals. Nat. Commun. 5, 3220.
40. Schrodinger, L. L. C. (2015). The PyMOL Molecular Graphics System.
41. Jorgensen, W. L., Chandrasekhar, J., Madura, J. D., Impey, R. W. and Klein, M. L. (1983). Comparison of simple potential functions for simulating liquid water. J. Chem. Phys. 79, 926–935.
42. Mahoney, M. W. and Jorgensen, W. L. (2000). A five-site model for liquid water and the reproduction of the density anomaly by rigid, nonpolarizable potential functions. J. Chem. Phys. 112, 8910–8922.
43. Smith, D. E. and Dang, L. X. (1994). Computer simulations of NaCl association in polarizable water. J. Chem. Phys. 100, 3757–3766.
44. Dang, L. X. (1995). Mechanism and Thermodynamics of Ion Selectivity in Aqueous Solutions of 18-Crown-6 Ether: A Molecular Dynamics Study. J. Am. Chem. Soc. 117, 6954–6960.
45. Allnér, O., Nilsson, L. and Villa, A. (2012). Magnesium Ion–Water
Coordination and Exchange in Biomolecular Simulations. J. Chem. Theory Comput. 8, 1493–1502.
46. Yoo, J. and Aksimentiev, (2012). A. Improved Parametrization of Li+ , Na+ , K+, and Mg2+ Ions for All-Atom Molecular Dynamics Simulations of Nucleic Acid Systems. J. Phys. Chem. Lett. 3, 45–50.
47. Yoo, J. and Aksimentiev, A. (2016). Improved Parameterization of Amine– Carboxylate and Amine–Phosphate Interactions for Molecular Dynamics Simulations Using the CHARMM and AMBER Force Fields. J. Chem. Theory Comput. 12, 430–443.
48. Bussi, G., Donadio, D. and Parrinello, M. (2007). Canonical sampling through velocity rescaling. J. Chem. Phys. 126, 014101.
14 49. Abraham, M. J. et al. (2015). GROMACS: High performance molecular
simulations through multi-level parallelism from laptops to supercomputers. SoftwareX 1–2, 19–25.
50. Parrinello, M. and Rahman, A. (1981). Polymorphic transitions in single crystals: A new molecular dynamics method. J. Appl. Phys. 52, 7182–7190. 51. Darden, T., York, D. and Pedersen, L. (1993). Particle mesh Ewald: An N ⋅log(
N ) method for Ewald sums in large systems. J. Chem. Phys. 98, 10089– 10092.
52. Pérez, A. et al. (2005). Exploring the Essential Dynamics of B-DNA. J. Chem. Theory Comput. 1, 790–800.
53. Hess, B. (2000). Similarities between principal components of protein dynamics and random diffusion. Phys. Rev. E. Stat. Phys. Plasmas. Fluids. Relat. Interdiscip. Topics 62, 8438–8448.
54. Hospital, A. et al. (2016). BIGNASim: A NoSQL database structure and analysis portal for nucleic acids simulation data. Nucleic Acids Res. 44, D272–D278.
FIGURE LEGENDS
Figure 1. A) COM displacements from the ideal crystallographic positions shown for each duplex in the simulated supercell systems (1EHV, 1FQ2, 463D) along principal axes. Points are colored in greyscale according to the smooth 2D densities, estimated by fitting the observed distributions to a bivariate normal kernel (evaluated on a square grid of 90 × 90 bins). Density distributions for each axis are also shown in the margins. Four isodensity curves are shown in white and are quantified on the bottom right side of each plot. The average positions of the duplexes are given as colored circles. B) COM displacements in time along the z-axis shown for all three systems. Mean values are shown as black lines, standard deviations are shown as dark grey ribbons, while the extreme values are shown with light grey ribbons (lower panels).
Figure 2. Rotational helical parameters (roll, twist, tilt) of all the duplexes in the 463D system (given for distinct base pair steps in DDD after removing the ends). The values calculated from the X-ray structure are shown with purple lines. Points are colored according to the smooth 2D densities, estimated by fitting the observed distributions to a bivariate normal kernel (evaluated on a square grid of 90 × 90 bins). Four isodensity curves are shown in white and are quantified on the bottom right side of each plot.
Figure 3. COM displacements from the ideal crystallographic positions for different spermine concentrations in A) 1EHV and B) 1FQ2 systems. The upper panels show the COM displacements in time along the z-axis where mean values are shown as black lines, standard deviations are shown as dark grey ribbons, while the extreme values are shown with light grey ribbons. The lower panels show COM displacements shown for each duplex along y and z axes with the
15 average positions of the duplexes given as colored circles. Points are colored in greyscale according to the smooth 2D densities, estimated by fitting the observed distributions to a bivariate normal kernel (evaluated on a square grid of 90 × 90 bins). Density distributions for each axis are also shown in the margins. Four isodensity curves are shown in white and are quantified on the bottom right side of each plot.
Figure 4. Rotational helical parameters (roll, twist, tilt) (given for all base pair steps in DDD after removing the ends) for different spermine concentrations in A) 1EHV and B) 1FQ2 systems. The upper panels show average values across all duplexes for varying spermine concentrations (colored green), with the purple line giving values calculated for the X-ray structure. The lower panels show the average values for each duplex in the systems with the highest spermine concentration (shown as green circles), while the average over all duplexes is shown as a black line and the X-ray values in purple.
Figure 5. Translational (shift, slide, rise) and rotational (roll, twist, tilt) helical parameters (given for all base pair steps in DDD after removing the ends) for the solution simulations of single duplexes starting from different X-ray structures. The average values across the simulations are shown in black, while the average standard deviations are shown as grey ribbons. Values calculated from X-ray models are shown as colored lines.
16 TABLES
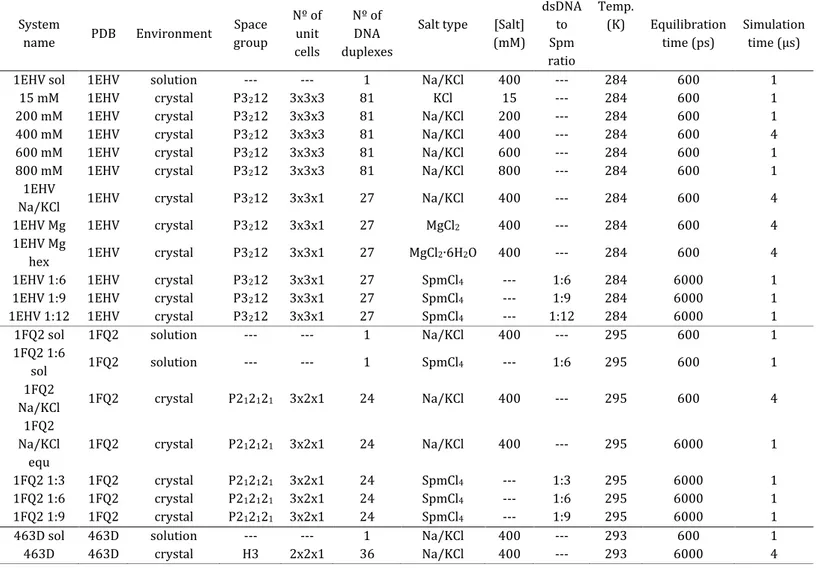
Table 1. Studied systems and simulated conditions.
System name PDB Environment Space group Nº of unit cells Nº of DNA duplexes
Salt type [Salt] (mM) dsDNA to Spm ratio Temp. (K) Equilibration time (ps) Simulation time (μs)
1EHV sol 1EHV solution --- --- 1 Na/KCl 400 --- 284 600 1
15 mM 1EHV crystal P3212 3x3x3 81 KCl 15 --- 284 600 1
200 mM 1EHV crystal P3212 3x3x3 81 Na/KCl 200 --- 284 600 1
400 mM 1EHV crystal P3212 3x3x3 81 Na/KCl 400 --- 284 600 4
600 mM 1EHV crystal P3212 3x3x3 81 Na/KCl 600 --- 284 600 1
800 mM 1EHV crystal P3212 3x3x3 81 Na/KCl 800 --- 284 600 1
1EHV
Na/KCl 1EHV crystal P3212 3x3x1 27 Na/KCl 400 --- 284 600 4
1EHV Mg 1EHV crystal P3212 3x3x1 27 MgCl2 400 --- 284 600 4
1EHV Mg
hex 1EHV crystal P3212 3x3x1 27 MgCl2∙6H2O 400 --- 284 600 4 1EHV 1:6 1EHV crystal P3212 3x3x1 27 SpmCl4 --- 1:6 284 6000 1
1EHV 1:9 1EHV crystal P3212 3x3x1 27 SpmCl4 --- 1:9 284 6000 1
1EHV 1:12 1EHV crystal P3212 3x3x1 27 SpmCl4 --- 1:12 284 6000 1
1FQ2 sol 1FQ2 solution --- --- 1 Na/KCl 400 --- 295 600 1
1FQ2 1:6
sol 1FQ2 solution --- --- 1 SpmCl4 --- 1:6 295 600 1
1FQ2
Na/KCl 1FQ2 crystal P212121 3x2x1 24 Na/KCl 400 --- 295 600 4 1FQ2 Na/KCl equ 1FQ2 crystal P212121 3x2x1 24 Na/KCl 400 --- 295 6000 1 1FQ2 1:3 1FQ2 crystal P212121 3x2x1 24 SpmCl4 --- 1:3 295 6000 1 1FQ2 1:6 1FQ2 crystal P212121 3x2x1 24 SpmCl4 --- 1:6 295 6000 1 1FQ2 1:9 1FQ2 crystal P212121 3x2x1 24 SpmCl4 --- 1:9 295 6000 1
463D sol 463D solution --- --- 1 Na/KCl 400 --- 293 600 1
17 Table 2. Root mean square deviations (RMSD, Å) from the deposited crystal structures for 463D, 1EHV, and 1FQ2. The statistics in each box are heavy atoms, backbone atoms, and base atoms RMSD of average MD structure with respect to the crystal structure. The last two columns show the comparison of the average structure from the solution simulation with the deposited model. The values in parentheses exclude the terminal residues.
All heavy
atoms Backbone Base All heavy atoms (sol) All heavy atoms (sol + SPM)
463D 1.72 (0.86) 1.39 (0.99) 2.03 (0.65) 3.20 (1.20) -
1EHV 1:12 0.96 (0.83) 1.00 (0.95) 0.90 (0.64) 3.20 (1.15) -