Firm Size and Innovation in the
Manufacturing Industry: Evidence from Three
European Countries
Alessandra Mariani
Relatori: Prof. Andrea Mina
Prof. Fabio Pieri
Tutor: Prof. Alessandro Nuvolari
Scuola Superiore di Studi Universitari e di Perfezionamento Sant’Anna Classe Accademica di Scienze Sociali
Settore di Scienze Economiche e Manageriali Anno Accademico 2018/2019
The author has benefited from the access to the EU-EFIGE/Bruegel-UniCredit database, managed by Bruegel and funded by the European Union’s Seventh Framework Programme ([FP7/2007-2013] under grant agreement n° 225551), as well as by UniCredit.
Contents
Introduction
1
1. Different Approaches to Innovation
4
2. Small versus Large Firms
7
2.1 The Empirical Evidence on Firm Size and Innovation 10
3. The Manufacturing Industry in Italy, France and Germany 17
3.1 Firm Size in Italy, France and Germany 18
3.2 Innovation in Italian, French and German Manufacturing Firms 22
4. Methodology
28
4.1 Data and Descriptive Analysis 29
4.2 Dependent variables 34
4.3 Independent variables 35
4.4 Econometric Analysis 39
4.5 Robustness checks 46
4.6 Discussion and limitations 52
Conclusions
57
Introduction
In the 1980s, the Italian GDP per capita was higher than the OECD average; however, since the mid-1990s, Italian economic growth has faltered and the growth of GDP per capita has slowly decreased. The country report issued by the European Commission in 2016 identified the main cause of this growth turnaround in the declining contribution of total factor productivity, that is “the efficiency with which the inputs are used in the economy” (European Commission, 2016, p. 12). There are two possible causes of variations in total factor productivity. First, total factor productivity increases if resources are allocated to more productive firms rather than less productive. This process occurs (or should occur) thanks to the market forces. Second, total factor productivity changes if firms use inputs more efficiently; increased efficiency is usually due to technical change, i.e. innovation.
Indicators such as the gross domestic expenditure on research and development (GERD) and the number of patents filed at the European Patent Office show that Italy is lagging behind most of the other European countries (Bugamelli et al., 2012). As further explained in Section 3, the innovative gap seems to be attributable mainly to the private sector, i.e. to the innovative activities performed by firms. Researchers have tried to shed light on the determinants that lead firms to perform innovative activities and, ever since the influential works of Schumpeter (1934, 1942), many have investigated the relationship between firm size and innovation. Understanding the nature of this relationship is particularly important in the case of Italy, because on average Italian firms are characterised by a smaller size with regard to the firms of the other European countries.
In this work, it has been chosen to focus on the manufacturing industry due to its central importance in the Italian economy. Nowadays, the Italian manufacturing industry is the second one in Europe for value added, after Germany, and the seventh in the world (Grandi, 2016; Confindustria, 2019).
One of the characteristics of the Italian manufacturing sector is that it is mainly composed by micro, small and medium-sized enterprises. Large firms account for just a small part of the manufacturing industry; indeed, in 2016 a mere 0.32% of the Italian manufacturing firms have more than 249 employees, compared to 0.63% in France, 0.91% in the United Kingdom and a much higher 2.18% in Germany (Eurostat, 2019a).
If the number of persons employed in micro, small and medium-sized enterprises (SMEs) is considered, the difference among Italy and the other European countries is consistent. In 2016, Italian SMEs employ 84.3% of the people employed in the manufacturing sector, above the EU average that is 59.1%. French manufacturing micro, small and medium-sized firms employ 58.5% of the manufacturing workers, while British SMEs employ 51.8%. However, the most significant difference is with Germany, where micro, small and medium-sized firms employ only 43.4% of the people working in the manufacturing industry (Eurostat, 2019a).
When considering the contribution of micro, small and medium-sized enterprises (SMEs) to the total value added, Italy stands out. In 2016, SMEs represent 65% of the total value added of the manufacturing industry in Italy as compared to 32% in Germany and 41% in France. The other European countries display figures more similar to France and Germany than to Italy. Indeed, the contribution of SMEs to the total value added by the manufacturing industry in the United Kingdom is 43% and on average in the European Union it equals 41% (Eurostat, 2019a).
After the economic crisis in 2008 and in consideration of the increasing competition in the global economic arena, concerns have been expressed regarding the capability of the Italian manufacturing firms to keep pace with their international competitors. Their small size is seen as a factor that may hinder their innovative capability and prevent them from effectively exploiting opportunities in international markets (Banca d’Italia, 2013; Giunta and Rossi, 2017; Berta, 2017).
The comparison is typically made with Germany and France, the other two prominent manufacturing industries in Europe, that are the first and the
third manufacturing country in Europe for value added (Centro Studi CNA, 2017; Confindustria, 2019). Their greater innovative activity is typically explained by the presence of larger firms, among other factors.
The aim of this work is to examine the innovative gap between the Italian, and the French and German manufacturing sector in light of the relationship between innovation and firm size.
Since it is quite complex to measure innovation and there are many different ways to do so, it is necessary to investigate whether the Italian innovative gap persists or varies depending on the indicator used to estimate innovation. Once ascertained the presence of an innovative gap between Italy and France and Germany in the manufacturing industry, the question is whether there is a positive relationship between firm size and innovation. If firm size plays a significant role, Italian, French and German firms should display similar levels of innovation, conditional on firm size. If this is not the case and Italian firms are less innovative than French and German firms, it means that there are other factors that affect the innovative performance of Italian firms that should be taken into account.
In the first section, innovation is defined and different approaches to the study of innovation are introduced. The second section focuses on the reasons why larger firms may be more innovative than their smaller counterparts and details the typical counterarguments in favour of small firms. Then, I consider the main empirical findings on the relationship between firm size and innovation. In the third section, the Italian, French and German manufacturing industries are examined and the main differences in terms of firm size and innovation are identified. The fourth section presents the methodology and the database that has been used for the analysis. The main results of the empirical analysis are discussed in light of the relevant literature and limitations and possibilities for further research are identified. Finally, some conclusions are drawn.
1. Different Approaches to Innovation
Before investigating the factors that facilitate the innovation process, it should be clarified what is innovation.
According to the classic definition by Schumpeter (1934), innovation is the
application and introduction in the marketplace of new ideas to respond to a market need and, as such, it is different from an invention, that is the mere generation of new knowledge, not necessarily translated into a production process. Generally, the distinction is made between incremental and radical innovations, depending on their degree of novelty. An incremental innovation consists in the improvement of an already existing process, good or service. Instead, radical innovations represent a breakthrough in the existing technology. Incremental innovations are much more common than radical innovations (Malerba, 2000). However, this categorisation is just a useful simplification since there is not a clear-cut distinction between the two types of innovation but a continuum of possibilities (Malerba, 2000).
Another distinction, between technological innovation and non-technological innovation, has been formalised in the Oslo Manual by Eurostat and OECD. Technological innovation is spurred by technological advance; it is focused on product and processes improvements. Product innovation occurs when new and improved products are brought to the market; it can refer both to services and goods. Significant changes in the way goods or services are produced go under the label of process innovation. Non-technological innovation is identified as a residual category. The major types of non-technological innovation are organisational and managerial innovation. The first consists of organisational or functional changes that enable the firm to achieve better efficiency or improved products, even in the absence of product or process improvements per se; the second pertains to the implementation of advanced management techniques such as total quality management or to the adoption of new or substantially changed corporate strategic orientations (Eurostat and OECD, 2005; D’Amore and Iorio, 2017).
Because of its implications both at the firm and at the country level, innovation is widely debated and studied by academics and policy-makers. Innovation can give firms an edge in the increasingly competitive globalised arena. Firms are well-aware that if they do not innovate, their competitors probably will, thus acquiring a competitive advantage (Dodgson and Gann, 2010). Moreover, innovation is generally considered as a key means to sustain economic growth and welfare as well as to address societal challenges (Hölzl and Janger, 2014).
Over time, different facets of the innovation process have been investigated (Cohen, 2010). Some have focused on the specific characteristics of the firms that succeed in innovation, while others have taken a more systemic approach, analysing the kind of environment where innovative firms thrive. The debate on the characteristics of successful innovative firms, the investigation of their organizational structure and how they manage the process of innovation dates back to the beginning of the last century and has advanced ever since, taking advantage of the richness of recent available data at the firm level (Smith, 2005). This work is rooted in this firm-level approach and focuses on the type of firm that is most likely to innovate, in light of the role (supposedly) played by the firm size in its capability to successfully introduce innovations.
However, it should be noted that this is not the only possible perspective. Indeed, others have preferred to focus on the environment where the firm operates. In this regard, one remarkable contribution is the “systems of innovation” framework, that has been developed in the last 30 years. It is based on the consideration that firms seldom innovate in isolation, but in collaboration with other entities. Depending on how the boundaries are defined, national, regional and sectoral innovation systems are identified. The underlying idea is that organisations operate in idiosyncratic systems of innovation, where there is interdependence between different firms (suppliers, customers, etc.) and non-firms entities (universities, research centres and so on) and institutions such as laws, norms and routines
influence the innovative process by creating incentives and obstacles to innovation (Freeman, 1987; Nelson, 1993; Lundvall, 1992; Edquist, 2005). In summary, it could be said that one approach focuses on the single firm while the other investigates the environment of the firm and their interactions. These two perspectives are not alternative but rather complementary as they both help to shed light on the complex phenomenon of innovation.
2. Small versus Large Firms
The debate concerning the relationship between firm size and innovation dates back to 1934, when Schumpeter claimed that the introduction of innovative products was mainly due to small entrepreneurial firms. In his later work, Schumpeter (1942) emphasised the role of the research and development (R&D) laboratories of big corporations as creators of
innovation.1
Scholars usually refer to the first pattern of innovation as Schumpeter Mark I and to the second one as Schumpeter Mark II. Schumpeter Mark I industries are characterised by technological ease of entry and by the fundamental role played by entrepreneurs and small new firms in innovative activities. New entrepreneurs enter the industry introducing new ideas and innovations, challenging existing firms and disrupting the current ways of production and organisations, thus wiping out the rents associated with the previous innovations made by the incumbents. In other words, “creative destruction” is at the centre of the Schumpeter Mark I pattern of innovation (Breschi,
1 It is perhaps the case to mention that Schumpeter (1942) theorised also an influence of
market structure on innovation, arguing that industry concentration reduces uncertainty and provides the cash flow required to engage in costly and risky R&D projects; the typical counterargument is that the absence of competitive pressure and of potential entry may lead companies to bureaucratic inertia and, consequently, to lower innovative activity (Cohen and Levin, 1989; Acs and Audretsch, 1990). The empirical study of this relationship entails many difficulties related to the choice of proper measures for market structure, which does not necessarily coincide with market concentration (Geroski, 1990; Symeonidis, 2000), to the presence of reverse causality (Phillips, 1971; Rogers, 2004) and to the fact that to identify well-defined markets is not straightforward, even when three-digit or four-digit classifications are used (Symeonidis, 2000). In spite of the fact that recent studies have attempted to control for the problem of endogeneity and despite the availability of larger and more accurate datasets, the empirical results are quite mixed, to the point that “the main characteristic of the empirical literature on market structure and innovation is its inconclusiveness” (Symeonidis, 1996, p. 16). For these reasons, even though firm size and market structure are somewhat conceptually linked and, when studying one of them, scholars typically investigate (to varying extents) also the other, this work will not analyse the difference in terms of innovation in Italian, French and German manufacturing firms trough the lens of the possible role of market structure, but will keep its focus on the role played by firm size.
Malerba and Orsenigo, 2000). On the contrary, Schumpeter Mark II industries are characterised by “creative accumulation”: large incumbent firms are prevalent and there are relevant barriers to entry for new innovators. The incumbents take advantage of their accumulated knowledge in specific technological areas and of their R&D competences. Furthermore, they can exploit complementary assets such as already-in-place distribution and marketing channels and their relevant financial resources. In other words, there is a deepening pattern of innovation, related to the dominance of few large firms that are continuously innovative thanks to the accumulation over time of their knowledge base and innovative capabilities (Breschi, Malerba and Orsenigo, 2000).
Even though not grounded in empirical research, Schumpeter’s contributions have paved the way for successive research by framing the terms of the problem.
It is quite evident that large firms have an advantage in developing innovations that require an absolute number of components - the extreme case is Apollo XI that required over two millions of components, but there are also more frequently used complex engineering products that require more than 10.000 components, such as advanced jet aero-engines or some plants (Freeman and Soete, 1997, p. 234). Also, large firms have a comparative advantage where there are several possible alternative routes to success that are characterised by uncertainty of the outcome but by benefits from the simultaneous pursuit of several paths (Freeman and Soete, 1997). Apart from these two peculiar cases, the literature has examined several advantages and disadvantages attached to the size of the innovative firm. Cohen and Levin (1989, p. 1067) have identified four main reasons why large firms may have an advantage in innovating over their smaller counterparts. First, in the case of capital markets imperfections, large firms have an advantage in financing their risky R&D projects, because they can dispose of internally-generated funds - whose stability and availability is correlated with firm size. Larger revenues allow firms to diversify in different R&D projects in order to increase the likelihood of success, as the activity of R&D
is uncertain and risky (Acs and Audretsch, 1990). Furthermore, also external funding may be more easily accessible to large firms (Pagano and Schivardi, 2003). Second, if there are returns to scale in R&D, small firms are ill-suited in the competition with large firms. Third, it is usually claimed that R&D productivity is higher in large firms due to the complementarities between R&D and other activities such as marketing and distribution. Fourth, the returns on R&D are allegedly higher when the innovator can spread the fixed costs of innovation over a larger volume of sales.
In addition, Corsino, Espa and Micciolo (2011) have suggested that large firms can attract more easily the technical and managerial expertise required for an effective innovation process. Instead, small firms may face lack of qualified labour and the initial management may be ill-suited to lead the firm in the successive phases of growth (Freel, 2000).
Moreover, large firms can establish strategic alliances and supply relations and encourage innovative activities by their partners, thus having the opportunity to benefit from their achievements, whilst small firms may experience difficulties in accessing external information (Rothwell and Dodgson, 1994; Freel, 2000).
Besides, Freel (2000) pinpoints that large firms may have low costs of regulatory compliance as opposed to small firms.
On the other hand, small firms may enjoy some advantages in performing innovative activities. The entrepreneurial management of small firms is more likely to endorse the undertaking of new R&D projects and to do so in rapid times, due to faster decision-making processes (Corsino, Espa and Micciolo, 2011). On the contrary, large firms are often controlled by risk averse accountants and managers may become bureaucrats and lack dynamism. Furthermore, large companies are typically characterised by longer decision chains that may result in slower reaction times (Rothwell and Dodgson, 1994).
Another advantage of small firms is that they usually have a lean
organisation focused on the innovation activity, which is put at the centre of their competitive strategy; thus, they safeguard and endorse the creative
impulses of the technical personnel, that are more likely to be thwarted in conservative hierarchical and bureaucratic structures (Acs and Audretsch, 1990).
As firms grow large, efficiency in R&D could be undermined due to the loss of managerial control. It is also possible that the incentives of individual scientists and entrepreneurs weaken as their ability to capture the benefits from their innovations diminishes (Cohen and Levin, 1989, p. 1067).
In brief, large firms benefit from material advantages that are mainly related to resource availability (access to financing, technical and managerial expertise, complementarities between R&D and other activities, strategic alliances and supply relations, etc.), whereas small firms are characterised by entrepreneurial dynamism, higher responsiveness to changing circumstances, etc., in other words by behavioural advantages (Rothwell and Dodgson, 1994).
2.1 The Empirical Evidence on Firm Size and
Innovation
Since the 1960s, scholars have searched for empirical evidence to verify the relationship between firm size and innovation. Because of the lack of data on innovation outputs, R&D expenditure was commonly used as a proxy of innovation, even though it actually refers to one of the inputs of the innovative activity. The first stylised fact that has emerged quite clearly is that the likelihood of a firm reporting positive R&D effort rises with firm size and tends to one in the largest size ranges (Cohen and Klepper, 1996a).
The study of the exact nature of the relationship between firm size and innovation has been more controversial. Initially, this has been analysed by means of cross-sectional samples that were restricted to R&D performers. The earliest studies of this kind revealed a more than proportional positive relationship. However, as highlighted by Cohen (1995, p. 186), most of them did not control for industry variables that could have affected the
relationship (e.g. technological opportunities, etc.). Consequently, it is likely that the omission of these variables produced biased estimates.
Scherer (1965a, 1965b) observed a more complex relationship: inventive activity, whether measured by number of employees involved in R&D (measure of the innovation input) or by number of patents (proxy for the innovation output), increased more than proportionally up to a certain firm size while once over the threshold the relationship became basically proportional. Later studies have confirmed to varying degrees this finding (Cohen, 1995).
Cohen (1995, p. 187) claims that these results should not be considered as definitive. First, caution should be used when considering the study sample. Indeed, most of the early studies were based on non-random samples that took into account only the 500 or 1000 largest firms in the manufacturing industry and the authors did not investigate the possible sample selection bias. Second, the largest firms are usually composed of several business units operating in different industries and, in order to control properly for the industry effects, one should be able to assign correctly each of the business units to the relevant industry. However, this operation is often not so straightforward and sometimes it is not even possible to identify the business units due to lack of data, not to mention attributing them to the proper industry. Third, the study of the relationship between firm size and innovation is made more difficult by the possibility of reverse causality, meaning that innovation may spur the size of the firm: a successful innovation drives the amount of output that is produced and sold and thus causes an increase in the size of the firm.
The kind of innovations should be considered as well, since some innovations may be more successful and profitable than others. However, it is quite difficult to assess this in empirical studies, due to the fact that classifying innovations is a time-consuming process and there could be possible biases arising from the subjective evaluation and the consequent weighting of the innovations considered (Freeman and Soete, 1997).
Another line of research examines the possible inclination of small firms towards one type of innovation rather than the others. Santarelli and Sterlacchini (1990) claim that as size increases firms dispose of a larger number of R&D employees and therefore their innovative activities become more systematic, i.e. more structured and regular over time. In their view, systematic R&D enables major innovations to be introduced; small firms then come up with incremental innovations built around the major innovations. On the other hand, it is often argued that larger firms can more easily gain from incremental innovations because, when successful, such projects amplify their existing competitive advantage as well as the advantage that arises from spreading savings of fixed costs over a larger level of output. More revolutionary innovations, instead, are essentially independent of the firm’s prior market position since they usually substitute the products that already exist on the market (Cohen, 1995). According to Klepper (1996), since there are increasing returns in process innovations, larger firms may benefit more from process innovations than smaller firms because they can spread on a larger output the average costs of production.
Expanding on this, Cohen and Klepper (1996b) argue that returns on innovation are linked to the ex ante firm size as firms typically expect to exploit their innovations mainly through their own output and to grow slowly over time thanks to innovation. Product innovations may be expected to be easier to license and to spawn more growth than process innovations, so product innovation should depend less than process innovation on firm size. Indeed, in their sample, Cohen and Klepper (1996b) find that process innovations increase with the dimension of the business unit. Anyway, the authors highlight that it is not a matter of innate suitability of small or large firms toward one type of innovation or the other; rather, they differ in terms of incentives. In their words, “while large firms have a greater incentive to pursue all types of innovation, this incentive is relatively greater for types of innovation that depend more heavily on existing output for their exploitation, [...] these include process and incremental innovations which [they] claim to be less saleable and less likely to spawn rapid growth than
other innovations” (Cohen and Klepper, 1996b, p. 242, italics in the original). Even though it is difficult to analyse the relationship between firm size and the allocation of R&D across different types of innovative activities, the few studies that have explored empirically this issue have found that larger firms tend to conduct relatively more incremental R&D and relatively more process R&D (Cohen, 1995).
Notwithstanding the various issues in investigating the different facets of the relationship between innovation and firm size, the consensus is that in the majority of industries, R&D expenditures rise proportionately to the firm size. However, there are some exceptions by country and by industry (Freeman and Soete, 1997). The proportionality has been initially interpreted as proof that there is no firm size advantage with respect to R&D activities. Fisher and Temin (1973) have argued that the Schumpeterian hypotheses refer to the relationship between firm size and innovative output; thus their relationship may not be properly modelled by using an innovation input such as R&D expenditures. Another critique to the R&D expenditures approach is that these do not include informal R&D activities (Santarelli and Sterlacchini,1990). In small firms it is more likely for managers, engineers or other staff to be involved in the innovative activities incidentally to their main work (Freeman and Soete, p. 228). Therefore, taking into account only the formal R&D expenditures might imply an underestimation of the role of small firms in innovative activities.
In the 1980s, some databases of significant innovations were compiled. The innovations were identified thanks to the announcements published in the technical and trade press; in other cases, industry experts were asked to identify the most important innovations in a certain sector during a fixed period. These databases allowed to investigate the relationship between firm size and innovative output. Among these, one of the most studied databases is the one set up by the U.S. Small Business Administration that consists of 8,074 innovations introduced in the U.S. in 1982. The database comprehends the innovations which were introduced in 1982 and appeared in the sections listing new innovations of over 100 technology, engineering and trade
journals, spanning every manufacturing industry. It may be argued that since trade journals mainly report product innovations, there could be a possible underestimation of innovations made by large firms since they tend to introduce more process innovations than their smaller counterparts. However, the innovations of large firms are more easily reported in trade journals and, consequently, the biases should be somewhat offset (Acs and Audretsch 1988). Previous to the compilation of these databases, data on innovation output were difficult to obtain and thus most of the studies focused on R&D expenditure, an innovation input.
The evidence on the relationship between innovative output and size is quite mixed. Some studies have found that innovative output tends to rise less than proportionately with firm size, but other patterns have also been suggested for particular industries, periods and countries (Symeonidis, 1996).
Another stylised fact that has been ascertained regards R&D productivity (i.e. innovations per unit of R&D). Several studies, among which Pavitt, Robson and Townsend (1987) have found that R&D productivity, that is the number of patents or innovations per each euro spent on R&D, declines with firm size. This finding has been explained in several ways. Some have proposed that large firms are less efficient innovators than their smaller counterparts; others have attributed the result to measurement errors due to the systematic underestimation of formal R&D for small firms in particular (Cohen, 1995). Griliches (1990) has suggested that there could be a sample selection bias since only the most successful small firms innovators tend to be included in the examined samples. Cohen and Klepper (1996a) instead have proposed a different explanation. According to them, in order to reap the returns from their innovations, firms use appriopriability mechanisms such as secrecy or first-mover advantages that require them to exploit innovation through their own output. They propose that the growth of the firm thanks to innovation is limited by its size at the time of the innovation. Thus, the larger the output of the firm at the time it conducts R&D, the greater the future output on which the R&D costs will be spread. Then, large
firms pursue more marginal R&D projects than smaller firms because they have a bigger output over which they can apply the results of the projects. Consequently, the average project they pursue has a lower return in terms of innovations or patents than smaller firms. In this view, the lower R&D productivity does not point to a disadvantage of large firms in R&D. On the contrary, it reflects a greater ability to profit from R&D thanks to their cost spreading advantage that allows them to undertake more R&D projects at the margin. In other words, even if the average R&D productivity of the projects of large firms is lower, it is more than offset by the gains that large firms obtain by spreading their costs on a larger output. This explains why large firms can prosper despite the lower average productivity of their R&D. According to the model of Cohen and Klepper (1996a), the suggestion that large firms have an advantage in R&D is not due to size per se but to the appriopriability conditions, which lead firms to exploit their innovations mainly through their output, and to the fact that firm expect limited growth thanks to innovation. The first point is supported by the theoretical literature as imperfections in markets for information make the sale of innovation in disembodied forms difficult. While patents have been designed exactly to overcome this problem, their effectiveness is somewhat limited, due to the fact that competitors can easily “invent around” them. Furthermore, it has been suggested that many innovations are most valued by the innovators themselves because they are either specific to the needs of the innovator or require idiosyncratic expertise for their exploitation that is generated during the innovation process itself. As regards the second point, Cohen and Klepper (1996a) remark that the empirical literature on firm growth rates indicates that firm growth due to all factors is typically modest; they observe that this is the case in the industries characterised by incremental innovations (that are the most common). Nevertheless, different types of R&D projects may be characterised by different appropriability conditions and by different growth rates. Notably, innovations from product R&D are more likely to be licensed than innovations from process R&D. In addition, product R&D can lead to innovations that appeal to new segments of the market and new
customers. If customers did not previously buy the innovator’s products, the returns to innovation will be completely independent of their previous output. For these reasons, the model of Cohen and Klepper (1996a) is more likely to hold in the case of process R&D.
In summary, some stylised facts can be recalled. First of all, the likelihood of a firm performing R&D increases with its size. Second, generally R&D expenditure are proportionally related to firm size, even though this relationship may vary depending on the industry considered. There seems to be a positive relationship also between innovative outputs and firm size, even though there is not clear consensus on its proportionality (Cohen, 1995, p. 189). Third, R&D productivity seems to decrease with firm size. As explained in the model of Cohen and Klepper (1996a), however, this does not necessarily mean that large firms are at a disadvantage in innovation.
There is little evidence concerning the inclination of small firms toward which type of innovation. It would seem that large firms tend to focus on incremental and process innovations, however further research is still needed.
The relative contribution to innovation of small and large firms varies significantly depending on the industry considered. Indeed, the major source of variations in innovative activities between firms is the industry concerned; for this reason, the analysis of this relationship should be addressed on an industry by industry basis. For instance, Acs and Audretsch (1987) have found that in some manufacturing industries large firms are more innovative than their smaller counterparts, while in others they are not.
3. The Manufacturing Industry in Italy, France
and Germany
The manufacturing industry has been key in the industrial development of Italy (Giunta and Rossi, 2017). Italian manufacturing firms have proved successful in many fields, to the point that the expression “Made in Italy” has become not only a geographic label but also an expression used to refer to excellent products, particularly those of the apparel and fashion, furniture, mechanical manufacturing, agroindustrial and beverages industries (Fortis, 1998; Magnani, 2014).
Nowadays, the manufacturing industry still plays an important role for the Italian economy. Manufacturing firms account for 82.3% of the total exports (Confindustria, 2016). Since manufacturing firms demand services and goods from the other sectors of the economy, it has been estimated that a variation of €1 in the output produced by the manufacturing industry causes a variation that is almost twofold (€1.83) in the whole economic system. In order to have an idea of the size of the effect, it suffices to say that the utilities industry has a multiplier effect of 1.34, while the construction industry has a multiplier effect of 1.76 (Confindustria, 2016). Moreover, manufacturing firms account for the majority of the private R&D expenditure (i.e. 72.1%, Confindustria, 2016).
For these reasons, the manufacturing industry and its characteristics have been examined in-depth over time. Similarly to other industries in Italy, the manufacturing industry is characterised by the significant presence of small firms. Many have argued that Italian firms are disadvantaged in the globalised competitive arena due to their small size, because it is more difficult for them to innovate and to access international markets (Giunta and Rossi, 2017; Berta, 2017). The comparison is typically made with Germany and France, the other two prominent manufacturing industries in Europe, that are the first and the third manufacturing country in Europe for value added (Centro Studi CNA, 2017; Confindustria, 2019). German and French
manufacturing firms are much larger than their Italian counterparts. Bugamelli et al. (2012) have estimated that on average, Italian manufacturing firms are 35% smaller than French firms and 75% smaller than German firms. One of the reasons of the difference in terms of innovative activities and, consequently, in terms of competitiveness is often ascribed to the smaller size of Italian firms (Hall, Lotti and Mairesse, 2009). However, this conclusion is not as obvious as it may seem. As discussed in the second section of this work, the relationship between innovation and firm size is quite complex and its magnitude may vary depending on the industry considered; as a consequence, it should be studied on an industry-by-industry basis. Indeed, it is not necessarily true that in the manufacturing industry large firms are always more innovative than their smaller counterparts (Acs and Audretsch, 1987, p. 570). Consequently, the German, the French and the Italian manufacturing industry should be examined closely in order to investigate whether there is a positive relationship between firm size and innovation and whether the larger presence of small firms in Italy entails a lower aggregate innovativeness.
In the next paragraphs, the peculiarities of Italian, French and German manufacturing firms are examined. First of all, a brief overview on the differences in terms of firm size is provided. Then, different measures of innovation are proposed and the difference between the three countries in terms of innovativeness is investigated.
3.1 Firm Size in Italy, France and Germany
The difference in terms of firm size among Italy, France and Germany is consistent. Before tackling this issue, however, it is necessary to provide a precise definition of small, medium-sized and large enterprises. It is possible to consider several proxies to account for firm size, among which the number of employees, the total revenues and the total assets (Sutton, 1997, p. 40).
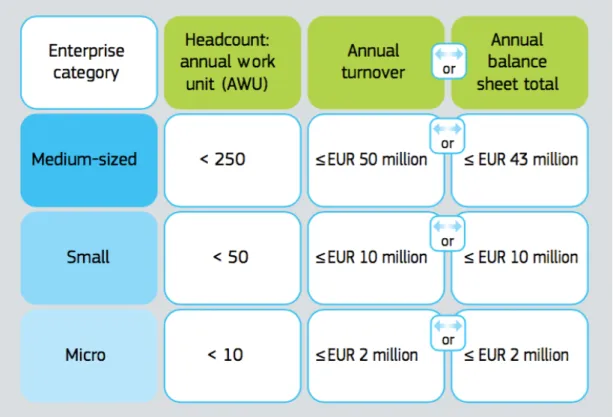
Recently, the European Union (EU) has issued some recommendations in light of its support programmes in favour of micro, small and medium-sized enterprises (SMEs). According to the EU definition, there are two factors to take into consideration: a) the headcount and b) the annual turnover or the annual balance sheet data. Micro firms are defined as “enterprises that employ fewer than 10 persons and whose annual turnover or annual balance sheet total does not exceed EUR 2 million” (European Commission, 2015, p. 11). Small firms are “enterprises that employ fewer than 50 persons and whose annual turnover or annual balance sheet total does not exceed EUR 10 million” (European Commission, 2015, p. 11). Medium-sized firms are those “enterprises that employ fewer than 250 persons and either have an annual turnover that does not exceed EUR 50 million, or an annual balance sheet not exceeding EUR 43 million” (European Commission, 2015, p. 11). Finally, large firms are identified as a residual category (figure 1).
Figure 1. The definition of micro, small and medium-sized firms according to the European Commission
The European Commission classifies micro, small and medium-sized firms according to two criteria: a) headcount and b) annual turnover or annual balance sheet total. Large firms are
identified as a residual category (i.e. they have headcount of 250 or more; annual turnover larger than €50 million or annual balance sheet larger than €43 million).
Source: European Commission (2015, p. 11).
Most of the recent studies and datasets adopt this convention; however, due to the lack of data and for the sake of simplicity, they often focus only on the number of workers. In this work the EU definition is applied, focusing only on the number of employees for reasons of simplicity.
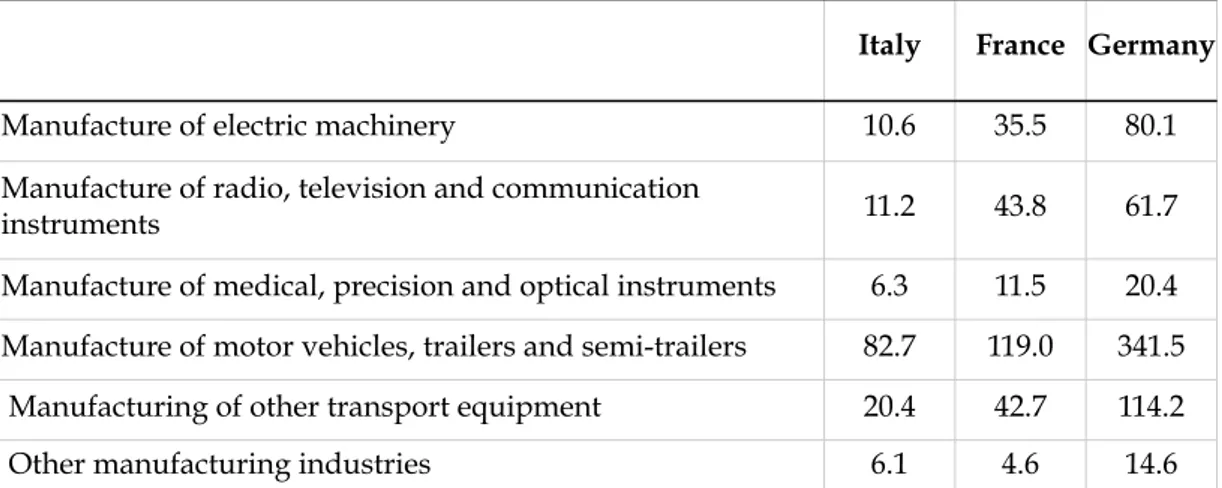
In the manufacturing industry, the average firm size in Italy is 9 employees, while in France the average is 13.8 workers and in Germany it is 35.8 workers (Bugamelli et al., 2012). This gap in terms of firm size does not characterise only one specific kind of manufacturing activities; rather, it is common to virtually all of them (Table 1).
Italy France Germany
Manufacturing industry 9.0 13.8 35.8
Manufacture of food products, beverages and tobacco
products 6.3 9.0 25.8
Manufacture of textiles 9.9 14.1 24.9
Manufacture of wearing apparel 6.5 5.2 20.4 Manufacture of leather and related products 8.7 13.4 19.6 Manufacture of wood products 4.2 7.7 11.3 Manufacture of paper and paper products 18.7 49.3 88.2 Printing and reproduction of recorded media 6.2 5.9 19.9 Manufacture of coke and refined petroleum products 44.4 231.6 299.4 Manufacture of chemicals and chemical products 34.2 69.1 129.1 Manufacture of rubber and plastic products 16.5 43.5 56.0 Manufacture of other non-metallic mineral products 9.6 14.7 26.2 Manufacture of basic metals 38.5 87.7 114.1 Manufacture of fabricated metal products, except machinery
and equipment 7.5 13.8 21.6
Manufacture of mechanical machinery 13.9 19.4 52.6 Manufacture of office and laboratories machinery, IT systems 8.1 13.3 31.6
Italy France Germany
Manufacture of electric machinery 10.6 35.5 80.1 Manufacture of radio, television and communication
instruments 11.2 43.8 61.7
Manufacture of medical, precision and optical instruments 6.3 11.5 20.4 Manufacture of motor vehicles, trailers and semi-trailers 82.7 119.0 341.5 Manufacturing of other transport equipment 20.4 42.7 114.2 Other manufacturing industries 6.1 4.6 14.6
Table 1. Average firm size in the manufacturing sectors in Italy, France and Germany
The table reports the average firm size, expressed in terms of employees, in several manufacturing sectors in Italy, France and Germany.
Source: Elaboration on Bugamelli et al. (2012, p. 42).
While the large presence of micro enterprises is quite common across countries, in France their number is particularly high, namely 86% of the total of manufacturing businesses in 2016; in Italy the pattern is similar, with a figure of 82%. Instead, in Germany the amount of micro firms is 62%. At the other extreme of the distribution, a mere 0.32% of Italian manufacturing firms have more than 249 employees, compared to 0.63% in France and a much higher 2.18% in Germany (Eurostat, 2019a).
When considering the contribution of micro, small and medium-sized enterprises (SMEs) to the total value added, Italy stands out. In 2016, SMEs represent 65% of the total value added of the manufacturing industry in Italy as compared to 32% in Germany and 41% in France. The other European countries display figures more similar to France and Germany than to Italy. Indeed, the contribution of SMEs to the total value added by the manufacturing industry in the United Kingdom is 43% and on average in the European Union it equals 41% (Eurostat, 2019a).
The difference in the importance of small firms for the Italian, the French and the German economy is clear also when looking at the share of total employment. In 2016, Italian SMEs employ 84.3% of the people employed in the manufacturing sector, above the EU average that is 59.1%. French
manufacturing SMEs employ 58.5% of the manufacturing workers, while British firms employ 51.8%. However, the most significant difference is with Germany, where SMEs employ only 43.4% of the people working in the manufacturing industry (Eurostat, 2019a).
Altogether, these data remark that the role of SMEs in Italy is much more prominent than in the other two manufacturing leaders in Europe. In Italy slightly less than two thirds of the total value added in the manufacturing industry is created by SMEs, whereas in Germany the contribution of SMEs is about one third. Similarly, Italian SMEs account for about four fifths of the total employment in the manufacturing industry, as opposed to Germany, where SMEs account for about two fifths. While the difference in terms of firm size between Italy and France is less disproportionate, there is not a doubt that French firms are much more akin to German firms in terms of firm size, with the only exception of the numerosity of micro firms.
3.2 Innovation in Italian, French and German
Manufacturing Firms
It is not trivial to measure innovation properly. As a first approximation, it is possible to use the R&D expenditure, even though this is just an innovation input rather than a measure of the outcome. If the gross domestic expenditure on research and development (GERD) is considered, Italy seems to be much less innovative than France and Germany. Indeed, in 2017 the Italian GERD was 1.35% of the GDP, inferior to the EU-28 average (1.96%) and much lower than the French expenditure, that was 2.19%. The Italian figure seems even smaller when compared to the German expenditure, that was 3.02% (OECD, 2019). The GERD is made up by three components: business enterprise expenditure (BERD), higher education expenditure (HERD) and government expenditure (GOVERD). While it is true that the Italian higher education and government expenditures are smaller than in other countries, the most significant difference is given by the private R&D
expenditure, as shown in figure 2. 0 0.5 1 1.5 2 2.5 3 3.5
France Germany Italy Spain United
Kingdom European Union (28 countries) European Union (15 countries) OECD Pe rc ent ag e of G D P Country Government expenditure Higher education expenditure Business enterprise expenditure
Figure 2. Gross Domestic Expenditure on Research and Development in 2017
The gross domestic expenditure on research and development (GERD) as percentage of GDP is broken down in business enterprise (BERD), higher education (HERD) and government expenditure (GOVERD) for France, Germany, Italy, Spain and United Kingdom. The average expenditures in the European Union and in the OECD countries are reported, together with the average for the EU15, that refers to the fifteen member states of the European Union before May 2004 (i.e. Austria, Belgium, Denmark, Finland, France, Germany, Greece, Ireland, Italy, Luxembourg, Netherlands, Portugal, Spain, Sweden, United Kingdom).
Source: Elaboration on OECD (2019).
The amount of Italian patents filed at the European Patent Office (EPO) confirms the innovative gap with regard to the other European countries. Indeed, in 2018 Italy had filed 2.52% of the total patents filed at the EPO, a percentage similar to the 3.29% of United Kingdom, but smaller than the 5.92% of France. Notably, Germany was the second country for propensity to patent, having filed the 15.34% of the total patents filed at the EPO (EPO, 2019).
However, taking into consideration the R&D expenditure or the number of patents may result in misleading conclusions. Indeed, it is likely that the innovative activity of small firms is not captured by these two measures (Bugamelli et al., 2012). In fact, R&D expenditures do not include informal R&D activities that are likely to be more significant in small firms.
Progressively, it became clear that these indicators were not enough and that information on the actual innovations was needed. Initially, researchers built datasets of the innovations reported in trade and scientific journals, as in the case of the one set up by the U.S. Small Business Administration, mentioned in the second section. However, building this kind of datasets was time-consuming and expensive; besides, it was difficult to achieve comparability among different countries. Therefore, more recently, the tool to overcome the lack of available data has been identified in innovation surveys. Innovation surveys involve a representative sample of firms that are asked several
qualitative and quantitative questions on their activities.2 While particular
attention is devoted to innovation inputs and outputs, the questions typically focus also on other firm characteristics such as corporate governance and exporting activities, in order to capture other possible determinants of innovation.
According to the data of the Community Innovation Survey (CIS), in the period 2014-2016, Germany was among the EU countries with the highest proportion of innovative manufacturing firms (70%). France lagged behind with a share of innovative firms of 60%; Italy followed with a percentage of 58% (Eurostat, 2019b). According to the Eurostat definition, innovative enterprises are those firms that undergo innovative activities during the considered period. All the activities that are needed for the implementation of innovation (i.e. scientific, technological, organisational and financial activities) are labeled as innovative.
2 Notably, it was the release of the Oslo Manual in 1992 by Eurostat and OECD that paved
the way for the diffusion of harmonised innovation surveys in different countries (OECD and Eurostat, 2005).
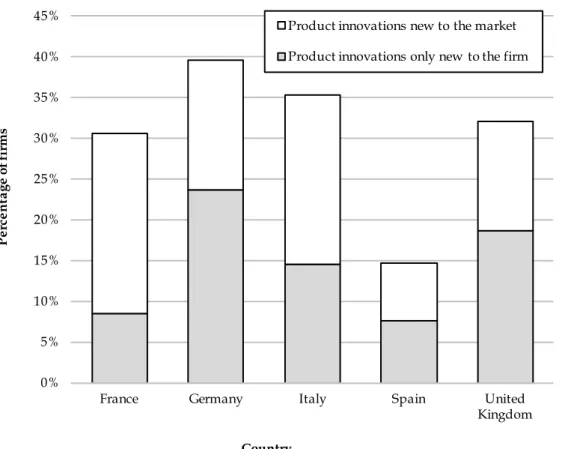
As shown in figure 3, the percentage of Italian manufacturing firms that introduced product innovations in the period 2014-2016 amounts to 35.2%; it is smaller than the German percentage (39.7%) but larger than the French percentage, i.e. 30.6% (Eurostat, 2019b). The Italian percentage is larger than the share of the United Kingdom (32.1%), too. Moreover, it is considerably larger than the Spanish share (14.7%), although it is to be said that Spain does not exactly stand out when it comes to innovativeness (Rubini et al., 2012; Bugamelli et al. 2012). The percentage of manufacturing firms that introduced product innovations can be broken down in firms that introduced innovations only new to the firm and those that introduced innovations new to the market. Indeed, product innovations are defined as new or significantly improved goods or services, so they must be new to the enterprise but they do not need to be new to the market. A little less than two thirds of the Italian product innovative enterprises introduced at least one product innovation new to the market (precisely 58.7%), less than the French share (72.3%) but more than the British share (41.9%) and the German share (40.3%).
Figure 3. Share of manufacturing enterprises that had product innovations in the period 2014–2016
The figure reports the share of manufacturing firms that had product innovations during the period 2014-2016 in selected EU countries. For each country, product innovations new to the market are distinguished from product innovations new to the enterprise.
Source: Elaboration on Eurostat (2019b).
In summary, figure 3 pinpoints that the percentage of firms that carried out product innovations in Italy is quite large, even though Germany leads the way. Moreover, if new to the market product innovations are considered, the Italian figure exceeds the German and the British share, although smaller than the French percentage.
In conclusion, there is an innovative gap between Italian and French and German manufacturing firms, that is particularly evident when traditional measures of innovation such as GERD and number of patents are considered. Data from innovation surveys show that at the aggregate level the percentage of innovative firms in Italy is smaller than in other countries. However, they allow to draw a more precise picture of product innovation in Italian
0% 5% 10% 15% 20% 25% 30% 35% 40% 45%
France Germany Italy Spain United
Kingdom Pe rc ent ag e of fi rm s Country
Product innovations new to the market Product innovations only new to the firm
manufacturing firms, by adding interesting details that are not provided by more traditional innovation measures. Particularly, they suggest that the percentage of product innovative firms in Italy is quite high and that two thirds of them have introduced product innovations new to the market.
Due to the recent availability of these results, the literature has not yet analysed in detail the implications of these findings. Nevertheless, it is possible to state that the picture is more complex than traditional innovation measures may suggest and that, even though the percentage of Italian innovative firms is lower than in other European countries, the Italian firms that actually innovate seem to achieve good results in terms of novelty of their innovations.
4. Methodology
Traditional measures of innovation show that there is a gap among Italy and France and Germany. However, data from Eurostat (2019b) qualify this finding.
It is the case to analyse further the nature of this innovative gap and investigate whether it is affected by the positive relationship between firm size and innovation. The gap may be the result of the lower innovativeness of Italian firms as compared to their French and German counterparts, conditional on their size. In this case, the “real” difference in terms of innovativeness would not be the firm size but rather other factors peculiar to Italian firms. For instance, there may be differences in the education of the labour force, in the accessibility of finance, in the type of corporate governance and so on (Benvenuti, Casolari and Gennari, 2013).
Otherwise, Italian firms may be as (or more) innovative as the French and German ones, keeping size equal. However, since there is a positive relationship between firm size and innovativeness (i.e. large firms are more innovative than small firms) and due to the fact that in Italy small firms have a more prominent role than in France and Germany, on average Italian firms may result less innovative.
As discussed in Section 2.1, there seems to be a positive relationship between firm size and innovation, however its existence and magnitude should be assessed on a industry-by-industry basis. Consequently, it is necessary to verify empirically this relationship in the specific case of the Italian, French and German manufacturing industries. To do so, firm-level data on a representative sample of firms are required. The data should be detailed at the firm level because the aim of this work is to investigate whether the single firm is more likely to innovate given its size. Another point to be considered is that firm size is not the only factor that may influence innovation. Other variables may mitigate or strengthen this relationship and thus information
about them should be exploited in the analysis to control properly for these elements. These factors have guided the choice of the dataset.
4.1 Data and Descriptive Analysis
The EU-EFIGE/Bruegel-UniCredit database, collected at the beginning of 2010 within the EFIGE project, provides an excellent opportunity to address this problem. I have used the truncated EFIGE dataset 2, which merges the anonymised firm-level information from the EFIGE survey with balance sheet data from the database Amadeus.
Two characteristics of the dataset make it suitable for this kind of analysis. First of all, the EFIGE dataset provides a wide array of information about firms operating in the three European countries of interest, ranging from the firms’ international activities and workforce to R&D and technological innovation. The richness of data of EFIGE allows for in-depth analysis of complex phenomenons influenced by many factors, such as innovation. Secondly, the data can be accessed in its firm-level form by master’s students as opposed to other databases that require further qualifications for the consultation. Given the core research question of this thesis, a firm-level
approach is preferable, as we are interested in analysing the typeof firms that
innovate and their characteristics in terms of size and R&D intensity.
However, there are also limitations with the use of this dataset. The most important is that the EFIGE survey was performed in 2010 and never again, meaning that the firms are observed only once. In other words, it is possible to perform only a cross-section analysis. The relationship going from firm size to innovation is not that straightforward. If a firm innovates successfully, it will probably have a better performance in terms of sales and its size will grow, meaning that here is a risk of reverse causality. It has been claimed that the reverse causality may be not so troublesome because the effects of the innovation activities on firm size occur with a lag of some years. It is debated how consistent is this lag; however, in the case of measures of output
innovation it is likely that the range of time occurring from the completion of the project to its effects on profits is smaller (Symeonidis, 1996). It is plausible that when a firm profits from innovation, its turnover and assets increase in a shorter time span than is the period necessary for the firm to adjust the number of employees. This is one of the reasons why in this work, the number of employees rather than the firm assets or turnover is used as a measure of firm size. In any case, it is not possible to mitigate further the problem of endogeneity because of the cross-sectional nature of the data. Thus, it is necessary to keep in mind that the following econometric analysis will investigate simple correlations, rather than causal relationships.
Generally, there may also be an omitted variable bias; however this does not seem to be the case, thanks to the good number of firm specific variables available in EFIGE that allow to deal with large part of firm specific heterogeneity.
Another limitation is inherent to the construction of the EFIGE dataset: only firms with 10 employees or more have been sampled in the survey. Thus, micro firms are not considered, even though they are quite numerous across countries, especially in Italy, as described in Section 3.
For the purposes of this analysis, only manufacturing firms operating in Italy, France and Germany have been considered, using a starting sample of almost 9,000 firms. However, since some data are available only for a smaller subset, the dimension of the sample reduces more or less significantly depending on the choice of the variables of interest.
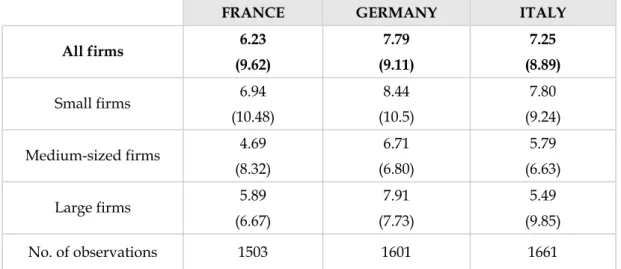
It is the case to begin with a descriptive analysis of the data. As regards the R&D intensity, expressed as the percentage of R&D expenditure on sales during the period 2007-2009, German firms display a higher average R&D intensity than Italian and French firms; this is true also when considering separately small, medium-sized and large firms (Table 2). Italy places second with an average figure of 7.3%, followed by France (6.2%).
FRANCE GERMANY ITALY All firms 6.23 7.79 7.25 All firms (9.62) (9.11) (8.89) Small firms 6.94 8.44 7.80 Small firms (10.48) (10.5) (9.24) Medium-sized firms 4.69 6.71 5.79 Medium-sized firms (8.32) (6.80) (6.63) Large firms 5.89 7.91 5.49 Large firms (6.67) (7.73) (9.85) No. of observations 1503 1601 1661
Table 2. Average R&D intensity in the sample
The average percentage of R&D expenditure on sales in 2008 for French, German and Italian firms in the sample is reported, overall and by size class. Standard deviations are in brackets. Source: Elaboration on EFIGE dataset.
When R&D intensity is expressed as the percentage of employees involved in R&D activities on average in the period 2007-2009, German firms have a better performance (9%) than their French (6.5%) and Italian (6.35%) competitors. Interestingly, after disaggregating by firm size, it emerges that while small German and French firms invest more in R&D than their Italian counterparts, medium-sized and large Italian firms surpass their German and French counterparts. In other words, the average Italian medium-sized firm and the average Italian large firm have more personnel working on R&D activities (Table 3).
FRANCE GERMANY ITALY
All firms 6.50 9.00 6.35 All firms (11.03) (13.96) (10.39) Small firms 7.24 10.61 6.42 Small firms (12.20) (15.96) (10.66) Medium-sized firms 4.19 5.34 6.09 Medium-sized firms (5.61) (5.95) (9.13) Large firms 4.80 5.43 5.74 Large firms (7.37) (7.73) (8.59) No. of observations 2739 1780 2692
Table 3. Percentage of employees involved in R&D activities
The percentage of employees involved in R&D activities on average during the period 2007-2009 is reported, overall and by size class. Standard deviations are in brackets.
Source: Elaboration on EFIGE dataset.
Since R&D is just one of the inputs of innovation, it is helpful to dig deeper by investigating whether the firms have actually carried out an innovation. The EFIGE dataset provides information on whether the firm achieved product or process innovations in the period 2007-2009 (Table 4).
FRANCE
FRANCE GERMANYGERMANY ITALYITALY
Absolute
number Percentage Absolute number Percentage Absolute number Percentage
All firms 1316 44.27% 1467 49.98% 1486 49.21% Small firms 874 40.63% 811 44.17% 1128 46.12% Medium-sized firms 608 50.82% 793 58.89% 429 60.84% Large firms 133 62.15% 189 61.76% 97 66.90% No. of observations 29732973 29352935 30203020
Table 4. Firms that carried out product innovation in 2007-2009
The table reports the absolute number and the percentage of French, German and Italian firms that carried out at least one product innovation in the period 2007-2009 by size class. The number of observations in the sample for each country is reported as well.
Source: Elaboration on EFIGE dataset.
During the period 2007-2009, the percentage of Italian firms that carried out at least one product innovation was slightly smaller than the percentage of German firms, but larger than the share of French firms. When this data is disaggregated on the basis of firm size classes it is clear that, in the three countries, the percentage of innovative firms increases as the firm size gets larger. This suggests that there may be a positive correlation between firm size and propensity to innovate. It would be interesting to know more on the type of product innovations, i.e. if they are new to the company, to the market or to the world, in order to understand better the degree of
innovativeness of firms in relation to their size. Unfortunately, this kind of information is not available in the EFIGE dataset.
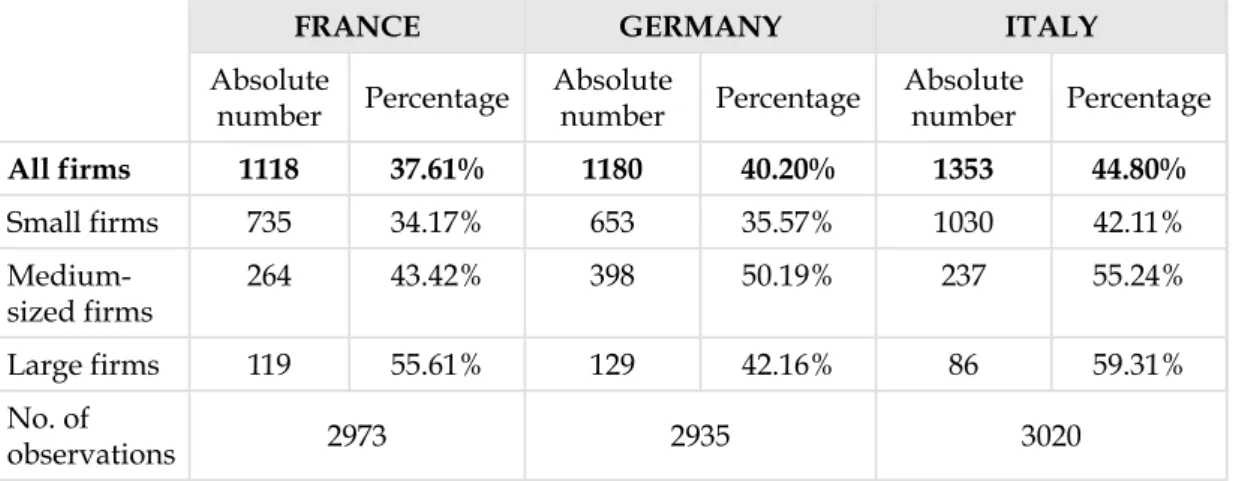
Concerning process innovations carried out in the same period, Italy has a higher percentage of innovative firms than Germany and France. As in the case of product innovation, the number of innovative firms raises as the firm size increases (Table 5).
FRANCE
FRANCE GERMANYGERMANY ITALYITALY
Absolute
number Percentage Absolute number Percentage Absolute number Percentage
All firms 1118 37.61% 1180 40.20% 1353 44.80% Small firms 735 34.17% 653 35.57% 1030 42.11% Medium-sized firms 264 43.42% 398 50.19% 237 55.24% Large firms 119 55.61% 129 42.16% 86 59.31% No. of observations 29732973 29352935 30203020
Table 5. Firms that carried out process innovation in 2007-2009
The table reports the absolute number and the percentage of French, German and Italian firms that carried out at least one process innovation in the period 2007-2009 by size class. The number of observations in the sample for each country is reported as well.
Source: Elaboration on EFIGE dataset.
The fact that the share of firms that have introduced process innovation is higher in Italy than in France and Germany is intriguing because it is counterintuitive given the macroeconomic performance of the three countries. The data point clearly toward this finding that, as a matter of fact, was confirmed by CIS 2010, which investigated process innovation during the slightly subsequent period 2008-2010 (Eurostat, 2017).
In 2008 the international economic crisis broke out and brought along major changes in the macroeconomic environment. Firms had to adjust to the new setting by modifying their behaviours. Donatiello and Ramella (2017) argue that the economic crisis had a harsher impact in Italy than in other European countries due to the structural characteristics of the Italian innovation
system.3 Consequently, Italian firms had to struggle for their own survival
and this may have affected their innovation strategies. In such a situation, it is likely that firms would focus on cost saving and efficiency gaining strategies, thus introducing process innovations (Antonioli et al., 2013).
4.2 Dependent variables
When it comes to measuring innovation, output measures, if available, are more suitable than R&D data, since the latter measure an input only and thus are constrained as an innovation indicator (Smith, 2005).
In this work, two dependent variables are considered, namely product innovation and process innovation. Product innovation is a categorical variable equal to one if on average the firm carried out one or more product innovations in the years 2007-2009 and equal to zero otherwise. Similarly, process innovation equals one if on average the firm carried out one or more process innovation in the years 2007-2009 and zero otherwise.
The choice of these self-declared measures of innovation as dependent variables has been favoured to the more traditional measure of patents because the propensity to innovate of a firm may differ from its propensity to patent (Scherer, 1983). On the one hand, patents mark “the emergence of a new technical principle, not a commercial innovation” (Smith, 2005, p. 160); indeed, there are many patents that are never translated into innovations. Moreover, it is possible for firms to behave strategically, registering a patent only to prevent competitors from patenting and using it, without any interest
3 More specifically, according to Donatiello and Ramella (2017) the Italian national
innovation system is characterised by the lack of collective goods and input for innovation, by underinvestment in training of highly qualified human capital, by weak relations between the actors participating in the innovative process and by the predominant role played by the State with respect to private actors in R&D activities (even though the State invests in R&D less than other comparable European countries). For instance, these features make the Italian national innovation system structurally weaker than the German one, that is characterised by high per capita expenditure R&D and by a central role of firms. Donatiello and Ramella (2017) argue that during the economic crisis, Italian firms had to deal with the economic downturn without the possibility to rely on a strong innovation system and thus were faced with a harder “battle for survival”.