1
A pseudo-octahedral cobalt(II) complex with bis-pyrazolylpyridine ligands
acting as a zero-field single-molecule magnet with easy axis anisotropy†
Luca Rigamonti,*a Nathalie Bridonneau,a∆ Giordano Poneti,b∂ Lorenzo Tesi,b Lorenzo Sorace,bDawid Pinkowicz,c Jesus Jover,d Eliseo Ruiz,d Roberta Sessoli b and Andrea Cornia a
a Dipartimento di Scienze Chimiche e Geologiche, Università degli Studi di Modena e Reggio Emilia and INSTM RU of Modena and Reggio Emilia, via G. Campi 103, 41125 Modena, Italy. E-mail: [email protected], [email protected]
b Laboratory of Molecular Magnetism (LAMM), Dipartimento di Chimica ‘Ugo Schiff’, Università degli Studi di Firenze and INSTM RU of Firenze, via della Lastruccia 3-13, 50019 Sesto Fiorentino (FI), Italy
c Faculty of Chemistry, Jagiellonian University, Gronostajowa 2, 30-387 Kraków, Poland
d Departament de Química Inorgànica i Orgànica and Institut de Química Teòrica i Computacional, Universitat de Barcelona, Diagonal 645, 08028 Barcelona, Spain
∆ current address: Laboratoire Interfaces Traitements Organisation et DYnamique des Systèmes (ITODYS), UMR 7086 CNRS, Université Paris 7 Diderot, Paris, Bât. Lavoisier, 15 rue Jean-Antoine de Baïf, 75205 Paris Cedex 13, France
∂ current address: Instituto de Química, Universidade Federal do Rio de Janeiro, 21941-909 Rio de Janeiro, Brazil
Authors’ ORCIDs: Luca Rigamonti: 0000-0002-9875-9765, Nathalie Bridonneau: 0000-0003-3789-9024, Giordano Poneti: 0000-0002-1712-4611, Lorenzo Tesi: 0000-0003-4001-8363, Lorenzo Sorace: 4785-1331, Dawid Pinkowicz: 0000-0002-9958-3116, Jesus Jover: 0000-0003-3383-4573, Eliseo Ruiz: 0000-0001-9097-8499, Roberta Sessoli: 0000-0003-3783-2700, Andrea Cornia: 0000-0001-9765-3128.
† Electronic Supplementary Information (ESI) available: Experimental Section (further details); crystallographic data collected with a Bruker D8 Quest Eco Photon50 CMOS diffractometer and refinement parameters for 1 and 2 (Table S1); room temperature unit cell parameters for 1, 2 and 3 collected with a four-circle Bruker X8-APEX diffractometer (Table S2); view of the [M(bpp-COOMe)2]2+ cation along b in 1 at 161 K, 1 at 295 K and 2 at 120 K; crystal packing of 1 at low T with the perchlorate positions (Fig. S1); hydrogen bonds in 1 at 295 and 161 K and in 2 at 120 K (Tables S3–S5); experimental curves obtained by CTM for the two rotations, Rot1 and Rot2, of 1 at several temperatures and for different applied magnetic fields (Fig. S2); sketch of the information
2
provided by CTM in Rot1 when scanning the magnetic field in the a*c plane (Fig. S3); comparison of experimental X-band powder EPR spectra of 1 and 3 measured at 10 K (Fig. S4); energy differences between ground doublet and first two excited states calculated with different models (Table S6); dependence of the relative difference between experimental and calculated geff values (using Griffith model) on Δax/Δrh (Fig. S5); representative fits of the torque data using Griffith model (Fig. S6); real component of the ac susceptibility, χM', of 1 measured at 1 kOe applied static field in the 10–10000 Hz frequency range and in the 1.9–9.5 K temperature range (Fig. S7); real (χM') and imaginary (χM'') component of the ac susceptibility of 3 measured with no applied static field in the 10–10000 Hz frequency range and in the 1.9–3.2 K temperature range (Fig. S8); real (χM') and imaginary (χM'') component of the ac susceptibility of 3 measured with in a 1 kOe applied static field in the 10–1000 Hz frequency range and in the 1.9–10.0 K temperature range (Fig. S9); computed spin-free (δE) and spin-orbit (ΔE) state energies for 1 with different packages and methods (Tables S7–S10); D, E, diagonalized 𝒈 and 𝑫 matrices and energy difference between the ground and the first excited KD (ΔE) computed using the structure of 1 at 295 K with different methods and the standard basis set (Table S11); D, E, diagonalized 𝒈 and 𝑫 matrices and energy difference between the ground and the first excited KD (ΔE) computed using the structure of 1 at 161 K with different methods and the larger basis set (Table S12); effect of distortion of the octahedral coordination geometry and spin-orbit coupling on the energy levels of 1 (Fig. S10); orientation of the computed 𝒈 and 𝑫 matrices for 1 obtained with the ORCA/NEVPT2 calculation (Fig. S11); experimental and MOLCAS-computed torque values for Rot1 and Rot2 at different T and fields (Figs. S12–S13). CCDC 1812294, 1812295 and 1812293 for 1 at 161 and 295 K and 2 at 120 K, respectively. For ESI and crystallographic data in CIF or other electronic format see DOI: 10.1039/***.
Abstract
The homoleptic mononuclear compound [Co(bpp-COOMe)2](ClO4)2 (1) (bpp-COOMe = methyl 2,6-di(pyrazol-1-yl)pyridine-4-carboxylate) crystallizes in the monoclinic C2/c space group, and the cobalt(II) ion possesses a pseudo-octahedral environment given by the two mer-mer coordinated tridentate ligands. Direct current magnetic data, together with single-crystal torque magnetometry and EPR measurements, disclosed the easy axis nature of this cobalt(II) complex, which shows Single-Molecule Magnet behaviour when a static field is applied in alternating current susceptibility measurements. Diamagnetic dilution in the zinc(II) analogue, [Zn(bpp-COOMe)2](ClO4)2 (2), afforded the derivative [Zn0.95Co0.05(bpp-COOMe)2](ClO4)2 (3) that exhibits slow relaxation of
3
magnetization even in zero field thanks to the reduction of dipolar interactions. Theoretical calculations confirmed the overall electronic structure and the magnetic scenario of the compound as drawn by experimental data, confirming the spin-phonon Raman relaxation mechanism, and a direct quantum tunnelling in the ground state as the most plausible relaxation pathway in zero field.
Introduction
Single-Molecule Magnets (SMMs) can in principle be used for encoding binary information and for data processing, exploiting their magnetic bistability and inherent quantum behavior.1 Research in this field moves in different directions, such as finding better performing systems,2,3 developing reliable methods to deposit molecules on solid substrates,4,5 and finding ways to control molecular magnetism by external stimuli, including light and pressure.6–8 Complexes containing only one metal centre may represent the smallest chemically-tuneable SMMs for spin-based devices,9 and significant progresses have been made in this regard by using both lanthanides3,10 and, more recently, 3d metal ions.10,11 In the latter case, relaxation by quantum tunnelling is usually very fast in zero field, so that application of a static field is required to observe SMM behaviour by alternating current (ac) susceptibility measurements. However, few examples of zero-field SMMs based on mononuclear complexes of iron(I)12 iron(III),13 and cobalt(II) have been reported,14–25 which all feature half-integer spin states (3/2 or 5/2). In particular, individual cobalt(II) ions were found to exhibit zero-field SMM behaviour when embedded in tetrahedral,14–17,20,22,24 trigonal prismatic18,19,23 or linear21 coordination environments, or in a solid state lattice.25 In all these cases, the metal complexes possess a negative zero field splitting (zfs) parameter D, thus suggesting to look for other coordination environments suitable to enforce an easy axis magnetic anisotropy on the cobalt(II) ion.
The bpp (2,6-bis(pyrazol-1-yl)pyridine) class of ligands are well known to promote spin crossover (SCO) in their octahedral iron(II) metal complexes.26–28 These ligands can host both high spin (HS) and low spin (LS) iron(II) centers,27 thus enabling spin state modulation by temperature or application of light.29,30 In some cases, the distortion of the octahedral geometry is so pronounced as to block the metal centre in its HS state, as we recently found using bpp-COOMe (methyl 2,6-di(pyrazol-1-yl)pyridine-4-carboxylate).26 In particular, in the distorted molecular structure of [Fe(bpp-COOMe)2](ClO4)2, the pseudo-octahedral coordination environment leads to a stabilization of the dxy orbital relative to dxz and dyz (where z represents the trans-N{pyridyl}–Fe–{pyridyl}
4
Such orbital pattern is expected to produce an easy axis anisotropy for cobalt(II), as sought for.31 We have thus synthesized [Co(bpp-COOMe)2](ClO4)2 (1) by reaction of cobalt(II) perchlorate with bpp-COOMe and found this compound to be isostructural to the iron(II) complex.26 From the study of its magnetic properties we positively discovered that 1 indeed has an easy axis anisotropy and shows SMM behaviour under an applied external field. Magnetic dilution in its zinc(II) analogue, [Zn(bpp-COOMe)2](ClO4)2 (2), afforded [Zn0.95Co0.05(bpp-COOMe)2](ClO4)2 (3), where dipolar interactions are reduced and slow relaxation of the magnetization is detectable even in zero field. To the best of our knowledge, this discloses the first fully-characterized pseudo-octahedral cobalt(II) complex with easy-axis anisotropy acting as a zero-field SMM.32 Here we present the detailed and critical description of the experimental data collected by direct current (dc) and ac magnetic measurements, X-band Electron Paramagnetic Resonance (EPR) spectroscopy and single-crystal Cantilever Torque Magnetometry (CTM), together with ab initio theoretical calculations supporting the magnetic properties of 1.
Experimental Section
General InformationCo(ClO4)2·6H2O and Zn(ClO4)2·6H2O were of reagent grade and used as received. Diethyl ether was pre-dried over CaCl2 overnight and distilled from sodium/benzophenone under N2 before use, CH3CN was treated with CaH2 and then distilled under N2. Elemental analyses were recorded using a Carlo Erba EA1110 CHNS-O automatic analyser. Zn and Co contents in 3 were evaluated with a Perkin Elmer Optima 5300 DV Inductively Coupled Plasma Optical Emission Spectrometer (ICP-OES) equipped with a concentric nebulizer. 1H NMR spectra were recorded on a 400 MHz Bruker FT-NMR Advance400 spectrometer at room temperature. Proton chemical shifts are given in parts per million (ppm) versus external TMS, and were determined by reference to the solvent residual signals (1.94 ppm for CHD2CN); coupling constants are given in Hz. IR spectra were recorded as KBr discs using a Jasco FTIR-4700LE spectrophotometer with a 2 cm−1 resolution. Ligand bpp-COOMe was synthesized as previously reported.26 Further details on the X-ray structure determination of 1 and 2 (Table S1 in the Electronic Supplementary Information, ESI), dc and ac magnetic measurements, CTM and EPR experiments and theoretical calculations can be found in ESI.
5 Synthesis of [Co(bpp-COOCH3)2](ClO4)2 (1)
Ligand bpp-COOMe (36.0 mg, 0.134 mmol) was suspended in acetonitrile (3 mL). Addition of Co(ClO4)2·6H2O (24.3 mg, 0.0664 mmol) caused dissolution of the ligand upon formation of the desired complex with an immediate colour change to purple-red. After 30 minutes stirring, the filtered solution was put in vapour diffusion with diethyl ether (5 mL). X-ray quality light red crystals appeared within a day, and were collected after one week at complete diffusion (39.4 mg, 74.5%). Elemental analysis (%) found: C, 39.90; H, 2.88; N, 17.99. Calcd for C26H22Cl2CoN10O12 (796.35): C, 39.21; H, 2.78; N, 17.59. IR (KBr): νmax/cm–1 1738s (νC=O ester), 1632s, 1580s, 1523s and 1405s (νC=C, νC=N), 1460s and 1444m (δC–H), 1095s (νClO4-) and 1056s (νC–O).
Synthesis of [Zn(bpp-COOCH3)2](ClO4)2 (2)
The above-described procedure, starting from bpp-COOMe (39.0 mg, 0.145 mmol) and Zn(ClO4)2·6H2O (27.6 mg, 0.0741 mmol), afforded colourless crystals of the title compound suitable for X-ray diffraction (40.0 mg, 68.8%). Elemental analysis (%) found: C, 39.05; H, 3.04; N, 17.48. Calcd for C26H22Cl2N10O12Zn (802.83): C, 38.90; H, 2.76; N, 17.45. IR (KBr): νmax/cm–1 1738s (νC=O ester), 1632s, 1584s, 1522s and 1405s (νC=C, νC=N), 1458s and 1444m (δC–H), 1095s (νClO4-) and 1058s (νC–O). 1H NMR (400 MHZ, CD3CN, 293 K): δ = 8.73 (d, J1 = 2.8 Hz, 2H, H5-pz), 8.45 (s, 2H, H3/5-py), 7.62 (d, J2 = 1.6 Hz, 2H, H3-pz), 6.70 (dd, J1 = 2.8 Hz, J2 = 1.6 Hz, 2H, H4-pz), 4.11 (s, 3H, OCH3) ppm.
Synthesis of [Zn0.95Co0.05(bpp-COOCH3)2](ClO4)2 (3)
The above-described procedure, starting from bpp-COOMe (81.2 mg, 0.302 mmol), Co(ClO4)2·6H2O (2.9 mg, 0.0079 mmol) and Zn(ClO4)2·6H2O (53.9 mg, 0.145 mmol) using 6 mL of acetonitrile and 10 mL of diethyl ether, afforded very light orange crystals of the title compound suitable for X-ray diffraction (91.7 mg, 75.8%). Elemental analysis (%) found: C, 39.22; H, 2.83; N, 17.46; Co, 0.40; Zn, 8.04. Calcd for C26H22Cl2N10O12Zn0.95Co0.05 (802.51): C, 38.91; H, 2.76; N, 17.45; Co, 0.37; Zn, 7.74. IR (KBr): νmax/cm–1 1737s (νC=O ester), 1632s, 1584s, 1522s and 1405s (νC=C, νC=N), 1458s and 1444m (δC–H), 1095s (νClO4-) and 1058s (νC–O).
6
Results and discussion
Synthesis, crystallization and molecular structures
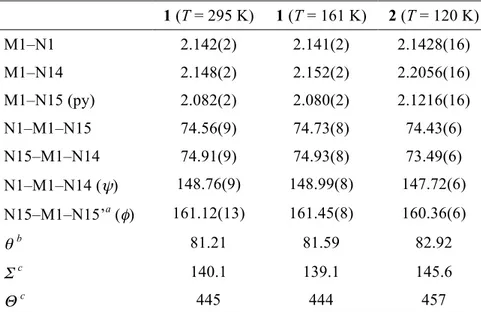
Reaction of a suspension of bpp-COOMe in acetonitrile with M(ClO4)2·6H2O (M = Co, Zn, either as pure salts or in mixture) at room temperature produced the immediate dissolution of the ligand and formation of a solution, which gave well-formed X-ray quality crystals of 1 (light red), 2 (colourless) or 3 (very light orange) in good yields by vapour diffusion with diethyl ether. The crystals of the three compounds are air stable, belong to monoclinic space group C2/c and are isomorphous to the iron(II) derivative recently studied for its SCO properties (see Table S2 in ESI for a comparison of the room temperature unit cell parameters).26 X-ray diffraction data were collected at 295 and 161 K for 1 and at 120 K for 2 in order to determine their molecular structures, and the main bond distances and angles so obtained are reported in Table 1.
In all cases, metal coordination environments show pronounced distortion from perfect octahedral geometry (Fig. 1 and Fig. S1 in ESI). This is best outlined by the trans-N{pyridyl}–M– N{pyridyl} angle (φ) and by the dihedral angle between the least squares (l.s.) planes of the two mer-mer-coordinated ligands (θ), which lie far from the ideal 180° and 90° values, respectively.27 Although the cobalt(II) ion in 1 is Jahn-Teller active,33 the described distortion is most probably caused by crystal-packing effects, since it is present to almost the same extent in the zinc(II) derivative 2. Notice that the most regular geometry would still exhibit departures from perfect octahedral symmetry due to the intrinsic shape of bpp ligands, which imposes a clamp angle ψ < 180°. The distortion is also highlighted by the high values of the parameters Σ and Θ (Table 1). The first parameter is a general measure of the deviation of a metal ion from an ideal octahedral geometry, while Θ more specifically indicates its distortion from an octahedral towards a trigonal prismatic structure.28 In fact, a perfectly octahedral complex would give Σ = Θ = 0.
The Co–N bond distances in 1 (Table 1) range from 2.08 Å with the pyridyl nitrogen atom (ring C) to about 2.15 Å with the pyrazolyl moieties (rings A and B), which are partially rotated by about 6–10° with respect the l.s. plane of the whole ligand; these values remain the same within experimental error upon variation of the temperature. The ester group is coplanar with the pyridyl ring C and is involved in one of the two shortest intermolecular interactions with one pyrazolyl C– H group (at 161/295 K, C1(H1)···O17 = 3.252/3.291 Å, C1–H1···O17 = 147.6/148.9°, which leads to a Co···Co distance of 9.642 (9.664) Å. The second short intermolecular contact involves another C–H group and the pyrazolyl ring of the adjacent molecule (at 161/295 K: C12(H12)···centroid(ring A) = 3.47/3.52 Å, C12–H12···centroid(ring A) = 150/149°) with a shorter intermolecular Co···Co
7
distance of 8.494/8.530 Å. Perchlorate anions are located in the voids between cations and all their oxygen atoms are involved in weak C–H···O interactions (Fig. S1 and Tables S3 and S4 in ESI).
The zinc derivative 2 shows similar structural features compared to 1, with only slightly longer Zn–N distances with pyrazolyl rings (Table 1) but fully comparable crystal packing (Table S5 in ESI). This allowed to successfully obtain a diamagnetically-diluted crystalline sample 3 containing a Zn:Co = 18:1 ratio (i.e. Zn0.9475Co0.0525), as confirmed by ICP-OES measurements.
Fig. 1 Molecular structure of the cation [Co(bpp-COOMe)2]2+ of 1 at low T in a perspective view with ring
labelling: ring A = N1N4C3C2C1, ring B = N14N10C11C12C13, ring C = N15C5C6C7C8C9, where N1, N14 and N15 are the donor atoms to cobalt. Colour code: Co = azure, O = red, N = blue, C = light grey, H = white; easy axis = red, intermediate axis = green, hard axis = yellow.
Table 1 Main bond lengths (Å) and angles (°) of 1 (Co) and 2 (Zn).
1 (T = 295 K) 1 (T = 161 K) 2 (T = 120 K) M1–N1 2.142(2) 2.141(2) 2.1428(16) M1–N14 2.148(2) 2.152(2) 2.2056(16) M1–N15 (py) 2.082(2) 2.080(2) 2.1216(16) N1–M1–N15 74.56(9) 74.73(8) 74.43(6) N15–M1–N14 74.91(9) 74.93(8) 73.49(6) N1–M1–N14 (ψ) 148.76(9) 148.99(8) 147.72(6) N15–M1–N15’a (φ) 161.12(13) 161.45(8) 160.36(6) θ b 81.21 81.59 82.92 Σ c 140.1 139.1 145.6 Θ c 445 444 457
a primed atom is obtained from unprimed one through twofold rotation; b dihedral angle between the two ligands (the plane of each ligand was defined as the least-squares plane through its sixteen aromatic C/N atoms); c see ref. 28 for its definition.
8 Static magnetic properties
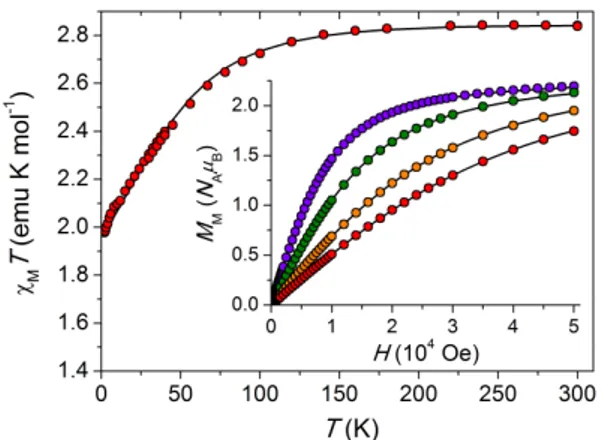
Dc magnetic susceptibility data of 1 were recorded in the 2–300 K temperature range in a low field regime (1 kOe up to 30 K and 10 kOe from 30 to 300 K), together with the field dependence of the isothermal molar magnetization, MM, at low temperature (Fig. 2). At 300 K, the product of the molar magnetic susceptibility, χM, with the temperature, T, is about 2.84 emu K mol–1, against an expected spin-only value of 1.875 emu K mol–1 for an S = 3/2 ion with g = 2.00. This difference indicates a relevant orbital contribution to the magnetism, which can be parametrized in first approximation by assuming g = 2.46. The χMT value remains almost unvaried upon cooling down to 90 K, where it begins to slowly decrease to 1.98 emu K mol–1 at 2.0 K, consistent with the depopulation of the spin-orbit and low-symmetry split states of the 4T
1g(Oh) electronic term.
Fig. 2 Temperature dependence of the χMT product (red circles in the main panel) for 1; inset: field
dependence of the molar magnetization, MM, at 1.8 (blue), 3.0 (green), 5.0 (yellow) and 7.0 (red) K. Solid
lines are given by the best-fit parameters (see text).
While a spin Hamiltonian formalism might be inadequate to account for the electronic structure of the cobalt(II) ion,34 we first used the following Hamiltonian to fit simultaneously the experimental χMT(T) and MM(H) data with PHI program:35
ℋ = ℋ!""#$%+ ℋ!"#= 𝜇!𝐵 ∙ 𝒈 ∙ 𝑆 + 𝑆 ∙ 𝑫 ∙ 𝑆 = 𝑔!𝜇!𝐵!𝑆!+ 𝑔!𝜇!𝐵!𝑆!+ 𝑔!𝜇!𝐵!𝑆! + 𝐷 𝑆!!−!
!𝑆 𝑆 + 1 + 𝐸 𝑆!!− 𝑆!! (1)
where D and E are the axial and transverse second-order anisotropy parameters and gx, gy and gz are
the principal components of the 𝒈 matrix for the S = 3/2 state (𝑫 and 𝒈 were assumed to be collinear). Taking an axial 𝒈 matrix with gx = gy for simplicity, a systematic survey was performed
with gα (α = x, y, z) values from 1.8 to 3.2 and diagonal components of 𝑫 from –90 to 90 cm
–1. An accurate fit was only possible for negative D values and a unique solution fulfilled the condition
9
expected for easy axis cobalt(II) ions, namely gz > gx = gy: D = –57.5(7) cm–1, |E| = 15.7(3) cm–1, gx
= gy = 2.332(4), gz = 2.6687(15). As can be noticed, the cobalt(II) ion has an easy-axis anisotropy
but with a relevant rhombic distortion as given by |E/D| = 0.273 (the sign of E is irrelevant for powder measurements when gx = gy). The resulting splitting of the S = 3/2 manifold is 2(D2 +
3E2)1/2 = 127 cm–1.
Torque magnetometry
To gain independent experimental evidences of the magnetic anisotropy, CTM experiments were performed on a face-indexed single crystal of 1 mounted on a rotating capacitive cantilever torquemeter. The device measures the torque component (τY) along the rotation axis (Y) whereas the
magnetic field is applied normal to it in the XZ plane at an angle θ from Z (θ increases going from Z towards –X).36,37 The measured torque is thus given by:
𝜏! = 𝑚!𝐵!− 𝑚!𝐵! (2)
where m = (mX, mY, mZ) is the magnetic moment of the sample and B = (BX, 0, BZ) is the applied
magnetic field. Two rotations (Rot1 and Rot2) were performed with the XYZ frame corresponding to the orthogonalized crystallographic frame a*bc (Rot1) or –a*cb (Rot2), see ESI for further details. Thanks to the fact that the cobalt(II) ion in 1 is located on a binary axis of monoclinic C2/c space group, only one molecule is magnetically independent. Moreover, one of the principal directions of the magnetic anisotropy tensor (say, y) must coincide with this binary axis, which is parallel to b, while the others (x and z) must lie in the a*c plane. When scanning this plane, as in Rot1, and working in the low-field limit eq 2 becomes:
𝜏!( ) = 𝐵! 𝜒
!!− 𝜒!! sin cos (3)
where 𝜒 is the susceptibility tensor and φ = θz – θ is the angle between the principal anisotropy axis z and B (i.e. at θ = θz the magnetic field is applied along z). The principal directions of the
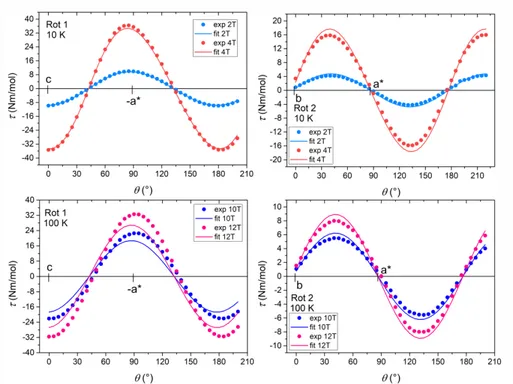
anisotropy tensor, separated by π/2 but arbitrarily located in the a*c plane are easily detected as zero-torque points. Furthermore their easy or hard character becomes evident by increasing the field at low temperature: when the low-field limit is no longer valid the curves become steeper around the hard-axis zero-torque point.37 The measurements, performed at the temperature of 10 K under a static magnetic field of 2 and 4 T, and at 100 K with a magnetic field of 10 and 12 T, are reported in Fig. 3, while data at intermediate temperatures are available in Fig. S2 in ESI.
In Rot1 (XYZ = a*bc) at 10 K we find the first torque zero at θ = 43° going from c toward –a*; thus the first in-plane principal direction (x) deviates by only ca. 10° from the a crystallographic axis (see Fig. S3 in ESI). The second torque zero occurs at θ = 133° and corresponds to the second
10
in-plane principal direction z (θz = 133°). The sign of the measured torque signal directly indicates
that z (x) is the easy (hard) in-plane direction. The same conclusion can be reached looking at the 4 T data. At this field the torque curve deviates from the simple angular dependence of eq 3, showing a steeper angular variation θ = 43°, which is identified as the hard direction in the scanned plane.
For Rot2 (XYZ = –a*cb) the two torque zeros are found at θ = 0° and 90° as expected, i.e. when the field is applied along b and a* crystallographic axes, respectively. Unlike the former, the latter field orientation does not individuate a principal anisotropy axis but only its projection on the a*b plane. Both the sign and the shape of the torque signal in this rotation indicate that the crystal is more easily magnetized along a* than along b. However, from a qualitative analysis it is not possible to establish whether b is the overall intermediate or hard anisotropy axis. To solve this ambiguity, the data at T = 10 K were numerically simulated with the S = 3/2 spin Hamiltonian in eq 1. As a first step, 𝒈 and 𝑫 matrices were constrained to have the principal values determined by dc magnetic measurements, but their common principal directions were left free to reorient in space and an overall scale factor was refined. In a second step, the principal values were also left free to vary, but this did not provide any improvement in the agreement.
Fig. 3 Experimental (dots) and simulated (solid lines) curves obtained with CTM for two rotations at 10 and
100 K under different static magnetic fields. The common orientation of 𝒈 and 𝑫 matrices was optimized on the 10 K data using the principal values obtained from magnetization and susceptibility data.
11
In the end, the fitting procedure indicated that b is the overall intermediate axis (i.e. y in eq 1 with E > 0), while the a*c plane contains the easy (z) and hard (x) molecular magnetic axes, with the latter at ca. 10° from a. In Fig. 1 the orientation of the anisotropy axes is superimposed to the molecular structure, where the principal axes are not pointing towards the ligand atoms but between them. The good agreement between simulated and experimental torque data confirms the spin Hamiltonian parameters extracted from static magnetic measurements, in particular the negative sign of D with a relatively large rhombicity. On the other hand, Fig. 3 shows that the agreement is less satisfactory at 100 K. The inclusion of rhombicity in the 𝒈 matrix (see EPR section below), i.e. gx≠gy, does not improve the quality of the fit, as indeed expected because torque measurements are
mainly sensitive to the 𝑫 tensor. Keeping in mind that the orbital angular momentum of the cobalt(II) ion may be not completely quenched, on increasing temperature the magnetic properties are affected by spin-orbit coupled states at higher energies and the description of the metal ion as a simple S = 3/2 spin may be no longer valid. This would result in a failure of the spin Hamiltonian approach leaving ab initio methods and explicit inclusion of orbital contribution34 as the only way to appropriately describe the system (see below).
EPR spectroscopy
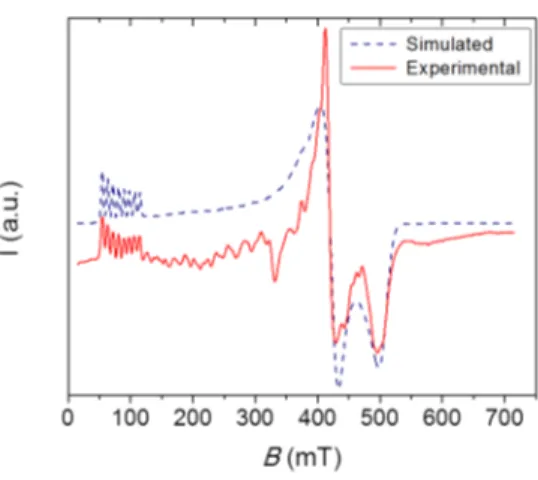
Since it can easily provide detailed information on the 𝒈 matrix, EPR spectroscopy can be regarded as a complementary technique to CTM. Low-temperature continuous-wave X-band EPR spectra were recorded on both powder and single crystal samples. The experimental spectrum of a powder sample of 3, shown in Fig. 4, can be easily interpreted as arising from an effective spin doublet with strongly anisotropic g factor and hyperfine coupling with the nuclear spin I = 7/2 of 59Co (natural abundance = 100%). Similar spectra were obtained for 1, although dominant dipolar broadening precludes resolution of the hyperfine structure (Fig. S4 in ESI). In this frame, it is evident that the anisotropy of the ground doublet is of easy axis type, with “parallel” transition at low fields, and a non-negligible rhombicity evidenced by the separation of the perpendicular transitions in the 400– 500 mT region. The experimental spectrum was simulated using the following spin Hamiltonian:38
ℋ′ = ℋ!
!""#$%+ ℋ!!!"#$%&'# = 𝜇!𝐵 ⋅ 𝒈!⋅ 𝑆′ + 𝑆!⋅ 𝑨!⋅ 𝐼′ (4)
where the primed parameters are associated with the effective spin S’ = 1/2. The best simulation was obtained by assuming an axial hyperfine coupling tensor (𝒜’1,2 = 2 ± 1 10–3 and 𝒜’3 = 3.20 ± 0.05 10–2 cm–1) and a moderately rhombic effective 𝒈! matrix (g’
1 = 1.37 ± 0.02, g’2 = 1.62 ± 0.02, and g’3 = 7.930 ± 0.002).
12
Fig. 4 X-band (ν = 9.43 GHz) continuous wave EPR spectrum recorded at 5 K on a powder sample of 3
(solid line), along with its simulation (dash line).
The principal values of the effective 𝒈! matrix can be related to the spin Hamiltonian parameters
of an S = 3/2 system through the following equations, valid only for easy axis systems, i.e. for D < 0:39 𝑔!! = 𝑔 ! 1 − !!!!!!!!! , 𝑔!! = 𝑔! 1 − !!!! !!!!! , 𝑔!! = 𝑔! ! !!!!!+ 1 (5)
where η = E/D. For purely axial anisotropy (η = 0) eq 5 affords g’1 = g’2 = 0 and g’3 = 3gz. The
non-zero experimental values of g’1 and g’2 are then consistent with a significant rhombic anisotropy. It is evident that, depending on the value of η, different solutions for gx, gy and gz can be
found, since the problem is over-parametrized. However, sets of solutions in reasonable accordance with those extrapolated from magnetic measurements and confirmed by CTM can be found by assuming the rhombicity to lie in the range –0.28 < η < –0.22. In particular, if one fixes η = –0.273, as obtained from the magnetic analysis, application of eq 5 provides the following estimates of the principal g values for the S = 3/2 system: gx = 2.125, gy = 1.935 and gz = 2.825. The outcome of this
analysis is that also the 𝒈 matrix has a non-negligible rhombicity, which can be clearly detected only by EPR, whereas the magnetic characterization techniques are mainly sensitive to 𝑫 anisotropy. One should also notice that the only way to reconcile the description of Hamiltonian in eq 4 with that of Hamiltonian in eq 1 is assuming that 𝒈 and 𝑫 for the S = 3/2 state have opposite rhombicities. This means that the smallest 𝒈 principal value is collinear with the intermediate direction of the 𝑫 tensor, while the intermediate 𝒈 component is along the hard direction of the 𝑫 tensor. The resulting partial compensation of the two rhombicities is consistent with the relatively small separation of the perpendicular transitions at high fields. Such behaviour is at first sight
13
counter-intuitive because both anisotropies arise from the same phenomenon, i.e. spin-orbit coupling (SOC).
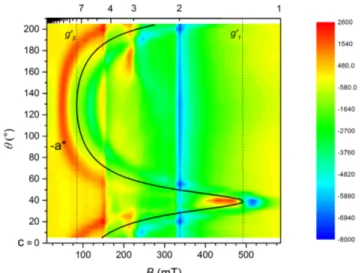
Finally we measured the angular dependence of the X-band EPR spectrum of a single crystal of
1 at low temperature to assign the easy, hard and intermediate directions of the magnetic anisotropy
of the ground doublet. The sample was set to rotate around b axis from θ = 0°, where B is parallel to c, to θ = 90°, where B is parallel to –a*, as in Rot1 of CTM measurements. The angular dependence of the spectra is shown in Fig. 5: the maximum resonant field (Bres = 491.5 mT, corresponding to
geff = 1.37) is observed at θ = 40°, while the minimum one is found at θ = 130° (Bres = 85.7 mT, geff = 7.93). Within experimental error (± 5°), these two extremes occur along the principal directions of the 𝑫 tensor, as determined by CTM (Fig. 3). Furthermore, since geff = 1.37 and 7.93 are also the highest and the lowest resonance fields observed in the powder spectrum (Fig. 4), both the easy and the hard direction of geff lie in the a*c plane, confirming our assignment of b as the intermediate anisotropy axis, though it corresponds to the smallest component of the true 𝒈 tensor.
Fig. 5 Angular dependence of the resonant fields of X-band (ν = 9.41 GHz) EPR of a single crystal of 1 at 5
K. The black solid line is the simulated angular dependence of the resonance field using the parameters reported in the text. The blue line marks a g = 2.00 reference impurity in the cavity.
An alternative description of the electronic structure of distorted octahedral cobalt(II), which explicitly takes into account the unquenched orbital angular momentum, should involve the use of Griffith Hamiltonian:40
ℋ = −!!𝜅𝜆𝐿 ∙ 𝑆 + Δ!" 𝐿!!−!
!𝐿 𝐿 + 1 + Δ!! 𝐿!!− 𝐿!! + 𝜇!𝐁 ∙ 𝑔!𝑆 − !
!𝜅𝐿 (6)
which operates on the ground 4T1g term of the octahedral cobalt(II) ion. Using the T−P isomorphism,41 the orbital (L = 1) and spin (S = 3/2) angular momenta interact via SOC as
14
described by the first term of the Hamiltonian. Here, the orbital reduction parameter (κ) takes into account both the covalence effect and the mixing of 4T1g(4F) with 4T1g(4P) due to the crystal field, while –3/2 is a constant required by T–P isomorphism. The second term of this Hamiltonian represents the effect of an axial crystal field, resulting in a splitting of the orbital triplet 4T1g in octahedral symmetry into 4A2g (ML = 0) and 4Eg (ML = ±1) in tetragonal symmetry. The third term
models the rhombic component of the crystal field, which removes the degeneracy of the orbital doublet as symmetry is further lowered to C2. In this framework, a negative (positive) value of Δax results in a ground 4Eg (4A2g) term and corresponds to easy axis (easy plane) anisotropy.34,42,43 Finally, the fourth term is the Zeeman interaction, which comprises both spin and orbital contributions. Despite the large number of parameters, by fixing the SOC constant to the free ion value (λ = –180 cm–1) the pattern of effective g factors for the ground doublet could be reproduced38 using parameters lying in a relatively narrow range: –2100 < Δax < –1650 cm–1, 100 < Δrh < 160 cm–1, 0.8 < κ < 1.00 (Fig. S5 in ESI). The best agreement was found for Δax = –1850 cm–1, Δrh = 120 cm–1, κ = 0.9, λ = –180 cm–1, corresponding to Δrh/Δax ~ 0.07. With this set of parameters, the first- and second-excited spin-orbit doublets lie at 212 and 550 cm–1 from the ground state (Table S6 in ESI), respectively, suggesting that a spin Hamiltonian formalism might not be appropriate for modelling the high temperature magnetic behaviour.
However, when Griffith Hamiltonian is used to reproduce torque measurements, the resulting best-fit parameters are much more rhombic. An acceptable reproduction of the experimental results (Fig. S6 in ESI) indeed requires Δrh/Δax ~ 0.22 while keeping Δax = –1900 cm–1, κ = 0.9, λ = –180 cm–1. This parameter set provides a different energy pattern (Table S6 in ESI), with a prominent splitting of the tetragonal 4Eg state. As a consequence, the two lowest-lying spin-orbit doublets (separated by ca. 120 cm–1) are well isolated from the third one, which lies ca. 980 cm–1 higher in energy. In this scenario the use of a spin Hamiltonian model seems appropriate and the analysis of dc magnetic data consistently provided the same splitting between the two lowest-lying doublets, i.e. 127 cm–1.
Dynamic magnetic properties
ac magnetic susceptibility measurements of 1 in zero static field did not display any temperature-dependent peak in the out-of-phase susceptibility, χMʹ′ʹ′. Given the Kramers nature of cobalt(II), this suggests that quantum tunnelling (QT) relaxation paths, induced by hyperfine interactions or intermolecular dipolar couplings, accelerate the relaxation of the magnetization beyond detection. In a 1 kOe static field, however, clear maxima appeared in the 10–10000 Hz frequency range,
15
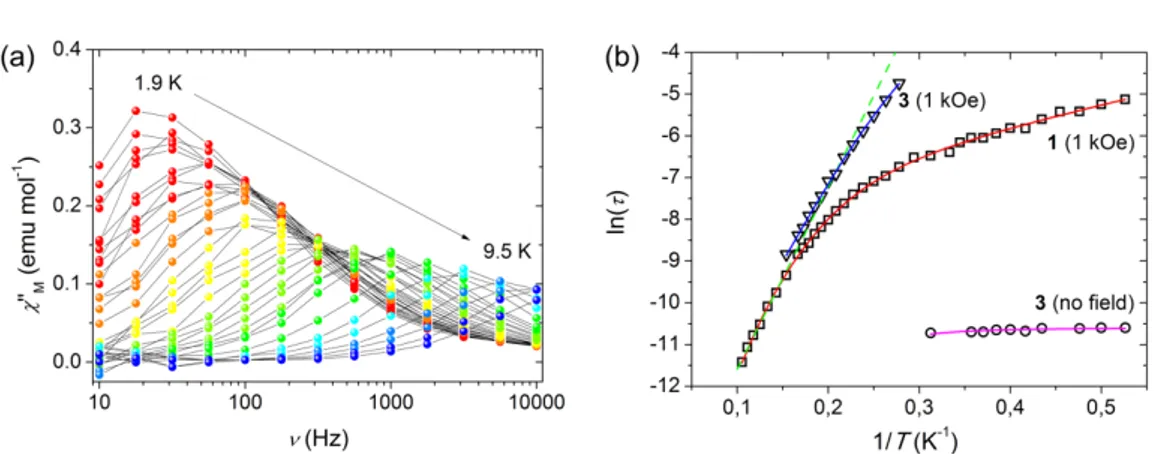
whose position is temperature dependent (Fig. 6a and Fig. S7 in ESI). Treatment of the isothermal χMʹ′ʹ′(ν) plots with a generalized Debye model allowed to extract the relaxation time τ at each temperature.44 These data are shown in Fig. 6b as a lnτ(1/T) plot. In the highest temperature interval, between 6.5 and 9.5 K, the plot appears to be linear and can be suitably fitted with the Arrhenius law (lnτ = lnτ0 + Ueff/kBT) with best-fit parameters Ueff/kB = 43.6(2) K and τ0 = 1.2(2) × 10–7 s (green line in Fig. 6b). These values are in the range previously observed for field-induced pseudo-octahedral mononuclear SMMs.45 The observed activation barrier to magnetic relaxation, however, is well below the splitting between the two lowest-lying doublets (127 cm–1 or 165 K, as estimated from dc magnetic data of 1, see above). On lowering temperature, a distinct curvature appears in the plot; this deviation from the simple Arrhenius-like behaviour can be due to processes induced by either non-resonant spin-phonon interactions in the solid state46,47 or to tunnel mechanisms. In order to reproduce the temperature dependence of the magnetic relaxation in the whole temperature range, QT (A), direct (BT) and Raman (CTn) relaxation processes were taken into
account in addition to the previous Orbach term, as outlined by the following equation:
τ–1 = τ0–1 exp(–Ueff/kBT) + A + BT + CTn (7)
Fig. 6 (a) Imaginary component of the ac susceptibility, χM'', of 1 measured at 1 kOe applied static field in
the 10–10000 Hz frequency range and in the 1.9(red)–9.5(blue) K temperature range; grey lines are a guide for the eye. (b) Arrhenius plot for 1 at 1 kOe applied static field (o) and 3 in zero (s) and 1 kOe static field (¡). The green dotted line is given by the fitting of 1 in the 6.5–9.5 K range with an Orbach model, while the red curve employs a mixed Raman and direct one. The magenta and blue lines display the fitting of zero field and 1 kOe data of 3; see text for further discussion.
To avoid over-parametrization, the number of fitting terms was kept as low as possible, and the quantum tunnelling mechanism was considered to be quenched by the applied static field (A = 0). Upon either including an Orbach mechanism (with fixed τ0 and Ueff values taken from the high-T
16
region) or excluding the Raman term, the model was unable to account for the low temperature relaxation behaviour. A Raman process along with direct phonon-induced relaxation at low temperature (C = 0.45(8) s–1 K–n, n = 5.38(9), B = 103(4) K–1) gave the best results (red line in Fig. 6b). The exponent n of the Raman relaxation process for a Kramer ion should be equal to 9,20,48 but several factors can contribute to lower its value,20 like the presence of low-lying excited electronic states, for which n = 5 is postulated.48
Dipolar interactions in the solid state can provide efficient relaxation pathways in zero field and hinder the detection of magnetization dynamics. Dilution of SMMs in a diamagnetic matrix has been identified as a key tool for reducing such long-range couplings, affording a measurable zero-field relaxation.14,49 The effect of dipolar interactions in 1 was then ascertained by analysing the ac response of diamagnetically-diluted sample 3. Unlike in 1, a set of clearly visible peaks appeared in the χMʹ′ʹ′(ν) isothermal profiles of 3 in zero field in the 1.9–3.2 K range (Fig. S8 in ESI). The maxima of these peaks display a feeble dependence on temperature that could be reproduced considering a Raman relaxation process with QT. A best-fit procedure, whose results are reported as a magenta line in Fig. 6b, yielded C = 11(2) s–1 K–n and a tunnelling frequency A = 40.3(5) kHz, being the n exponent kept fixed at 5.38 as in 1 to avoid over-parametrization. The onset of a QT relaxation path in zero field is in line with the rhombicity of 1 and the unavoidable presence of hyperfine interactions which are necessary to promote tunnelling. These data show, to the best of our knowledge for the first time, that slow magnetic relaxation in zero field can be achieved in a pseudo-octahedral cobalt(II) complex, provided that intermolecular magnetic interactions are efficiently reduced. A similar effect given by magnetic dilution on easy axis systems was previously reported only in a tetrahedral cobalt(II) compound.14 It is also most probably the reason for zero-field slow magnetic relaxation in the CoIICoIII3 SMM family, where the magnetically-active trigonal prismatic cobalt(II) centre is partly isolated from the neighbours by three diamagnetic cobalt(III) ions.18
Upon application of a 1 kOe static field, the magnetization dynamics of 3 slows down significantly due to the further suppression of relaxation pathways induced by QT (Fig. S9 in ESI). The high-temperature data almost overlap with those detected for 1 suggesting that, when a linear regime in the Arrhenius plot is observed, the effective barrier is much smaller than the separation between the ground and the first excited doublets. This indicates the key role played by non-resonant phonons in the high-temperature range.46 The data can be phenomenologically reproduced including Raman and direct relaxation processes (blue line in Fig. 6b), as for data fitting of 1. The best-fit parameters (C = 0.015(5) s–1 K–n, n = 7.0(2), B = 0(4) K–1) indicate that application of a 1
17
kOe dc field suppresses the direct pathway and leads to an increased n exponent, in line with a previous report on trigonal antiprismatic cobalt(II) complexes with uniaxial anisotropy.50
Theoretical calculations
To better understand and quantify the overall electronic structure of cobalt(II) and its magnetic anisotropy in 1, ab initio multi-reference calculations using the ORCA51 and MOLCAS52 software packages were carried out. ORCA produces two sets of results: CASSCF and NEVPT2 both including spin-orbit contributions introduced by the quasi-degenerate perturbation theory (QDPT). MOLCAS has been employed to provide CASSCF and CASPT2 results, including spin-orbit effects that have been introduced with SO-RASSI method. Tables S7–S10 in ESI report the spin-free (δE) and spin-orbit (ΔE) state energies, while Table 2 and Tables S11 and S12 in ESI gather the second-order anisotropy parameters, as described by eq 1, the diagonalized 𝒈 and 𝑫 matrices and the energy difference between the ground and the first excited Kramers’ doublet (KD) computed with different methods and the standard basis set starting from the structures of 1 at 161 and 295 K, respectively.
Before including the spin-orbit effects, all calculations agree to indicate an orbitally nondegenerate S = 3/2 ground state. In fact, the crystal field term of the octahedrally-coordinated high-spin cobalt(II) ion (4T1g) splits into three orbital singlets as the symmetry is lowered to C2. Each of these orbitally nondegenerate spin quartets is further split by SOC into two KDs (Fig. S10). In all cases, the ground and first excited KDs are energetically well separated from the higher KDs, suggesting that a spin Hamiltonian formalism may be justified in the present case.
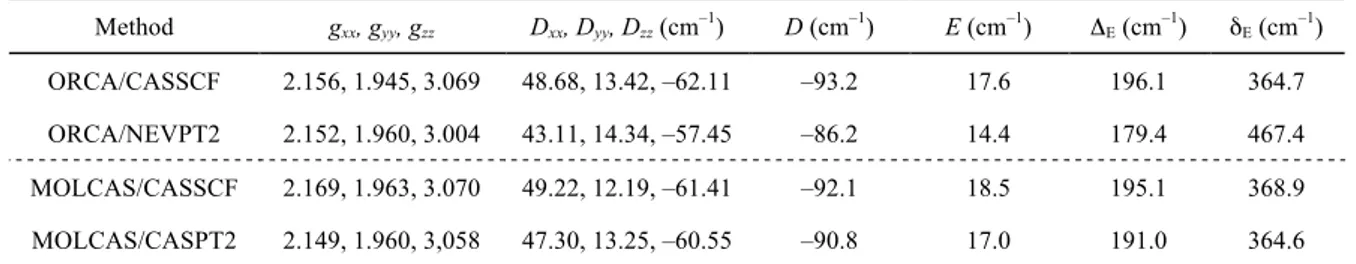
Table 2 D, E, diagonalized 𝒈 and 𝑫 matrices and energy difference between the ground and the first excited KD (ΔΕ) computed using the structure of 1 at 161 K with different methods and the standard basis set (see SI). For comparison, the first excitation energy (δE) in the absence of SOC for the ground state is also
reported. Method gxx, gyy, gzz Dxx, Dyy, Dzz (cm–1) D (cm–1) E (cm–1) ΔE (cm–1) δE (cm–1) ORCA/CASSCF 2.156, 1.945, 3.069 48.68, 13.42, –62.11 –93.2 17.6 196.1 364.7 ORCA/NEVPT2 2.152, 1.960, 3.004 43.11, 14.34, –57.45 –86.2 14.4 179.4 467.4 MOLCAS/CASSCF 2.169, 1.963, 3.070 49.22, 12.19, –61.41 –92.1 18.5 195.1 368.9 MOLCAS/CASPT2 2.149, 1.960, 3,058 47.30, 13.25, –60.55 –90.8 17.0 191.0 364.6
Calculations also produce similar and negative values of D, with a negligible effect due to the use of the molecular structures at the two different temperatures (161 and 295 K, Table S11 in ESI).
18
However, a small but systematic trend can be observed, consisting in a decrease of |D| and an increase of E upon cooling. The calculated |D| values are ca. 50% larger than obtained from the fitting of the experimental data, while the computed values of E are in good agreement with experiments. In order to evaluate the possible effect of the employed basis set on the computed zfs parameters, calculations were repeated with a larger basis set using the structure of 1 at 161 K (Experimental Section and Table S12 in ESI). The new results show just small differences as compared with the standard basis, with slightly larger |D| and E. The effect is more pronounced in MOLCAS than in ORCA.
The sign and value of D can be rationalized using the spin-orbit operator, which is responsible for the coupling between ground and excited states.10,53 When the excitation occurs between orbitals with the same |ml| values, the MS = ±3/2 components become more stable, and thus a negative
contribution to D is obtained. On the other hand, an excitation between orbitals involving a |Δml| =
1 change, which produce stabilized MS = ±1/2 components, leads to a positive contribution to the D
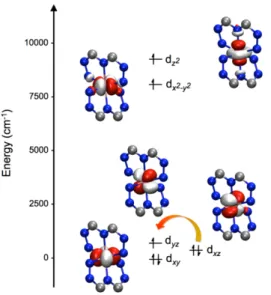
value. Compound 1 displays a distorted octahedral core that produces the d-orbital splitting shown in Fig. 7, which is obtained from the ORCA/NEVPT2 calculation by using the ab initio ligand field theory (AILF) method.10,54 As may be observed, the degeneracy of the t2g and eg orbitals of the regular octahedron is lifted. This indicates that the initial octahedral 4T
1g ground state should evolve into a lower-energy term in C2 symmetry (Fig. S10 in ESI). The AILF method allows the identification of the d orbitals in 1 after the splitting and the lowest-energy doubly-occupied orbital is dxy, which is followed by the doubly occupied orbital dxz (or dyz, because these cannot be
distinguished), while the first semi-occupied orbital is dyz (or dxz) (where z here represents the
trans-N{pyridyl}–Fe–{pyridyl} direction, and x and y the directions of the pyrazolyl nitrogen atoms). The other two orbitals (dx2-y2 and dz2) are found at higher energies. Thus, the first excitation should occur
within the dxz/dyz orbital pair and, since these orbitals have the same |ml| value, the larger
contribution to D should be negative, and consequently the magnetic easy axis nature of 1 is confirmed. This is in opposition with the most common orbital splitting for pseudo-octahedral cobalt(II) complexes, which usually brings the dxy orbital as first semi-occupied orbital,31 resulting
then in easy plane systems.
The calculated 𝑫 matrix has its intermediate axis (i.e. y in eq 1 with E > 0) along the twofold crystallographic axis b and the hard (x) and easy (z) directions in the a*c plane (Fig. S11 in ESI), with the hard axis x at 10° from a. Thus, the computed orientation of the zfs tensor compares very well with that obtained by both single-crystal CTM and EPR spectroscopy. The CTM experiments can be then nicely reproduced in the MOLCAS calculations by re-computing the magnetization of
19
the system along the different axes upon application of a rotating magnetic field (see Experimental Section in ESI for further details). The agreement between experimental and theoretical torque values for both Rot1 and Rot2 in the 10–100 K temperature range (Figs. S12 and S13 in ESI) is very satisfactory. This finding evidences the limitations of the S = 3/2 spin Hamiltonian approach to describe the magnetic properties of 1 at high temperature, as already stated above.
Turning now to g factors, their ab initio values (Table 2) are remarkably close to those obtained using eq 5. For instance the g factors resulting from ORCA/NEVPT2 calculations are gx = 2.152, gy
= 1.960 and gz = 3.004 to be compared while the experimental ones gx = 2.125, gy = 1.935 and gz = 2.825. The effective 𝒈! factors of the ground KD found in this same calculation, which can be
directly compared to those obtained from EPR experiments, are slightly more anisotropic: g’1 = 0.999, g’2 = 1.172 and g’3 = 8.566 (from EPR: g’1 = 1.37 ± 0.02, g’2 = 1.62 ± 0.02, and g’3 = 7.930 ± 0.002). The results obtained in the MOLCAS/CASPT2 calculation are also quite similar to both these sets of values: g’1 = 1.108, g’2 = 1.287 and g’3 = 8.570. The principal directions of the 𝒈 matrix are collinear with those of 𝑫, the largest g factor being along z. However, as shown in Fig. S11 in ESI, the smallest g value is computed along the twofold crystallographic axis (y) rather than along the hard direction of 𝑫 (x). As observed in single-crystal EPR experiments, the theoretical calculations indicate an inversion of the intermediate and hard axes between 𝒈 and 𝑫, i.e. opposite rhombicities, although we have at present no explanation for this.
Fig. 7 AILF computed d-orbital splitting for 1 (orbital energies: dxy 0.0 cm–1, dxz 444.6 cm–1, dyz 697.9 cm–1, dx2–y2 8121.0 cm–1, dz2 9257.3 cm–1). Colour code: Co = pink, C = grey, N = blue; H atoms and part of the ligands omitted for clarity. The orange arrow indicates the lowest-energy transition.
20
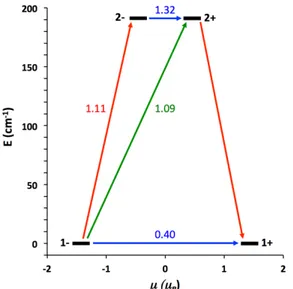
The spin relaxation pathways, which can be related to the dynamic magnetic properties of transition metal complexes, can be obtained directly through the SINGLE_ANISO55 code as implemented in MOLCAS. The computed relative energies of the lowest-lying KDs and the magnetization reversal pathway for 1, as obtained with the MOLCAS/CASPT2 calculation, are shown in Fig. 8. The calculations indicate a plausible relaxation pathway via a direct QT in the ground state; the matrix element of the transition within the 1– / 1+ ground doublet takes a value of 0.40, higher than the required threshold of 0.1 for an efficient relaxation mechanism.10 In addition, an Orbach process could be also plausible; for instance, the first excited KD is quite low in energy (191.0 cm–1) and the matrix elements related to the vertical and diagonal (Orbach) excitations are high enough (1.09 and 1.11, respectively) to allow the spin relaxation through these pathways. However, the experimental effective barrier for the thermally activated process is significantly smaller than the calculated one. Obviously, the horizontal transition between the 2– and 2+ states is allowed, enabling the possibility of QT between them. The second and third excited KDs are much higher in energy (ca. 648.2 and 928.8 cm–1, respectively) and therefore they are not expected to participate in the relaxation mechanism. These energy values resemble those found when the Griffith Hamiltonian is employed to reproduce the EPR results; in there, the first two KDs are separated by 212 cm–1 while the third one is found 550 cm–1 higher than the ground doublet (Table S6 in ESI). These results, combined with the ac magnetic susceptibility measurements of 1, confirm the spin-phonon Raman relaxation mechanism.
Fig. 8 Lowest two KDs and ab initio MOLCAS/CASPT2 computed relaxation mechanism for 1. The thick
black lines imply KDs as a function of their magnetic moment along the main anisotropy axis. Red lines indicate the magnetization reversal mechanism. The blue lines correspond to ground state QT and thermally-assisted QT via the first excited KD, and green lines show possible Orbach relaxation processes. The values
21
close to the arrows indicate the matrix elements of the transition magnetic moments (above 0.1 an efficient spin relaxation mechanism is expected).
If 1 were to follow the Orbach mechanism depicted by the calculations, the Ueff value would take
a higher value than the one obtained in the fitting (43.6(2) K) and this is clearly not the case, indicating that the spin relaxation pathway does not proceed by overcoming a thermal activation barrier. This behaviour is quite general for systems with large D and an explanation can be based on the fact that the Arrhenius law is only expected if the Debye description of the phonons is correct. Much smaller energy barrier and a deviation from Arrhenius at low temperature can be ascribed to the anharmonicity of the vibrational modes (a source of Raman-like relaxation).
Conclusions
The present results highlight the possibility to obtain slow magnetic relaxation in a mononuclear pseudo-octahedral HS cobalt(II) complex with dominant easy axis anisotropy in the absence of an applied dc field. In particular, the distortion of the coordination environment from perfect octahedral as created by the two mer-mer bpp-COOMe ligands in 1 induces the easy axis nature of the compound.
The observed magnetization dynamics is strongly affected by tunnel processes due to the rhombic magnetic anisotropy in zero field. In applied magnetic field, the behaviour deviated from the Arrhenius behaviour expected for an ideal SMM as the highest estimation of the energy barrier to be overcome is significantly smaller than the separation between the ground and first doublets. This behaviour has been observed in other highly anisotropic complexes56 and attributed to the efficiency of non-resonant optical phonons,46,47 which cannot be neglected if anharmonicity is taken into account. Even if the optimization of the magnetization dynamics of SMM requires therefore the control of several factors like tunnelling mechanisms and vibrational modes, the first step remains the rational design of the coordination environment able to generate magnetic bistability through the appropriate sign of the magnetic anisotropy. Octahedral cobalt(II), despite its large orbital contribution, has so far eluded to provide successful examples of genuine SMM behaviour. The combination of a detailed experimental investigation with theoretical modelling at different levels here described can provide valuable hints for a rational design of cobalt-based SMM.
Conflicts of interest
22
Acknowledgments
We thank the European Research Council, the Italian Ministero dell’Istruzione, dell’Università e della Ricerca (MIUR), the Polish Ministry of Science and Higher Education and the Spanish Ministerio de Economía y Competitividad for funding through the Advanced Grant MolNanoMas n. 267746, the FIRB project n. RBAP117RWN, the Iuventus Plus Programme grant agreement no. 0370/IP3/2015/73 and the grant CTQ2015-64579-C3-1-P, MINECO/FEDER, UE, respectively. E. R. thanks Generalitat de Catalunya for an ICREA Academia award. J. J. and E. R. thankfully acknowledge the computer resources in the Consorci Serveis Universitaris de Catalunya (CSUC).
References
1 D. Gatteschi, R. Sessoli and J. Villain, Molecular Nanomagnets, Oxford University Press, Oxford, 2006. 2 J. D. Rinehart, M. Fang, W. J. Evans and J. R. Long, J. Am. Chem. Soc., 2011, 133, 14236–14239.
3 (a) F.-S. Guo, B. M. Day, Y.-C. Chen, M.-L. Tong, A. Mansikkamaki and R. A. Layfield, Angew. Chem. Int.
Ed., 2017, 56, 11445–11449; (b) C. A. P. Goodwin, F. Ortu, D. Reta, N. F. Chilton and D. P. Mills, Nat. Letters,
2017, 548, 439–442.
4 (a) M. Mannini, F. Pineider, C. Danieli, F. Totti, L. Sorace, Ph. Sainctavit, M.-A. Arrio, E. Otero, L. Joly, J. C. Cezar, A. Cornia and R. Sessoli, Nature, 2010, 468, 417–421; (b) C. Wäckerlin, F. Donati, A. Singha, R. Baltic, S. Rusponi, K. Diller, F. Patthey, M. Pivetta, Y. Lan, S. Klyatskaya, M. Ruben, H. Brune and J. Dreiser, Adv.
Mater., 2016, 28, 5195–5199.
5 (a) L. Rigamonti, M. Piccioli, L. Malavolti, L. Poggini, M. Mannini, F. Totti, B. Cortigiani, A. Magnani, R. Sessoli and A. Cornia, Inorg. Chem., 2013, 52, 5897–5905; (b) L. Rigamonti, M. Piccioli, A. Nava, L. Malavolti, B. Cortigiani, R. Sessoli and A. Cornia, Polyhedron, 2017, 128, 9–17.
6 (a) O. Sato, Nat. Chem., 2016, 8, 644–656; (b) D. Pinkowicz, M. Rams. M. Mišek, K. V. Kamenev, H. Tomkowiak, A. Katrusiak and B. Sieklucka, J. Am. Chem. Soc., 2015, 137, 8795–8801.
7 (a) P. Parois, S. A. Moggach, J. Sanchez-Benitez, K. V. Kamenev, A. R. Lennie, J. E. Warren, E. K. Brechin, S. Parsons and M. Murrie, Chem. Commun., 2010, 46, 1881–1883; (b) S. A. Corrales, J. M. Cain, K. A. Uhlig, A. M. Mowson, C. Papatriantafyllopoulou, M. K. Peprah, A. Ozarowski, A. J. Tasiopoulos, G. Christou, M. W. Meisel and C. Lamprapoulos, Inorg. Chem., 2016, 55, 1367–1369.
8 (a) A. Prescimone, C. J. Milios, J. Sanchez-Benitez, K. V. Kamenev, C. Loose, J. Kortus, S. A. Moggach, M. Murrie, J. E. Warren, A. R. Lennie, S. Parsons and E. K. Brechin, Dalton Trans., 2009, 4858–4867; (b) A. Prescimone, J. Sanchez-Benitez, K. V. Kamenev, S. A. Moggach, A. R. Lennie, J. E. Warren, M. Murrie, S. Parsons and E. K. Brechin, Dalton Trans., 2009, 7390–7395.
9 F. D. Natterer, K. Yang, W. Paul, P. Willke, T. Choi, T. Greber, A. J. Heinrich and C. P. Lutz, Nature, 2017, 543, 226–231.
10 Gómez-Coca, S.; Aravena, D.; Morales, R.; Ruiz, E. Large Magnetic Anisotropy in Mononuclear Metal Complexes. Coord. Chem. Rev. 2015, 289–290, 379–392.
23 M. Murugesu, Chem. Sci., 2016, 7, 2470–2491.
12 (a) J. M. Zadrozny, D. J. Xiao, M. Atanasov, G. J. Long, F. Grandjean, F. Neese and J. R. Long, Nat. Chem., 2013, 5, 577–581; (b) J. M. Zadrozny, D. J. Xiao, J. R. Long, M. Atanasov, F. Neese, F. Grandjean and G. J. Long, Inorg. Chem., 2013, 52, 13123–13131.
13 S. Mossin, B. L. Tran, D. Adhikari, M. Pink, F. W. Heinemann, J. Sutter, R. K. Szilagyi, K. Meyer and D. J. Mindiola, J. Am. Chem. Soc., 2012, 134, 13651–13661.
14 (a) J. M. Zadrozny and J. R. Long, J. Am. Chem. Soc., 2011, 133, 20732–20734; (b) J. M. Zadrozny, J. Telser and J. R. Long, Polyhedron, 2013, 64, 209–217.
15 D.-K. Cao, J.-Q. Feng, M. Ren, Y.-W. Gu, Y. Song and M. D. Ward, Chem. Commun., 2013, 49, 8863–8865. 16 M. S. Fataftah, J. M. Zadrozny, D. M. Rogers and D. E. Freedman, Inorg. Chem., 2014, 53, 10716–10721. 17 E. Carl, S. Demeshko, F. Meyer and D. Stalke, Chem. Eur. J., 2015, 21, 10109–10115.
18 (a) Y.-Y. Zhu, C. Cui, Y.-Q. Zhang, J.-H. Jia, X. Guo, C. Gao, K. Qian, S.-D. Jiang, B.-W. Wang, Z.-M. Wang and S. Gao, Chem. Sci., 2013, 4, 1802–1806; (b) Y.-Y. Zhu, Y.-Q. Zhang, T.-T. Yin, C. Gao, B.-W. Wang and S. Gao, Inorg. Chem., 2015, 54, 5475–5486.
19 V. V. Novikov, A. A. Pavlov, Y. V. Nelyubina, M.-E. Boulon, O. A. Varzatskii, Y. Z. Voloshin and R. E. P. Winpenny, J. Am. Chem. Soc., 2015, 137, 9792–9795.
20 Y. Rechkemmer, F. D. Breitgoff, M van der Meer, M. Atanasov, M. Hakl, M. Orlita, P. Neugebauer, F. Neese, B. Sarkar and J. van Slageren, Nat. Commun., 2016, 7, 10467.
21 X.-N. Yao, J.-Z. Du, Y.-Q. Zhang, X.-B. Leng, M.-W. Yang, S.-D. Jiang, Z.-X. Wang, Z.-W. Ouyang, L. Deng, B.-W. Wang and S. Gao, J. Am. Chem. Soc., 2017, 139, 373–380.
22 D. Tu, D. Shao, H. Yan and C. Lu, Chem. Commun., 2016, 52, 14326–14329.
23 A. A. Pavlov, Y. V. Nelyubina, S. V. Kats, L. V. Penkova, N. N. Efimov, A. O. Dmitrienko, A. V. Vologzhanina, A. S. Belov, Y. Z. Voloshin and V. V. Novikov, J. Phys. Chem. Lett., 2016, 7, 4111–4116. 24 S. Vaidya, S. Tewary, S. K. Singh, S. K. Langley, K. S. Murray, Y. Lan, W. Wernsdorfer, G. Rajaraman and M.
Shanmugam, Inorg. Chem., 2016, 55, 9564–9578.
25 P. E. Kazin, M. A. Zykin, W. Schnelle, Y. V. Zubavichus, K. A. Babeshkin, V. A. Tafeenko, C. Felser and M. Jansen, Inorg. Chem., 2017, 56, 1232–1240.
26 N. Bridonneau, L. Rigamonti, G. Poneti, D. Pinkowicz, A. Forni and A. Cornia, Dalton Trans., 2017, 46, 4075– 4085.
27 (a) M. A. Halcrow, Coord. Chem. Rev., 2009, 253, 2493–2514; (b) L. J. Kershaw Cook, R. Mohammed, G. Sherborne, T. D. Roberts, S. Alvarez and M. A. Halcrow, Coord. Chem. Rev., 2015, 289–290, 2–12.
28 M. A.Halcrow, Chem. Soc. Rev., 2011, 40, 4119–4142.
29 (a) Y. Hasegawa, K. Takahashi, S. Kume and H. Nishihara, Chem. Commun., 2011, 47, 6846–6848; (b) K. Takahashi, Y. Hasegawa, R. Sakamoto, M. Nishikawa, S. Kume, E. Nishibori and H. Nishihara, Inorg. Chem., 2012, 51, 5188−5198.
30 L. J. Kershaw Cook, F. L. Thorp-Greenwood, T. P. Comyn, O. Cespedes, G. Chastanet and M. A. Halcrow,
Inorg. Chem., 2015, 54, 6319–6330.
31 S. Gomez-Coca, A. Urtizbarea, E. Cremades, P. J. Alonso, A. Camón, E. Ruiz and F. Luis, Nat. Commun., 2014, 5, 4300.
24
32 In 2016, Song et al reported the appearance of an out-of-phase ac signal upon diamagnetic dilution of an easy axis octahedral cobalt(II) derivative, but no maxima were observed in T-dependent measurements and no Arrhenius plot was presented: J. Li, Y. Han, F. Cao, R.-M. Wei, Y.-Q. Zhang and Y. Song, Dalton Trans., 2016, 45, 9279–9284.
33 H. A. Jahn and E. Teller, Proc. Roy. Soc. London A, 1937, 161, 220–235.
34 E. A. Buvaylo, V. N. Kokozay, O. Yu. Vassilyeva, B. W. Skelton, A. Ozarowski, J. Titiš, B. Vranovičová and R. Boča, Inorg. Chem., 2017, 56, 6999−7009.
35 N. F. Chilton, R. P. Anderson, L. D. Turner, A. Soncini and K. S. Murray, J. Comput. Chem., 2013, 34, 1164– 1175.
36 L. Rigamonti, A. Cornia, A. Nava, M. Perfetti, M.-E. Boulon, A.-L. Barra, X. Zhong, K. Park and R.Sessoli,
Phys. Chem. Chem. Phys., 2014, 16, 17220–17230.
37 M. Perfetti, Coord. Chem. Rev., 2017, 348, 171–186.
38 S. Stoll and A. Schweiger, J. Magn. Reson., 2006, 178, 42–55.
39 J. R. Pilbrow, Transition Ion Electron Paramagnetic Resonance; Clarendon Press, Oxford, UK, 1990. 40 J. S. Griffith, The Theory of Transition Metal Ions; University Press: Cambridge, U.K, 1961.
41 F. Lloret, M. Julve, J. Cano, R. Ruiz-García and E.Pardo, Inorg. Chim. Acta, 2008, 361, 3432−3445.
42 A. V. Palii, D. V. Korchagin, E. A. Yureva, A. V. Akimov, E. Ya. Misochko, G. V. Shilov, A. D. Talantsev, R. B. Morgunov, S. M. Aldoshin and B. S. Tsukerblat, Inorg. Chem., 2016, 55, 9696–9706.
43 A. Abragam and M. H. L. Pryce, Proc. Roy. Soc. A (London), 1951, A206, 173–191.
44 (a) K. S. Cole and R. H. Cole, J. Chem. Phys., 1941, 9, 341–352; (b) C. Dekker, A. F. M. Arts, H. W. Wijn, A. J. van Duyneveldt and J. A. Mydosh, Phys Rev. B, 1989, 40, 11243–11251.
45 (a) C. Plenk, J. Krause and E. Rentschler, Eur. J. Inorg. Chem., 2015, 3, 370–374; (b) J. Palion-Gazda, T. Klemens, B. Machura, J. Vallejo, F. Lloret and M. Julve, Dalton Trans., 2015, 44, 2989–2992; (c) X. Liu, L. Sun, H. Zhou, P. Cen, X. Jin, G. Xie, S. Chen and Q. Hu, Inorg. Chem., 2015, 54, 8884−8886; (d) A. Świtlicka-Olszewska, J. Palion-Gazda, T. Klemens, B. Machura, J. Vallejo, J. Cano, F. Lloret and M. Julve, Dalton Trans., 2016, 45, 10181–10193; (e) J. P. S. Walsh, G. Bowling, A.-M. Ariciu, N. F. M. Jailani, N. F. Chilton, P. G. Waddell, D. Collison, F. Tuna, L. J. Higham, Magnetochem., 2016, 2, 23–32.
46 A. Lunghi, F. Totti, R. Sessoli and S. Sanvito, Nat. Commun., 2017, 8, 14620. 47 A. Lunghi, F. Totti, S. Sanvito and R. Sessoli, Chem. Sci., 2017, 8, 6051–6059.
48 A. Abragam and B. Bleaney, Electron Paramagnetic Resonance of Transition Ions, Dover Publications, Inc., 1986.
49 (a) R. Ruamps, L. J. Batchelor, R. Guillot, G. Zakhia, A.-L. Barra, W. Wernsdorfer, N. Guihery and T. Mallah,
Chem. Sci., 2014, 5, 3418–3426; (b) S. Sottini, G. Poneti, S. Ciattini, N. Levesanos, E. Ferentinos, J. Krzystek,
L. Sorace and P. Kyritsis, Inorg. Chem., 2016, 55, 9537−9548; (c) M. A. Palacios, J. Nehrkorn, E. A. Suturina, E. Ruiz, S. Gomez-Coca, K. Holldack, A. Schnegg, J. Krzystek, J. M. Moreno and E. Colacio, Chem. Eur. J., 2017, 23, 11649–11661.
50 Y.-Z. Zhang, S. Gómez-Coca, A. J. Brown, M. R. Saber, X. Zhang, K. R. Dunbar, Chem. Sci., 2016, 7, 6519– 6527.
25
52 (a) G. Karlström, R. Lindh, P.-Å. Malmqvist, B. O. Roos, U. Ryde, V. Veryazov, P.-O. Widmark, M. Cossi, B. Schimmelpfennig, P. Neogrady and L. Seijo, Comput. Mater. Sci., 2003, 28, 222–239; (b) V. Veryazov, P.-O. Widmark, L. Serrano-Andrés, R. Lindh and B. O. Roos, Int. J. Quantum Chem., 2004, 100, 626–635; (c) F. Aquilante, L. De Vico, N. Ferré, G. Ghigo, P.- Å. Malmqvist, P. Neogrády, T. B. Pedersen, M. Pitoňák, M. Reiher, B. O. Roos, L. Serrano-Andrés, M. Urban, V. Veryazov and R. Lindh, J. Comput. Chem., 2010, 31, 224– 247.
53 S. Gómez-Coca, E. Cremades, N. Aliaga-Alcalde and E. Ruiz, J. Am. Chem. Soc., 2013, 135, 7010–7018. 54 M. Atanasov, D. Ganyushin, K. Sivalingam and F. Neese, In Struct. Bond. 2012, 149–220, D. M. P. Mingos, P.
Day and J. Peder, (Eds.), Springer: Berlin.
55 (a) L. F. Chibotaru, L. Ungur, C. Aronica, H. Elmoll, G. Pillet and D. Luneau, J. Am. Chem. Soc., 2008, 130, 12445–12455; (b) L. F. Chibotaru, L. Ungur and A. Soncini, Angew. Chem. Int. Ed., 2008, 47, 4126–4129. 56 W. H. Harman, T. D. Harris, D. E. Freedman, H. Fong, A. Chang, J. D. Rinehart, A. Ozarowski, M. T. Sougrati,
26
Table of Contents
The cobalt(II) compound [Co(bpp-COOMe)2](ClO4)2 shows dominant easy axis anisotropy and slow magnetic relaxation in zero static field once magnetically diluted.