Alma Mater Studiorum - Università di Bologna
SCUOLA DI SCIENZE
Dipartimento di Chimica Industriale “Toso Montanari”
Corso di Laurea Magistrale in
Chimica Industriale
Classe LM-71 - Scienze e Tecnologie della Chimica Industriale
Designing heterogenous catalysts for
naphthalene isopropylation
Tesi di laurea sperimentale
CANDIDATO
Federico Gubellini
RELATORE
Chiar.mo Prof. Fabrizio Cavani
CORRELATORE
Prof. N. Raveendran Shiju Dott. Sang-Ho Chung
_________________________________________________________________________________________________________________ Anno Accademico 2018-2019
Abstract
2,6 di-isopropylnaphthalene is a plant growth regulator and it is used for the
manufacturing of products intended to prevent sprouting of stored potatoes; despite that in the last decades it has been mainly produced as a precursor of the
corresponding dicarboxylic acid (2,6-naphthalene dicarboxylic acid) which is, with ethylene glycol, the monomer for polyethylene naphthalate (PEN) polymerization. PEN results appealing for many uses for which PET is more commonly utilized; the most relevant, higher glass transition temperature (PEN 122°C, PET 80°C), higher young’s modulus (PEN 5200 MPa, PET 3900 MPa), lower oxygen permeability (PEN 20 cm3/[m2*day*atm], PET 56 cm3/[m2*day*atm]) and lower thermal shrinkage (PEN 0,6%, PET 1,3%).
This thesis reports of the study of the alkylation reaction of naphthalene with propylene, to get 2,6 di-isopropylnaphthalene.
Operative conditions such as temperature and feed composition were optimized. The effect of parameters, such as catalyst size and inlet flow rate, on catalytic
performance were studied. Part of the work was aimed at checking the presence of internal and external diffusion limitations.
Several commercial catalysts have been tried on the bench-scale plant, both zeolites and amorphous silica-alumina materials.
Desilicated zeolites were synthesized and tested as well, resulting in interesting catalysts for such reaction, with the need of further optimization of the synthesis procedure.
ASA materials, as main catalysts of this project, were synthesized by means of wet impregnation and tested on the bench-scale plant. From the results is possible to hypothesize the presence of species like PBS-Al and PBS-Si within the ASA framework, that provide the catalyst with Brønsted acid sites with a zeolite-alike strength. The synthesized ASA catalysts show promising results, with high activity, but selectivity needs to be improved. Catalysts were characterized by means of XRD, n-butylamine titration and TGA (on used samples).
Abstract
2,6 di-isopropilnaftalene è utilizzato come regolatore di crescita delle piante e nella produzione di chemicals per prevenire la germinazione delle patate; nonostante questo nell'ultimo decennio è stato prodotto principalmente come precursore del corrispondente acido dicarbossilico (acido 2,6-naftalen dicarbossilico) che è, con il glicole etilenico, il monomero per la polimerizzazione del polietilenaftalato (PEN). Il PEN risulta un ottimo sostituto in molti usi per i quali il PET è più comunemente utilizzato; presenta numerosi vantaggi, i più rilevanti, temperatura di transizione vetrosa più elevata (PEN 122 ° C, PET 80 ° C), modulo di Young più elevato (PEN 5200 MPa, PET 3900 MPa), minore permeabilità all'ossigeno (PEN 20 cm3 / [m2 * giorno * atm], PET 56 cm3 / [m2 * giorno * atm]) e minore contrazione termica (PEN 0,6%, PET 1,3%).
La ricerca svolta riguarda la reazione di alchilazione del naftalene con propilene, per ottenere 2,6 di-isopropilnaftalene.
Sono state ottimizzate le condizioni operative come temperatura e composizione dell'alimentazione. Sono stati studiati gli effetti di parametri, quali le dimensioni del catalizzatore e la portata in ingresso. Parte del lavoro è stato volto a verificare la presenza di limiti di diffusione intraparticellare e interparticellare.
Diversi catalizzatori commerciali sono stati provati sull'impianto bench-scale a disposizione, sia zeoliti che materiali ASA.
Sono stati sintetizzati e testati campioni di zeoliti commerciali sottoposti a trattamento di desilicazione, risultando catalizzatori interessanti per la reazione in esame, con la necessità di un'ulteriore ottimizzazione della procedura di sintesi.
I materiali ASA, come principali catalizzatori di questo progetto, sono stati sintetizzati mediante impregnazione e testati. Dai risultati è possibile ipotizzare la presenza di specie come PBS-Al e PBS-Si all'interno della struttura degli ASA, che assicurano al catalizzatore la presenza di siti acidi di Brønsted con forza simile a quelli trovati nelle zeoliti. I catalizzatori ASA sintetizzati mostrano risultati promettenti, con alta attività, ma selettività che necessita di essere migliorata. I catalizzatori sono stati
caratterizzati mediante XRD, titolazione potenziometrica con n-butilammina e TGA (su campioni usati).
Summary
Summary
1 Introduction ... 3
1.1 Uses and market of 2,6 di-isopropylnaphthalene ... 3
1.2 Polyethylene naphthalate (PEN)... 3
1.3 Current technology ... 4
1.4 Naphthalene isopropylation ... 5
1.5 Alkylation catalysts ... 8
1.5.1 ASA acidic properties ... 8
1.6 Aim of the thesis ... 10
2 Experimental ... 11
2.1 Materials ... 11
2.2 Commercial catalysts ... 11
2.3 Zeolitic Catalysts ... 12
2.4 Synthesis of amorphous silica–alumina catalysts ... 13
2.5 Desilication of ZSM−5 ... 14
2.6 Catalysts characterization ... 15
2.6.1 XRD ... 15
2.6.2 n−Butylamine titration ... 16
2.6.3 Thermogravimetric analysis (TGA) ... 16
2.7 Catalytic test ... 17
2.7.1 GC analytical system ... 19
2.7.2 Data elaboration ... 20
3 Results and Discussion ... 21
3.1 Amorphous Silica-Alumina catalysts characterization... 21
3.2 Desilicated zeolitic catalysts ... 29
Summary
3.4 Reactivity experiments ... 42
3.5 Internal diffusion limitation ... 49
3.6 External diffusion limitation ... 52
3.7 Amorphous silica-alumina catalysts reactivity ... 54
3.8 Desilicated zeolitic catalysts reactivity ... 62
3.9 Zeolitic catalysts reactivity ... 66
3.10 TGA characterization of used catalyst ... 69
4 Conclusion ... 73
5 Acknowledgments ... 74
Introduction
1 Introduction
Climate change, pollution and overexploitation of natural resources are current, no more negligible, problems affecting human being wellness, as well as flora and fauna and the future sustainability of Earth resources.
Green chemistry and its guidelines are no more optional, but the standard on which should be built the chemistry industry as well as a new way of thinking about
chemistry itself.
The isopropylation of naphthalene to achieve a selective production of 2,6 di-isopropylnaphthalene has not been an exception, leaning towards a more sustainable heterogenous catalysis reaction, and expecting the demand of this chemical to rise in the next years.
1.1 Uses and market of 2,6 di-isopropylnaphthalene
The desired product of the isopropylation of naphthalene, is 2,6
di-isopropylnaphthalene (2,6-DIPN). 2,6-DIPN is a plant growth regulator and it is used for the manufacturing of products intended to prevent sprouting of stored potatoes; despite that, in the last decades it has been mainly produced as a precursor of the corresponding dicarboxylic acid (2,6-naphthalene dicarboxylic acid) which is, with ethylene glycol, the monomer for polyethylene naphthalate (PEN) polymerization.
1.2 Polyethylene naphthalate (PEN)
Polyethylene naphthalate is a polyester derived from 2,6-naphthalene dicarboxylic acid) and ethylene glycol. Two major manufacturing routes exist for PEN (Figure 1), basically they differ from the starting material being an ester or an acid and the processes are named according to whether the starting monomer is a diester or a diacid derivative. Solid-state polymerization (SSP) of the melt-produced resin pellets is the preferred process to increase the average molecular weight of PEN.
PEN resulted really appealing when it broke out to the polymers world, in fact, compared to the most used PET, it presents several advantages when used as a
Introduction
container; the most relevant, higher glass transition temperature (PEN 122°C, PET 80°C), higher young’s modulus (PEN 5200 MPa, PET 3900 MPa), lower oxygen permeability (PEN 20 cm3/[m2*day*atm], PET 56 cm3/[m2*day*atm]) and lower thermal shrinkage (PEN 0,6%, PET 1,3%).
Teijin introduced semi-commercial quantities of an improved polyester, PEN, into the market place in the early 1970s. Introduced as an extruded film tradenamed “Q-polymer”, it featured higher modulus, outstanding heat resistance and improved dimensional stability. It also had mechanical, chemical and electrical properties superior to PET film. This material quickly found use in audio and video tape
applications in place of the conventional PET film. Several companies expressed an interest in PEN applications. The 3M company was interested in using PEN film for magnetic recording tape for computers and Goodyear was interested in using PEN fiber for belts in radial tires.
Market estimates showed the demand for PEN growing to 4-7 million Kg per year by 1980[1].
1.3 Current technology
Rutgers is one of the current producers of 2,6 di-isopropylnaphthalene; their technology consists of a plant where the alkylation reaction is coupled with
transalkylation and distillation. The process an exploits amorphous silica-alumina catalyst to carry out the isopropylation reaction.
The figure below shows the plant scheme (Figure 2).
Introduction
Figure 2. Rutgers industrial plant scheme for naphthalene isopropylation
In the central portion of the scheme is highlighted the isopropylation section, carried out in four reactors and followed by three distillation columns where the different boiling points fractions are separated, namely, the lightest composed by unreacted naphthalene and mono-isopropylnaphthalene, the intermediate with
di-isopropylnaphthalene and the heaviest containing tri- and tetra-di-isopropylnaphthalene. In the left end side of the scheme the transalkylation section allows to recycle the heaviest fraction into the main stream of the plant; while the lightest is recycled just before the isopropylation reactors. The amorphous silica-alumina heterogenous catalyst used on the plant, even without reaching high selectivity towards the desired product, is backed up by the plant design, with the transalkylation and distillation sections allowing a low production of waste and side products that need treatments.
1.4 Naphthalene isopropylation
Using an acid heterogenous catalyst, the alkylation reaction of naphthalene with propylene goes through the formation of a carbocation, which attacking the
tetra-Introduction
alkylated naphthalene isomers. The following figure summarizes the reaction scheme.
The complete reaction scheme appears to be more complicated than the one
showed above, in fact, when the reactant molecules diffuse through the pores of the catalyst, there is a preferential adsorption of propylene over naphthalene on the acid sites of the catalysts thereby resulting in the formation of primary carbocation. As primary carbocation is relatively unstable, it isomerizes on strong acid sites to give a stable secondary carbocation. The carbocation can now attack naphthalene on the so-called -positions (1,4,5 and 8 on the naphthalene double ring) or on the -positions (2,3,6 and 7 on the naphthalene double ring) leading respectively to the kinetic or the thermodynamic product, as shown by the figure below.
Introduction
The formation of -isopropyl naphthalene is a result of the attack of stable secondary carbocation at the -position of the ring, where as the formation of -n-propyl naphthalene is due to the attack of the primary carbocation on the -position of the ring[2][3].
A more complete reaction scheme is shown in the figure below, where are highlighted all the pathways that bring to the formation of and mono-isopropylnaphthalene and of , and di-isopropylnaphthalene isomers[4].
Introduction
1.5 Alkylation catalysts
Materials which can be used as catalyst to promote such an alkylation reaction needs acidic properties; acid sites necessary to generate the propyl-carbocation which will then interact with naphthalene. Acidity could be very elusive, in fact, important roles in determining the reaction outcome and products formation, are played by the
number of acid sites and by their strength. Moreover, surface area and pores volume are two aspects that gain significance when dealing about heterogenous catalysts. The choice of the material for a catalyst is at a crossroads, zeolites or amorphous aluminosilicates.
On the one hand, there are as many as 10 possible DIPN including , and isomers; because of the difficulty of completely separating these isomers, especially -isomers, the selective production of 2,6-DIPN with a high 2,6/2,7-DIPN ratio by alkylation of naphthalene is highly desired. However, selective synthesis of 2,6-DIPN is difficult by alkylation of naphthalene with conventional Friedel–Crafts catalysts or over silica-alumina catalyst. Therefore, the use of shape-selective properties of zeolites in the alkylation of naphthalene should be helpful in the synthesis of 2,6-DIPN, although the average molecular dimensions of the -isomers are very similar[5].
On the other hand, due to their combined Lewis and Brønsted acidities, amorphous silica-alumina (ASA) are widespread supports for multi-functional heterogeneous catalysts in many processes from the laboratory scale to the industrial plant. Due to their amorphous nature the local environment of the acid sites remains strongly debated. Zeolite-like bridging Si-(OH)-Al groups are sometimes invoked. Silanols bonded to low-coordinated aluminum atoms by a Si-O-Al bridge have been proposed as most acidic Brønsted sites on ASA surfaces, depending on the number and
coordination of aluminum atoms[6].
1.5.1 ASA acidic properties
Based on propane cracking experiments, Xu et al.[7] have concluded that amorphous silica-alumina materials contain a small number of Brønsted acid sites that have
Introduction
Brønsted acid sites does not depend on the crystallinity of the structure. A small percentage of the aluminum atoms form zeolite-like hydroxyl groups that dominate the activity of ASA in a demanding reaction such as the monomolecular cracking of alkanes.
F. Leydier et al.[8] investigated adsorption and protonation of lutidine over an ASA surface model and were able to provide a summary with all the surface sites leading to proton transfer. A very general molecular rule summarizing the Brønsted acidity of silanols on ASAs was drafted: direct or indirect interaction of silanols with aluminum or silicon atoms may be beneficial for the exaltation of its acidity, but the most important factor determining deprotonation is the stabilization of the silanolate species obtained after proton transfer. The silanolate is stabilized on bridging OH-groups (as already known from zeolites), but also on PBS–Al and PBS–Si (PBS stands for pseudo bridged silanol) thanks to the formation of additional O–M bonds. The presence of aluminum atoms in the silica network is thus a clear reason of enhanced Brønsted acidity of silanols as compared to silica.
The second source of Brønsted acidity on ASA comes from water molecules adsorbed on aluminum atoms. Provided they are not involved in strong hydrogen bonding with neighboring OH-groups, protons belonging to these water molecules can be transferred to basic molecules. If a strong hydrogen bond exists between the proton of such a water molecule and a neighboring silanol, Brønsted acidity arises from the silanol itself. The following figure summarizes the different type of Brønsted acid sites in ASA highlighted by the model.
Introduction
1.6 Aim of the thesis
During my internship at the University of Amsterdam UvA in the heterogenous
catalysis research group, my efforts were all directed onto one project, that dealt with the alkylation reaction of naphthalene with propylene, to get 2,6
di-isopropylnaphthalene.
My work has been focused initially to the optimization of the bench-scale plant, with a scale-down process from the industrial plant currently producing the desired product. The effort was then directed onto finding the right conditions for the reaction,
meaning adjusting feed flow, temperature, catalyst particle size as well as verifying that no diffusion limitations were affecting the reaction in the conditions chosen. The focus then moved to testing a series of commercial catalysts, both ASA and zeolite samples, making sure to obtain results in line with those coming from the industrial plant. Eventually, the last chapter of the project was about the synthesis of new catalysts for the alkylation reaction; two pathways were followed at this point, one being the desilication of commercial zeolite samples, and the second, more time consuming, the synthesis of amorphous silica-alumina catalyst.
Experimental part
2 Experimental part
2.1 Materials
Sodium water glass (SiO2 26,5%, Sigma Aldrich), sodium aluminate (Al2O3 53%,
Sigma Aldrich), HNO3 (70%, Sigma Aldrich), NH4NO3 (98%, Sigma Aldrich), NaOH
(98%, Sigma Aldrich), n-butylamine (99,5%, Sigma Aldrich), acetonitrile (99,8%, Sigma Aldrich), naphthalene (99%, Sigma Aldrich), decalin (mixture cis + trans, 99%, Sigma Aldrich), ethanol (99,5%, Sigma Aldrich), acetone (99,5%, Sigma Aldrich), toluene (99,8%, Sigma Aldrich),1-methyl naphthalene (99,5%, Sigma Aldrich).
Mordenite catalysts in the protonic form such as H–MOR (SAR = 15, TOSOH), H– MOR (SAR = 25, ZEOCAT) and H–MOR (SAR = 40, SUD CHEMIE) were supplied by University of Bologna (F. Cavani group). Three different NH4–ZSM-5 (SAR = 50, 80
and 100) were purchased from Zeolyst. H–Y (SAR = 5,1) and H– were purchased from Zeolyst. The chemicals were used without further purification.
2.2 Commercial catalysts
A commercial catalyst (NIKKI) for naphthalene alkylation was kindly supplied by Rutgers and tested as a reference material in this study. Additionally, several catalysts were also provided with two different pellet size from a Chinese catalyst producer (details of the company were not disclosed). According to Rutgers, the catalysts were prepared with same synthesis procedure but in different batches. The samples were named followed by synthesis batch number (1, 2, 3 or 4) and size of the pellet (small or large), such as Cat1s, Cat1L, Cat2s, Cat2L, Cat3s, Cat3L and Cat4L. The following table summarizes the catalysts provided by Rutgers (Table 1).
Table 1. Samples provided from Rutgers. The pellet size of the samples was measured by image J software with a scale bar of 10 mm.
Sample code Pellets size
Experimental part NIKKI 3,0 x 3,0 – Cat1s 0,8–1,0 x 3,0–4,0 1st Cat1L 3,0 x 5,0–6,0 1st Cat2s 0,8–1,0 x 3,0–4,0 2nd Cat2L 3,0 x 5,0–6,0 2nd Cat3s 0,8–1,0 x 3,0–4,0 3rd Cat3L 3,0 x 5,0–6,0 3rd Cat4L 3,0 x 5,0–6,0 4th
2.3 Zeolitic Catalysts
Various zeolitic catalysts have been tried during the project as an opposite route to the use of amorphous silica-alumina catalysts.
The zeolites tested were all commercial samples but one, H-Beta; some of them were supplied by Zeolyst, and some, supplied by the catalysis research group of the University of Bologna.
The following table (Table 2) summarizes all the zeolitic samples tested.
Table 2. Sample code; H- stands for the hydrogen form of the zeolite; *Si/Al ratio for the H-ß sample was unknown.
Sample code Supplier Zeolite code Si/Al ratio H-ZSM-5 (50) ZEOLYST MFI 50 H-ZSM-5 (80) ZEOLYST MFI 80 H-ZSM-5 (100) ZEOLYST MFI 100 H-Mordenite (15) TOSOH MOR 15 H-Mordenite (25) ZEOCAT MOR 25 H-Mordenite (40) SUD CHEMIE MOR 40 H-Beta (mesoporous) ZEOLYST BEA *
Experimental part
H-Y ZEOLYST FAU 5,1
2.4 Synthesis of amorphous silica–alumina catalysts
Amorphous silica-alumina catalysts have been synthesized using coprecipitation[9]. Two aqueous solutions of sodium water glass (26,5% SiO2) and sodium aluminate
were separately prepared in total volume of 100 mL, as precursors for silica and alumina, respectively. The solutions were mixed and dispersed using a drill mixer, aged for gelation (1–10 min). 50 mL of DI water were added to the gel in a beaker and the pH of the mixture was adjusted between 9.7 and 9.9, adding 0,5 M HNO3 solution
drop–wisely with vigorous stirring by a drill mixer. The precipitants were filtered and ion–exchanged with 0,5 M NH4NO3 three times (8 h for each exchange), using a tube
roller mixer. The resulting solids were washed with DI water on the tube roller mixer for 2 h. After filtration, the particles were dried at 120 °C overnight and calcined at 550 °C for 5 h with a heating ramp of 2,5 °C/min.
Four batches were carried out, and two different kinds of mixing phases were adopted. The first type of mixing phase expects the mixing of the two precursors first, while adding water in a second time; the mixing gets barely possible before adding the water due to the thickness of the gel formed. Stirring was kept on continuously for about one hour before proceeding with the synthesis.
The second type of mixing phase implies the addition of the two precursors and water together from the really first moment before to start stirring; the mixing seems easier with this procedure. In order to obtain a homogenous mix, the stirring was carried out for about 24 h.
As the mixing phase of two precursor solutions and the final pH of the mixture are known to be important factors for the physicochemical properties of the resulting amorphous silica–alumina catalysts, four different catalysts were synthesized varying the synthesis conditions (Table 3).
Table 3. Synthesized amorphous silica–alumina catalysts at UvA. ASA stands for amorphous silica-alumina and UvA for University of Amsterdam, respectively.
Experimental part (°C) ASA_UvA1 mp 1 8,7–8,8 550 ASA_UvA2 mp 2 9,7–9,8 550 ASA_UvA3 mp 1 8,7–8,8 550 ASA_UvA4 mp 2 8,7–8,8 550
2.5 Desilication of ZSM−5
Among the zeolitic catalysts, only ZSM−5 samples have been chosen to undergo the desilication treatment described below[10].
Commercial ZSM−5 (Zeolyst, Si/Al=50, NH4 form) was converted into its acidic form
by calcination at 550 °C for 5 h in a static oven. The resulting H−ZSM−5 sample was immersed in aqueous NaOH solutions of different concentrations (0,1, 0,3, 0,5 and 0,7 M, 30 mL per gram of zeolite). The mixtures were heated to 65 °C and stirred for 30 min. The suspensions were quenched in an ice−bath. The resulting solids were filtered, washed thoroughly with DI water and dried overnight at 65 °C. The
desilicated samples were converted into the ammonium form by ion−exchange in 0,1 M aqueous NH4NO3 solution (100 mL per gram of zeolite) at room temperature for 12
h. After three consecutive treatments, the final protonic form of desilicated zeolites was obtained followed by a calcination at 550 °C for 5 h in static air. Using ZSM-5 (nominal Si/Al=50, by Zeolyst) ammonium form as a starting material, four different samples has been synthesized following the desilication procedure described above. The main variation in the synthesis of the samples is the use of an aqueous solution of NaOH at different concentration.
The following table summarizes the distinct samples obtained and the reactants used during the synthesis (Table 4 ).
Table 4. Sample code; DS stands for desilicated. Starting zeolite; SAR stands for silica alumina ratio.
Sample code T of calcination (°C) NaOH solution molarity (mol/l)
Experimental part DS_ZSM-5_0,1 550 0,1 DS_ZSM-5_0,3 550 0,3 DS_ZSM-5_0,5 550 0,5 DS_ZSM-5_0,7 550 0,7
2.6 Catalysts characterization
2.6.1 XRDXRD powder patterns of the catalysts were recorded with Ni-filtered Cu K𝛂 radiation (𝛌= 1,54 Å) on a Rigaku Miniflex II. X-ray diffractometer was equipped with a secondary curved graphite-crystal monochromator. The samples were analyzed in the 2θ range of 5° to 80° with a scan rate of 0,05°/s. The crystalline phases of the samples were identified using a software PDXL (Rigaku) with Crystallography Open Database (COD).
The scheme of the XRD instrument is shown in Figure 8.
Figure 8. Scheme of X-ray diffraction spectroscopy
Sam ple X-ray tube Aperture diaphragm Focusing circle Scattered-radiation diaphragm K𝝱 filter 2𝛝 Measuring circle Detector diaphragm Detector 𝛝
Experimental part
2.6.2 n−Butylamine titration
The acidity and the number of acidic sites of the catalysts were measured by a potentiometric titration method. A suspension of the powder catalyst in acetonitrile was titrated with 0,05 N n−butylamine/acetonitrile solution at a flow rate of 0,05 mL/min[11,12]. The variation of electric potential during the titration was measured with a digital pH-meter (Eutech Instruments, PC2700) equipped with a standard calomel electrode.
The analysis instruments scheme is shown in Figure 9.
Figure 9. Apparatuses layout used for n-butylamine titrations
2.6.3 Thermogravimetric analysis (TGA)
TGA of the used catalysts was carried out with a Netzsch STA 449 F3 Jupiter. After few preliminary analyses, the analysis condition was carefully selected between 30 and 750 °C with the ramping rate of 5 °C /min. During the analysis, 40 mL/min of gas flow was maintained at with the air/argon ratio of 1:1. The sample weight was around 25mg for every analysis.
Experimental part
Figure 10. side view scheme of thermogravimetric analysis
2.7 Catalytic test
Few preliminary catalytic tests were carried out using pellet type catalysts as received from Rutgers. The catalytic tests were then carried out with sieved samples with the particle size between 250 and 425 µm. Pellet size catalysts were crushed into powder and then pressed and ground to the desired dimensions; while the synthesized catalysts were obtained mainly in the form of powder, any bigger particle was crushed into powder before undergoing pressing and grinding processes.
Some catalytic tests were carried out with catalyst particle sizes of 125/250µm and 425/530µm in order to check the presence of limitations given by the reaction conditions used.
Catalytic tests were performed in a bench-scale apparatus. The glass reactor [A] has a catalytic zone with a diameter of 25mm and a porous quartz septum to hold the catalyst bed. Catalyst pellets are placed between two layers of about 1,00cm each of quartz wool in order to keep the catalyst bed stable throughout the whole reaction. The upper part of the glass reactor, above the catalyst bed, is filled with SiC inert spheres (diameter 0,8mm) to achieve a uniform heat diffusion and to avoid the channeling-problem of the liquid reactant fed from the top of the reactor. A stainless-steel thermocouple was inserted between the glass reactor and the furnace, reaching the proper height to measure the temperature of the catalyst bed. The vertical tubular
Experimental part
furnace (Carbolite MTF 12/25/250) and its controller provide the heat necessary to the reaction. Gas flows (reactants or inert) are controlled by means of Brooks gas flow meters. Liquid reactants are fed with a Teledyn Isco 100DX syringe pump coupled with its controller. A condenser was fitted at the end of the reactor; liquid samples collected periodically were then injected for GC analyses. The gas flow was sent directly to the vent system. The schemes of the apparatus are shown in Figure 11 and Figure 12.
Experimental part
Figure 12. Apparatuses layout for reactivity tests.
2.7.1 GC analytical system
Conversion of reactants and products yields were evaluated by means of gas chromatography. Only the liquid phases collected at the end of the condenser were analyzed. The GC-analyses were performed with an Agilent Technologies 7820A equipped with a CP-Wax 52 CB column and an FID detector; helium was used as a carrier gas. Each liquid sample collected was firstly diluted with toluene, then added
Liquid Naphthalene/Decalin Propylene glass reactor silica carbide quartz wool catalyst pellets quartz wool furnace condenser Liquid to GC analysis Vent Gas MFC syringe pum p
Experimental part
with a precise quantity of the internal standard, namely 1-methyl naphthalene, and finally the solution was analyzed.
2.7.2 Data elaboration
Conversion of reactants, yield and selectivity to products were determined with the following equations:
Conversion =n° mols of converted reactant
n° mols of fed reactant × 100
Yield = n° mols of product stoichiometric coeff.⁄
n° mols of fed reactant stoichiometric coeff.⁄ × 100
Selectivity = Yield
Conversion× 100
C balance = Yields
Results and discussion
3 Results and Discussion
This chapter deals with the characterization of catalysts and catalytic experiments for naphthalene isopropylation.
3.1 Amorphous Silica-Alumina catalysts characterization
Figure 13 shows that a main difference in the XDR patterns between NIKKI catalyst and the series of commercial amorphous silica-alumina catalysts supplied by Rutgers is the stronger presence of some reflections in the latter (highlighted with ); in fact, at 37°, 46° and 67° 2 angle can be observed what is thought to be -Al2O3[13],
which can be used as a binder to enhance mechanical properties of the pellets.
Figure 14 compares different samples from the series of the chinese commercial amorphous silica-alumina catalysts. Significant differences in the XRD patterns
0
3500
5 15 25 35 45 55 65 75 In te n si ty ( a .u .) 2-theta (deg) Cat1s NIKKIFigure 13. XRD patterns of commercial amorphous silica-alumina catalysts (indexed with are reflections of crystalline -Al2O3).
Results and discussion
cannot be found; apart from the crystallinity given by -Al2O3, recognized in the
above-mentioned reflections, the samples are mainly amorphous as expected.
Figure 15 compares the potentiometric titration of NIKKI catalyst and samples from the commercial catalysts’ series, highlighting remarkable differences. Cat1s and Cat4L behavior doesn’t differ significantly from one another, but they both show fewer strong acid sites and a lower amount of acid sites in general than NIKKI catalyst.
-500
7000
5 15 25 35 45 55 65 75 In te n si ty ( a .u .) 2-theta (deg) Cat1s Cat2L Cat3s Cat4LFigure 14. XRD patterns of the series of commercial amorphous silica-alumina catalysts (indexed with are reflections of crystalline -Al2O3).
Results and discussion
Figure 15. Potentiometric titration with n-butylamine graph of commercial amorphous silica-alumina catalysts.
Figure 16 and Figure 17 compare NIKKI catalyst with the lab-synthesized ASA_UvA1 and ASA_UvA2; the XRD patterns confirm the amorphous nature of the latter
samples and the almost complete absence of crystalline -Al2O3 in their lattice. The
potentiometric titration graph reveals bigger diversity, in fact, while they both show a higher Ei than NIKKI, ASA_UvA1 and ASA_UvA2 end up having a lower amount of
total acid sites; and only ASA_UvA1 reaches the same amount of strong acid sites as NIKKI. -200 -100 0 100 200 300 0 0.3 0.6 0.9 1.2 E le ctr o d e p o te n ti a l (m V )
Total amount of n-buytlamine (mmol/g)
NIKKI Cat1s
Results and discussion
Figure 16. XRD patterns of commercial and lab-synthesized amorphous silica-alumina catalysts.
Figure 17. Potentiometric titration with n-butylamine graph of commercial and lab-synthesized amorphous silica-alumina catalysts.
-200 -100 0 100 200 300 0 0.3 0.6 0.9 1.2 E le ct ro d e p o te n ti a l (m V )
Total amount of n-buytlamine (mmol/g)
5 15 25 35 45 55 65 75 In te n si ty ( a .u .) 2-theta (deg) NIKKI ASA_UvA1 ASA_UvA2 NIKKI ASA_UvA1 ASA_UvA2
Results and discussion
Figure 18 and Figure 19 make the same comparison of the samples synthesized during the project, but with Cat1s; the XRD patterns make even easier to spot the less abundance of -Al2O3. The titration with n-butylamine shows different features,
with ASA_UvA1 and Cat1s having the same overall amount of acid sites and same amount of strong acid sites; on the other hand, ASA_UvA2 shows lower values in both the categories.
Figure 18. XRD patterns of commercial and lab-synthesized amorphous silica-alumina catalysts (indexed with are reflections of crystalline -Al2O3).
0
4800
5 15 25 35 45 55 65 75 In te n si ty ( a .u .) 2-theta (deg) ASA_UvA2 ASA_UvA1 Cat1sResults and discussion
Figure 19. Potentiometric titration with n-butylamine graph of commercial and lab-synthesized amorphous silica-alumina catalysts.
Figure 20 and Figure 21 compares catalysts ASA_UvA1 and ASA_UvA3, samples synthesized with the same procedure. Even though the XRD patterns don’t show major differences, the n-butylamine titration shows that ASA_UvA3 has fewer strong acid sites as well as a lower amount of acid sites in general.
Figure 20. XRD patterns of lab-synthesized amorphous silica-alumina catalysts.
0
3500
5 15 25 35 45 55 65 75 In te n si ty ( a .u .) 2-theta (deg) -200 -100 0 100 200 300 0 0.3 0.6 0.9 1.2 E le ct ro d e p o te n ti a l (m V )Total amount of n-buytlamine (mmol/g) Cat1s
ASA_UvA1 ASA_UvA2
ASA_UvA1
Results and discussion
Figure 21. Potentiometric titration with n-butylamine graph of lab-synthesized amorphous silica-alumina catalysts.
Figure 22 and Figure 23 show a comparison between ASA_UvA2 and ASA_UvA4; the samples have been obtained with the same procedure and same mixing step, but different final pH, in fact, ASA_UvA4 in the last step of the synthesis was brought to a more acidic pH. The XRD patterns don’t highlight significant diversity, while the
potentiometric titration graph shows minor differences, resulting in ASA_UvA4 having a higher amount of strong acid sites as well as a higher total amount of acid sites. Table 5 summarizes all the data from the potentiometric titrations of amorphous silica-alumina catalysts tested during the project.
-200 -100 0 100 200 300 0 0.3 0.6 0.9 1.2 E le ct ro d e p o te n ti a l (m V )
Total amount of n-buytlamine (mmol/g) ASA_UvA1 ASA_UvA3
Results and discussion
Figure 22. XRD patterns of lab-synthesized amorphous silica-alumina catalysts.
0
3500
5 15 25 35 45 55 65 75 In te n si ty ( a .u .) 2-theta (deg) -200 -100 0 100 200 300 0 0.3 0.6 0.9 1.2 E le ct ro d e p o te n ti a l (m V )Total amount of n-buytlamine (mmol/g) ASA_UvA2
ASA_UvA4
Figure 23. Potentiometric titration with n-butylamine graph of lab-synthesized amorphous silica-alumina catalysts.
ASA_UvA2
Results and discussion
Table 5. Electrode, calomel; Ei stands for initial electrode potential in mV.
Sample
code Ei (mV)
Strong acid sites (E>100)
Medium acid sites (0<E<100)
Weak acid sites (-100<E<0) Total (mmol/g) NIKKI 224 0,11 0,10 0,41 0,62 Cat1s 114 0,12 0,09 0,17 0,38 Cat4L 164 0,07 0,003 0,147 0,22 ASA_UvA1 324 0,1 0,05 0,27 0,42 ASA_UvA2 302 0,03 0,008 0,072 0,11 ASA_UvA3 220 0,07 0,02 0,13 0,22 ASA_UvA4 243 0,07 0,02 0,07 0,17
3.2 Desilicated zeolitic catalysts
Figure 24 shows a comparison between the XRD patterns of commercial H-ZSM-5 (SAR=50) and the desilicated sample DS_ZSM-5_0,1; It is apparent that the intrinsic lattice structure of ZSM-5 zeolite was preserved and no new phase was created after alkali-treatment. However, the relative crystallinity of the DS_ZSM-5_0,1 zeolite decreased noticeably.
Figure 25 shows a zoomed in H-ZSM-5 (SAR=50) XRD pattern; the indexed XRD peaks correspond to those of the reference standard for a highly pure calcined H-ZSM-5 and were used to identify the H-H-ZSM-5 zeolites and compare the commercial catalyst with the desilicated samples.
Results and discussion
-1500
12000
5 10 15 20 25 30 35 40 45 50 In te n si ty ( a .u .) 2-theta (deg) H-ZSM-5-1000
21500
5 20 35 50 65 80 In te n si ty ( a .u .) 2-theta (deg)Figure 24. XRD pattern of commercial H-ZSM-5 (SAR=50) and lab-synthesized DS_ZSM-5_0,1
DS_ZSM-5_0,1
H-ZSM-5
Figure 25. XRD pattern of commercial H-ZSM-5 (SAR=50); indexed with [h,k,l] are the crystal
[011] [200]
[051]
[033] [313]
Results and discussion
Figure 26 compares the n-butylamine titration of commercial H-ZSM-5 and lab-synthesized DS_ZSM-5_0,1; even though the trend doesn’t show major differences, the sample obtained in the lab shows the same amount of stronger acid sites, a slightly higher amount of medium acid sites and double the amount of weak acid sites. This effect is probably due to the alkali-treatment and the consequential loss of silicon, that creates larger pores and exposes a higher number of acid sites to the surface. -200 -100 0 100 200 300 400 500 600 0 0.29 0.58 0.87 1.16 1.45 E le ct ro d e p o te n ti a l (m V )
Total amount of n-buytlamine (mmol/g)
DS_ZSM-5_0,1 H-ZSM-5
Figure 26. Potentiometric titration with n-butylamine graph of commercial H-ZSM-5 zeolite and lab-synthesized DS_ZSM-5_0,1.
Results and discussion
Figure 27 makes a comparison between all the lab-synthesized desilicated ZSM-5 samples. With the decrease of Si/Al ratio, can be observed a reduction of the intensity of the following peaks: [011], [200], [051], [033] and [313] (highlighted in Figure 18). A trend can be found, the higher the silicon loss, the greater the peak intensity weakening; the different heights of XRD intensities could be attributed to the unique unit-cell-volume parameters of each HZSM-5 sample. It is known that the unit cell volume becomes larger when small silicon atoms (2.22 Å) are replaced by larger aluminum atoms (2.86 Å). Awate et al.[14] demonstrated a linear expansion of H-ZSM-5 unit cell volume with a decreasing SiO2/ Al2O3 ratio.
Figure 28 shows the comparison between all the lab-synthesized desilicated catalysts. The same trend observed in Figure 19, is roughly respected among the above-mentioned samples; DS-ZSM-5_0,5 surprisingly shows a higher amount of
-1000
38000
5 20 35 50 65 80 In te n si ty ( a .u .) 2-theta (deg) DS_ZSM-5_0,1 DS_ZSM-5_0,7 DS_ZSM-5_0,5 DS_ZSM-5_0,3Results and discussion
Table 6 summarizes all the data from the potentiometric titrations of desilicated catalysts tested during the project.
Table 6. Electrode, calomel; Ei stands for initial electrode potential in mV.
Sample Code Ei (mV) Strong acid sites (E>100) Medium acid sites (0<E<100)
Weak acid sites (-100<E<0) Total (mmol/g) H-ZSM-5 (Si/Al=50) 563 0,42 0,04 0,15 0,61 DS_ZSM-5_0,1 453 0,42 0,06 0,31 0,79 DS_ZSM-5_0,3 550 0,48 0,06 0,27 0,81 DS_ZSM-5_0,5 523 0,72 0,10 0,22 1,04 DS_ZSM-5_0,7 532 0,46 0,10 0,33 0,89 -200 -100 0 100 200 300 400 500 600 0 0.375 0.75 1.125 1.5 E le ctr o d e p o te n ti a l (m V )
Total amount of n-buytlamine (mmol/g)
DS_ZSM-5_0,1 DS_ZSM-5_0,3 DS_ZSM-5_0,5 DS_ZSM-5_0,7
Figure 28. Potentiometric titration with n-butylamine graph of lab-synthesized desilicated H-ZSM-5 samples.
Results and discussion
3.3 Zeolitic Catalysts
Figure 29 compares the XRD pattern of the tested sample H-ZSM-5 (SAR=50) and the simulated XRD pattern of the same crystalline lattice supplied by the International Zeolite Association (IZA) website. Even though from the comparison it is deductible that the simulated pattern has a higher crystallinity, the reference peaks used for H-ZSM-5 identification are also found in the tested sample.
5 50
Figure 29. XRD patterns of the lab-tested H-ZSM-5 (50) sample and the simulated pattern of the same crystalline lattice from IZA website; SP stands for simulated pattern.
H-ZSM-5 (50)
Results and discussion
Figure 30 analyzes the XRD patterns of the tested H-ZSM-5 samples with different SAR values. Observing the reference peaks for H-ZSM-5 (indexed in Figure 18), two opposite trends can be found; in fact while the intensity of peaks [011] and [200] rises with the SAR value of the samples, the intensity of peaks [051], [033] and [313] decreases with the same index. This effect can be explained with the fact that Si/Al ratio can affect the structure of the zeolites, increasing Si/Al ratio increases the occupancy of low index surfaces such as [011], as suggested by Wengui Zhang et Al. who observed the same trend[14].
Figure 31 examines the potentiometric titration with n-butylamine of the H-ZSM-5 samples with different Si/Al ratio. The trend found in this graph, is the same observed by other research groups[15], for which the higher the Si/Al ratio the lower the
amount of acid sites. Even though the trend is followed by the three samples tested, the acidity gap between H-ZSM-5 (80) and H-ZSM-5 (100) appears to be much greater than expected; the discrepancy could be caused by the fact that, although a
-1500
31000
5 20 35 50 65 80 In te n si ty ( a .u .) 2-theta (deg)Figure 30. XRD patterns of the series of commercial H-ZSM-5 samples.
H-ZSM-5 (50) H-ZSM-5 (80) H-ZSM-5 (100)
Results and discussion
stable value of initial potential was reached, a longer period of stabilization was needed before starting the titration.
Figure 31. Potentiometric titration with n-butylamine graph of commercial samples of H-ZSM-5 catalysts with different Si/Al ratio.
Figure 32 compares the XRD pattern of the tested sample H-Mor (SAR=40) and the simulated XRD pattern of the same crystalline lattice supplied by the International Zeolite Association (IZA) website. Again, the simulated pattern shows a higher
crystallinity than the real sample tried; the reference peaks for Mordenite are found in the tested sample as well, confirming the nature of the sample.
-200 -100 0 100 200 300 400 500 600 0 0.375 0.75 1.125 1.5 E le ct ro d e p o te n ti a l (m V )
Total amount of n-buytlamine (mmol/g)
H-ZSM-5 (50) H-ZSM-5 (80) H-ZSM-5 (100)
Results and discussion
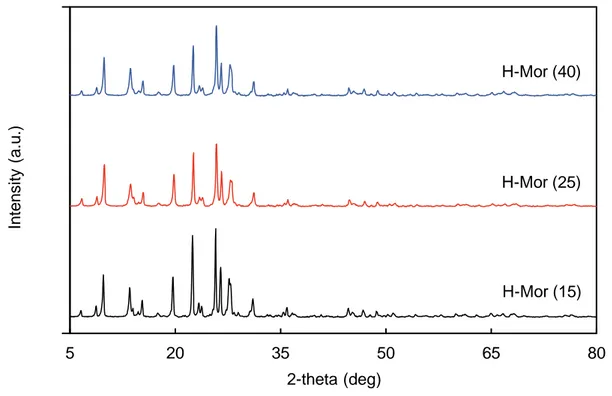
Figure 33 analyzes the XRD patterns of the tested H-Mordenite samples with different Si/Al ratio. The peak positions are nearly the same, while the peak intensities increase as the SAR value decreases.
Figure 34 examines the potentiometric titration with n-butylamine of H-Mordenite samples with different Si/Al ratio. The trend observed for ZSM-5 samples is partially followed, in fact, even though the sample H-Mor (15) was expected to be the one with the highest number of acid sites, it showed the opposite behavior, being the Mordenite sample with the lowest number of acid sites. The analysis of H-Mor (15) might be affected by a wrong time of stabilization before starting the titration, this might have led to an underestimation of the total number of acid sites.
5 50
H-Mor (40)
Figure 32. XRD patterns of the lab-tested H-Mordenite (40) sample and the simulated pattern of the same crystalline lattice from IZA website; SP stands for simulated pattern.
Results and discussion
Figure 33. XRD patterns of the series of commercial H-Mordenite samples.
-1500
28000
5 20 35 50 65 80 In te n si ty ( a .u .) 2-theta (deg) H-Mor (40) H-Mor (25) H-Mor (15) -200 -100 0 100 200 300 400 500 600 0 0.375 0.75 1.125 1.5 E le ct ro d e p o te n ti a l (m V )Total amount of n-buytlamine (mmol/g)
H-Mor (15) H-Mor (25) H-Mor (40)
H-Results and discussion
Figure 35 overlaps the XRD pattern of the tested sample H-Beta (mesoporous) and the simulated XRD pattern of the same crystalline lattice supplied by the International Zeolite Association (IZA) website. The H-Beta (mesoporous) zeolite was synthesized previously my project started; the H-Beta sample underwent an alkali-treatment alike the one performed on H-ZSM-5 sample, to achieve desilication and obtain larger pores as tested by J.C. Groen et al. and other research groups[16][17].
Because of the NaOH treatment, as expected the sample tested shows a lower crystallinity than the simulated pattern, reference peaks allow the identification though.
5 50
H-Beta
(mesoporous)
Figure 35. XRD patterns of the lab-tested H-Beta (mesoporous) sample and the simulated pattern of the same crystalline lattice from IZA website; SP stands for simulated pattern.
Results and discussion
Figure 36 analyzes the potentiometric titration with n-butylamine of three different categories sample, H-Beta (mesoporous), NIKKI and DS_ZSM-5_0,5. The aim of the graph was to compare acidity from such different samples. As expected, the two zeolite samples show a higher overall acidity than the amorphous silica-alumina catalyst; again, as predictable H-Beta (mesoporous) and DS_ZSM-5_0,5 have a higher number of strong acid sites than NIKKI. Interestingly though, while DS_ZSM-5_0,5 has less weak acid sites than NIKKI, H-Beta, probably due to the alkali-treatment, has more medium and weak acid sites than both the other samples.
Figure 37 compares, for identification, the XRD pattern of the tested sample HY and the simulated XRD pattern of the same crystalline lattice supplied by the International Zeolite Association (IZA) website; no further characterization has been done on the HY sample. -200 -100 0 100 200 300 400 500 600 0 0.375 0.75 1.125 1.5 E le ct ro d e p o te n ti a l (m V )
Total amount of n-buytlamine (mmol/g)
Hβ mesoporous NIKKI
DS_ZSM-5_0,5
Figure 36. Potentiometric titration with n-butylamine graph of different categories samples, NIKKI (ASA catalyst), Hß (zeolite) and DS_ZSM-5_0,5 (desilicated zeolite).
Results and discussion
Table 7. Electrode, calomel; Ei stands for initial electrode potential in mV.
Sample Code Ei (mV)
Strong acid sites (E>100)
Medium acid sites (0<E<100)
Weak acid sites (-100<E<0) Total (mmol/g) H-ZSM-5 (50) 563 0,42 0,04 0,15 0,61 H-ZSM-5 (80) 551 0,38 0,02 0,075 0,475 H-ZSM-5 (100) 301 0,03 0,013 0,057 0,1 H-Mordenite (15) 410 0,021 0,005 0,072 0,098 H-Mordenite (25) 488 0,066 0,018 0,316 0,4 H-Mordenite (40) 113 0,023 0,023 0,164 0,21 5 50 H-Y (5,1)
Figure 37. XRD patterns of the lab-tested H-Y (5,1) sample and the simulated pattern of the same crystalline lattice from IZA website; SP stands for simulated pattern.
Results and discussion
3.4 Reactivity experiments
Preliminary experiments, using NIKKI as catalyst with pellet size particles, were carried out in order to check feasibility of the reaction, as a heterogenous reaction, with the apparatuses chosen. The bench-scale plant was designed with a scale-down process starting from the currently running industrial plant.
Some tests were carried out varying temperature, while co-feeding all reactants; feed compositions was naphthalene 0,88 mol%, propylene 90,6 mol%, decalin 8,52 mol%. The method of feeding reactants was kept the same throughout all experiments as hereinafter described: naphthalene was dissolved in decalin in such proportion in order to get as close as possible to the solubility limit, then the solution was fed by means of a syringe pump while the gaseous stream of propylene was co-fed.
Reference experiments were also carried out without using any catalyst, while all the other conditions were kept constant; results suggested that no reaction was taking place, in fact, conversion didn’t reach values above 5%, with unidentified products. Figure 38 shows the conversion of naphthalene and yields to products in function of time while the temperature, starting from 150°C was risen of 15°C every 120
minutes, at the following conditions: naphthalene 0,88 mol%, propylene 90,6 mol%, decalin 8,52 mol%. Catalyst NIKKI, 1,0g, in pellet size particles.
Figure 39 shows the conversion of naphthalene and yields to products in function of time while the temperature, starting from 150°C was risen of 15°C every 120
minutes, at the following conditions: naphthalene 0,88 mol%, propylene 90,6 mol%, decalin 8,52 mol%. Catalyst Cat1s, 1,0g, in pellet size particles.
H-Beta
Results and discussion 0 20 40 60 80 100 30 80 130 180 230 280 330 C o n v e rsi o n , Y ie ld ( % ) time (min)
Figure 38. Effect of time on naphthalene conversion and on yield to products, while the
temperature, starting from 150°C was risen of 15°C every 120 minutes. Reaction conditions: feed composition (molar %): naphthalene/propylene/decalin 0,88/90,6/8,52. Symbols: naphthalene conversion (), yield to mono-isopropylnaphthalene isomers (●), di-isopropylnaphthalene isomers (▲), tri- and tetra-isopropylnaphthalene isomers (). Catalyst NIKKI, 1,0g, pellet size particles.
0 20 40 60 80 100 60 120 180 240 300 360 C o n v e rsi o n %, Y ie ld % time (min)
Figure 39. Effect of time on naphthalene conversion and on yield to products, while the
temperature, starting from 150°C was risen of 15°C every 120 minutes. Reaction conditions: feed composition (molar %): naphthalene/propylene/decalin 0,88/90,6/8,52. Symbols: naphthalene conversion (), yield to mono-isopropylnaphthalene isomers (●), di-isopropylnaphthalene isomers (▲), tri- and tetra-isopropylnaphthalene isomers (). Catalyst Cat1s, 1,0g, pellet size particles.
Results and discussion
Figure 40 shows the conversion of naphthalene and yields to products in function of time while the temperature, starting from 150°C was risen of 15°C every 120
minutes, at the following conditions: naphthalene 0,88 mol%, propylene 90,6 mol%, decalin 8,52 mol%. Catalyst Cat1L, 1,0g, in pellet size particles.
Figure 41 shows the conversion of naphthalene and yields to products in function of time while the temperature, starting from 150°C was risen of 15°C every 120
minutes, at the following conditions: naphthalene 0,88 mol%, propylene 90,6 mol%, decalin 8,52 mol%. Catalyst Cat4L, 1,0g, in pellet size particles.
0 20 40 60 80 100 30 90 150 210 270 330 C o n v e rsi o n %, Y ie ld % time (min)
Figure 38. Effect of time on naphthalene conversion and on yield to products, while the
temperature, starting from 150°C was risen of 15°C every 120 minutes. Reaction conditions: feed composition (molar %): naphthalene/propylene/decalin 0,88/90,6/8,52. Symbols: naphthalene conversion (), yield to mono-isopropylnaphthalene isomers (●), di-isopropylnaphthalene isomers (▲), tri- and tetra-isopropylnaphthalene isomers (). Catalyst Cat1L, 1,0g, pellet size particles.
Results and discussion
Even though these experiments demonstrated that the whole process was running correctly, it was not clear if the catalyst behavior shown was effectively the
deactivation pattern. This doubt rose with all the silica-alumina catalysts supplied by Rutgers.
Comparing naphthalene conversion and yield to products of the previous graphs, it is straightforward to see how the above-mentioned doubt came together; in fact,
checking these parameters, all the catalysts appear to have the same activity. Using NIKKI catalyst, supplied by Rutgers, the aim moved onto the refining of the scale down process from the industrial plant to the bench-scale plant, in order to monitor and study the catalyst deactivation.
The hypothesis made, was that the data deriving from the first 90 minutes of reaction were misleading, in fact, those values could be given by the filling of the reactor volume. 0 20 40 60 80 100 30 90 150 210 270 330 C o n v e rsi o n % , Y ie ld % time (min)
Figure 39. Effect of time on naphthalene conversion and on yield to products, while the
temperature, starting from 150°C was risen of 15°C every 120 minutes. Reaction conditions: feed composition (molar %): naphthalene/propylene/decalin 0,88/90,6/8,52. Symbols: naphthalene conversion (), yield to mono-isopropylnaphthalene isomers (●), di-isopropylnaphthalene isomers (▲), tri- and tetra-isopropylnaphthalene isomers (). Catalyst Cat4L largepore, 1,0g, pellet size particles.
Results and discussion
Firstly, to improve the scale-down, a larger reactor was employed, from a 15mm diameter to a 25mm diameter reactor, keeping a better proportion between catalyst pellets size and the bed dimension, and avoiding any problem clogging related and the consequential built up pressure.
Some experiments were carried out, with the aim of limiting the problem just
mentioned, keeping the propylene flow unchanged 25ml/min while varying the feed flow of the naphthalene solution; 8ml/h for the first 30 minutes (molar %:
naphthalene/propylene/decalin 4,26/54,82/40,92), then 4ml/h for the rest of reaction (molar %: naphthalene/propylene/decalin 2,75/70,82/26,43).
These experiments showed that the hypothesis made was true, in fact, with a higher feed flow of naphthalene, the filling time of the reactor shortened. The deactivation issue remains unaltered though, indeed the conversion pattern shows a rise when the feed flow is lowered to 4ml/h, but then it reaches a plateau till the end of reaction (360 minutes), meaning no real deactivation of the catalyst is taking place yet. Some experiments were then carried out for longer periods; 24 hours and more reaction were performed.
Figure 42 shows the conversion of naphthalene and yields to products in function of time while the temperature was kept constant at 150°C. While the propylene flow was kept unchanged (25ml/min) for the whole reaction time, the naphthalene solution feed was changed as described: 8ml/h for the first 150 minutes (molar %:
naphthalene/propylene/decalin 4,26/54,82/40,92), then 4ml/h for 150 minutes (molar %: naphthalene/propylene/decalin 2,75/70,82/26,43), eventually 2ml/h for the rest of reaction (molar %: naphthalene/propylene/decalin 1,61/82,92/15,47). Reaction time:1815 minutes. Catalyst NIKKI, 1,0g, in pellet size particles.
Results and discussion
The conversion pattern, as expected, rises every time the naphthalene feed flow is lowered; after 24 hours though, it is not easy to tell if any deactivation is shown, while appears that the conversion reached a plateau value.
These results suggest that also the catalyst particles size need a scaling down in order to be able to evaluate the catalyst behavior, therefore some experiments have been carried out using smaller particles.
Along with the catalyst particles size, also the reactants feed flows have been changed, in order to achieve the most severe conditions on the lab-scale plant designed for the project, which should help to detect the catalyst deactivation. The propylene feed flow has been lowered to 5ml/min, while the naphthalene solution feed flow has been taken to 8ml/h; these new conditions make sure that the feed composition almost mirrors the one used on the industrial plant.
0 20 40 60 80 100 60 240 420 600 780 960 1140 1320 1500 1680 C o n v e rsi o n %, Y ie ld % time (min)
Figure 40. Effect of time on naphthalene conversion and on yield to products. Temperature
steady at 150°C. Reaction conditions: feed composition (molar %):
naphthalene/propylene/decalin 4,26/54,82/40,92 for the first 150 minutes; then 2,75/70,82/26,43 for 150 minutes; 1,61/82,92/15,47 till the end of reaction. Symbols: naphthalene conversion (), yield to mono-isopropylnaphthalene isomers (●), di-isopropylnaphthalene isomers (▲), tri- and tetra-isopropylnaphthalene isomers (). Catalyst NIKKI, 1,0g, pellet size particles.
Results and discussion
Figure 43 shows the conversion of naphthalene and yields to products in function of time while the temperature was kept constant at 150°C. Propylene flow (5ml/min) and naphthalene solution feed flow (8ml/h) were kept constant. Catalyst NIKKI, 1,0g, particle size 250/425µm.
Comparing the last graph with Figure 38, it is possible to spot immediately not only a higher naphthalene conversion value (87%), achieved after 120 minutes of reaction, but also a higher conversion plateau value reached after 360 minutes. It is thought that bigger catalyst particles, thus lower external surface area, caused a fast
saturation of active sites, limiting the conversion achievable just after 80 minutes of reaction; hence intraparticle diffusion is a strong limitation when using pellet size particles. The second major difference in the two experiments is about yields; in fact, to higher mono-isopropylated and di-isopropylated products yields, corresponded lower yield in tri- and tetra-isopropylnaphthalene. This result is a consequence of what just mentioned above, as a matter of fact, less saturated active sites allowed
0 20 40 60 80 100 90 150 210 270 330 390 C o n v e rsi o n %, Y ie ld % time (min)
Figure 41. Effect of time on naphthalene conversion and on yield to products. Temperature
steady at 150°C. Reaction conditions: feed composition (molar %):
naphthalene/propylene/decalin 7,58/19,53/72,89. Symbols: naphthalene conversion (), yield to mono-isopropylnaphthalene isomers (●), di-isopropylnaphthalene isomers (▲), tri- and tetra-isopropylnaphthalene isomers (). Catalyst NIKKI, 1,0g, particle size 250/425µm.
Results and discussion
more easily, while heavily saturated acid sites facilitated consecutive alkylation reactions which led to high yield in tri- and tetra-isopropylnaphthalene. These results confirm one of the hypotheses, which stated that amorphous silica-alumina materials contain a small number of Brønsted acid sites that have intrinsic activity similar to that in zeolites; despite the interesting naphthalene conversion reached, work should be done to achieve higher selectivity to the desired product.
These same reaction conditions were then used to test all the other catalyst after verifying they allow a realistic comparison between all the samples.
3.5 Internal diffusion limitation
The more severe reaction conditions adopted along with particle size of 250/425µm, allowed to achieve results of naphthalene conversion and yield to products very close to those obtained on the industrial plant; it is necessary though to verify that those conditions are not affected by any diffusion limitations.This section deals in particular with limitations that might derive from internal diffusion.Some experiments have been carried out varying catalyst granulometry while keeping all the other conditions
unchanged. Using catalyst NIKKI, along with particle size of 250/425µm whose result has been showed above, particle size of 125/250µm and 425/530µm have been tested.The hypothesis behind these experiments is that reactants would react immediately on the catalyst surface, with a limited number of active sites, without diffusing inside catalyst pores where the highest number of active sites is found.If the alleged limitations are not influencing the system, no major differences should be found between different particle size catalyst reactivity. Figure 44 shows the conversion of naphthalene and yields to products in function of time while the
temperature was kept constant at 150°C. Propylene flow (5ml/min) and naphthalene solution feed flow (8ml/h) were kept constant. Catalyst NIKKI, 1,0g, particle size 425/530µm. Figure 45 shows the conversion of naphthalene and yields to products in function of time while the temperature was kept constant at 150°C. Propylene flow (5ml/min) and naphthalene solution feed flow (8ml/h) were kept constant. Catalyst NIKKI, 1,0g, particle size 125/250µm.
Results and discussion 0 20 40 60 80 100 90 150 210 270 330 390 C o n v e rsi o n % , Y ie ld % time (min)
Figure 45. Effect of time on naphthalene conversion and on yield to products. Temperature
steady at 150°C. Reaction conditions: feed composition (molar %):
naphthalene/propylene/decalin 7,58/19,53/72,89. Symbols: naphthalene conversion (), yield to mono-isopropylnaphthalene isomers (●), di-isopropylnaphthalene isomers (▲), tri- and
tetra-0 20 40 60 80 100 100 160 220 280 340 400 C o n v e rsi o n % , Y ie ld % time (min)
Figure 42. Effect of time on naphthalene conversion and on yield to products. Temperature
steady at 150°C. Reaction conditions: feed composition (molar %):
naphthalene/propylene/decalin 7,58/19,53/72,89. Symbols: naphthalene conversion (), yield to mono-isopropylnaphthalene isomers (●), di-isopropylnaphthalene isomers (▲), tri- and tetra-isopropylnaphthalene isomers (). Catalyst NIKKI, 1,0g, particle size 425/530µm.
Results and discussion
The experiment carried out with 425/530µm catalyst particle does not show major differences from the results achieved with 250/425µm size particles. It is possible to notice a higher yield in tri- and tetra-isopropylnaphthalene that may be caused by the lower external surface area of the 425/530µm samples and the consequential slightly faster saturation of active sites that leads to consecutive alkylation. The results with 125/250µm particle size catalyst might at first suggest the presence of strong
limitations of external diffusion. The hypothesis is that with these particle size, internal limitations might affect to some extent the catalyst performance, but for the experiment reported in Figure 38 it is thought that clogging played a major role, thus, a second experiment was carried out using half the amount of catalyst (0,5g).
Figure 46 shows the conversion of naphthalene and yields to products in function of time while the temperature was kept constant at 150°C. Propylene flow (5ml/min) and naphthalene solution feed flow (8ml/h) were kept constant. Catalyst NIKKI, 0,5g, particle size 125/250µm. Even though the contact time is halved, It can be stated that no limitations are affecting the reaction rate in the conditions chosen for reactivity experiments: propylene flow (5ml/min), naphthalene solution feed flow (8ml/h) constant, catalyst 1,0g, particle size 250/425µm.
0 20 40 60 80 100 90 150 210 270 330 390 C o n v e rsi o n % , Y ie ld % time (min)
Figure 46. Effect of time on naphthalene conversion and on yield to products. Temperature
steady at 150°C. Reaction conditions: feed composition (molar %):
naphthalene/propylene/decalin 7,58/19,53/72,89. Symbols: naphthalene conversion (), yield to mono-isopropylnaphthalene isomers (●), di-isopropylnaphthalene isomers (▲), tri- and tetra-isopropylnaphthalene isomers (). Catalyst NIKKI, 0,5g, particle size 125/250µm.
Results and discussion
3.6 External diffusion limitation
This section is aimed to verify the presence of some limitations that might derive from external diffusion. Some experiments have been carried out varying naphthalene solution feed flow while keeping all the other conditions unchanged; also, the catalyst load has been modified according to the naphthalene feed flow in order to keep the contact time constant throughout all the series of tests. Using catalyst NIKKI,
250/425µm, other than 8ml/h of naphthalene feed flow and 1,0g of catalyst load, tests have been carried out with 4ml/h of naphthalene feed and 0,5g of catalyst load, and 2ml/h of naphthalene feed flow and 0,25g of catalyst load. It is thought that the heat released during the reaction could cause an increase in the reaction rate, right at the active sites, which would lead the diffusion through the boundary layer to be the rate determining step. Figure 47 shows the conversion of naphthalene and yields to products in function of time while the temperature was kept constant at 150°C. Propylene flow (5ml/min) and naphthalene solution feed flow (4ml/h) were kept constant. Catalyst NIKKI, 0,5g, particle size 250/425µm.
0 20 40 60 80 100 90 150 210 270 330 390 C o n v e rsi o n % , Y ie ld % time (min)
Figure 47. Effect of time on naphthalene conversion and on yield to products. Temperature
steady at 150°C. Reaction conditions: feed composition (molar %):
naphthalene/propylene/decalin 6,34/32,68/60,98. Symbols: naphthalene conversion (), yield to mono-isopropylnaphthalene isomers (●), di-isopropylnaphthalene isomers (▲), tri- and
tetra-Results and discussion
Figure 48 shows the conversion of naphthalene and yields to products in function of time while the temperature was kept constant at 150°C. Propylene flow (5ml/min) and naphthalene solution feed flow (2ml/h) were kept constant. Catalyst NIKKI, 0,25g, particle size 250/425µm.
The results highlight that with different naphthalene feed flow, the reactor filling time is consequentially divergent, and the stabilization of the system is reached later with lower feed flow. No major differences are found with the reaction of Figure 36 though, meaning that external diffusion might influence reaction rate within an insignificant limit. It can be stated that no limitations are affecting the reaction rate in the
conditions chosen for reactivity experiments: propylene flow (5ml/min), naphthalene solution feed flow (8ml/h) constant, catalyst 1,0g, particle size 250/425µm.
0 20 40 60 80 100 100 160 220 280 340 C o n v e rsi o n %, Y ie ld % time (min)
Figure 48. Effect of time on naphthalene conversion and on yield to products. Temperature
steady at 150°C. Reaction conditions: feed composition (molar %):
naphthalene/propylene/decalin 4,78/49,26/45,96. Symbols: naphthalene conversion (), yield to mono-isopropylnaphthalene isomers (●), di-isopropylnaphthalene isomers (▲), tri- and tetra-isopropylnaphthalene isomers (). Catalyst NIKKI, 0,25g, particle size 250/425µm.
Results and discussion
3.7 Amorphous silica-alumina catalysts reactivity
Once checked diffusion limitations are not affecting the system with the reaction conditions chosen, the project proceeded with the testing of the others silica-alumina catalysts; both those supplied by Rutgers and the lab-synthesized samples.
Figure 49, 50, 51 and 52 show the conversion of naphthalene and yields to products in function of time while the temperature was kept constant at 150°C. Propylene flow (5ml/min) and naphthalene solution feed flow (8ml/h) were kept constant. Catalyst are respectively Cat1s, Cat2L, Cat3s and Cat4L largepore, 250/425µm.
0 20 40 60 80 100 90 150 210 270 330 C o n v e rs io n % , Yi e ld % time (min)
Figure 49. Effect of time on naphthalene conversion and on yield to products. Temperature
steady at 150°C. Reaction conditions: feed composition (molar %):
naphthalene/propylene/decalin 7,58/19,53/72,89. Symbols: naphthalene conversion (), yield to mono-isopropylnaphthalene isomers (●), di-isopropylnaphthalene isomers (▲), tri- and tetra-isopropylnaphthalene isomers (). Catalyst Cat1s, 1,0g, particle size 250/425µm.
Results and discussion 0 20 40 60 80 100 90 150 210 270 330 C o n v e rs io n % , Yi e ld % time (min)
Figure 50. Effect of time on naphthalene conversion and on yield to products. Temperature
steady at 150°C. Reaction conditions: feed composition (molar %):
naphthalene/propylene/decalin 7,58/19,53/72,89. Symbols: naphthalene conversion (), yield to mono-isopropylnaphthalene isomers (●), di-isopropylnaphthalene isomers (▲), tri- and tetra-isopropylnaphthalene isomers (). Catalyst Cat2L, 1,0g, particle size 250/425µm.
0 20 40 60 80 100 90 150 210 270 330 C o n v e rs io n % , Yi e ld % time (min)
Figure 51. Effect of time on naphthalene conversion and on yield to products. Temperature
steady at 150°C. Reaction conditions: feed composition (molar %):
naphthalene/propylene/decalin 7,58/19,53/72,89. Symbols: naphthalene conversion (), yield to mono-isopropylnaphthalene isomers (●), di-isopropylnaphthalene isomers (▲), tri- and tetra-isopropylnaphthalene isomers (). Catalyst Cat3s, 1,0g, particle size 250/425µm.