Research article
People living with undiagnosed HIV infection and a low
CD4 count: estimates from surveillance data, Italy, 2012
to 2014
Vincenza Regine¹, Maria Dorrucci¹, Patrizio Pezzotti¹, Alessia Mammone², Chantal Quinten³, Anastasia Pharris³, Barbara Suligoi¹, the regional representatives of the National HIV Surveillance System⁴
1. Infectious Diseases Department, Italian National Institute of Health, Rome, Italy 2. National Institute for Infectious Diseases ‘L. Spallanzani’, Rome, Italy
3. European Centre for Disease Prevention and Control (ECDC), Stockholm, Sweden 4. The regional representatives are listed at the end of the article
Correspondence: Vincenza Regine ([email protected])
Citation style for this article:
Regine Vincenza, Dorrucci Maria, Pezzotti Patrizio, Mammone Alessia, Quinten Chantal, Pharris Anastasia, Suligoi Barbara, the regional representatives of the National HIV Surveillance System. People living with undiagnosed HIV infection and a low CD4 count: estimates from surveillance data, Italy, 2012 to 2014. Euro Surveill. 2018;23(15):pii=17-00240. https://doi.org/10.2807/1560-7917.ES.2018.23.15.17-00240
Article submitted on 30 Mar 2017 / accepted on 06 Jul 2017 / published on 12 Apr 2018
Background and aims: Late HIV diagnosis is associ-ated with onward HIV transmission, higher morbidity, mortality and healthcare costs. In Italy, more than half of people living with HIV were diagnosed late during the last decade, with a CD4 count < 350 cells/mm3 at diagnosis. We aimed to determine the number and characteristics of people living with undiagnosed HIV infection and low CD4 counts in Italy. Methods: Data on newly reported HIV diagnoses from 2012 –2014 were obtained from the national HIV surveillance system. We used the European Centre for Disease Prevention and Control HIV modelling tool to calculate the undi-agnosed prevalence and yearly diundi-agnosed fraction (YDF) in people with low CD4 count. Results: The esti-mated annual number undiagnosed HIV infections with low CD4 count was on average 6,028 (95% confidence interval (CI): 4,954–8,043) from 2012–2014. In 2014, most of the undiagnosed people with low CD4 count were men (82.8%), a third acquired HIV through sex between men (MSM) (35.0%), and heterosexual trans-mission (33.4%), respectively. The prevalence of undi-agnosed HIV infection was 11.3 (95% CI: 9.3–14.9) per 100,000 residents ranging from 0.7 to 20.8 between Italian regions. Nationally the prevalence rate was 280.4 (95% CI: 173.3–450.2) per 100,000 MSM, 8.3 (95% CI: 4.9–13.6) per 100,000 heterosexual men, and 3.0 (95% CI: 1.4–5.6) per 100,000 women. The YDF was highest among heterosexual women (27.1%; 95% CI: 16.9–45.2%). Conclusions: These findings highlight the importance of improving efforts to identify undiag-nosed HIV infections primarily among men, both MSM and heterosexual men.
Introduction
Late diagnosis of HIV remains a major public health concern worldwide [1-3]. In 2015, close to half (48%)
of people newly diagnosed with HIV in European coun-tries were late presenters, with CD4 counts below 350 cells/mm3 at diagnosis, including 28% with advanced
HIV infection (CD4 < 200 cells/mm3) [1]. In Italy, despite
HIV testing and healthcare being free of cost for the individual, more than half of the ca 4,000 people diag-nosed with HIV annually are diagdiag-nosed with a CD4 count < 350 cells/mm3, and ca 40% are at the
sympto-matic stage of infection when diagnosed [4,5].
The late diagnosis of HIV infection has negative conse-quences, both at the individual and population levels. People presenting late respond insufficiently to antiret-roviral therapy (ART) and treating them is often com-plex and costly. Individuals who are in an advanced stage of immunosuppression due to HIV are at high risk of clinical events and death [6,7]. At population level, those diagnosed late are a potential source of HIV transmission for a considerable period [8]. Low CD4 count and high viral load contribute significantly to the risk of sexual transmission [9].
Given the prevalence of late diagnoses, it is likely that a considerable number of people with low CD4 counts remain undiagnosed in Italy. Mammone et al. estimated that there are 12,000–18,000 undiagnosed people liv-ing with HIV in Italy [10], although no estimate of those undiagnosed with a low CD4 count was calculated. Knowing the numbers of people living with undiag-nosed HIV and with a low CD4 count could be useful in predicting the prevalence of late HIV presentation and its consequences of poor prognosis and onward trans-mission. Being aware of the overall numbers of those who are undiagnosed and of the respective numbers in relevant subpopulations can support the monitor-ing of national and local HIV prevention strategies, the
Figure 1
Prevalence rates of people living with undiagnosed HIV and with low CD4 cell counta by HIV exposure groupb and regionc, Italy, 2014 <4 per 100,000 A. Total population 4–8 per 100,000 8–12 per 100,000 12–16 per 100,000 ≥16 per 100,000 <4 per 100,000
C. Men who have sex with men
4–8 per 100,000 8–12 per 100,000 12–16 per 100,000 ≥16 per 100,000 <4 per 100,000 D. Heterosexual men 4–8 per 100,000 8–12 per 100,000 12–16 per 100,000 ≥16 per 100,000 <4 per 100,000 B. Heterosexual women 4–8 per 100,000 8–12 per 100,000 12–16 per 100,000 ≥16 per 100,000
MSM: men who have sex with men.
a CD4 count < 350 cells/mm3
b The undiagnosed rates were calculated as follows: total population (panel A) – number of all undiagnosed with CD4 < 350 cells/mm3 divided
by the number of residents in each region, multiplied by 100,000; Italian average: 11.3 (95%CI:9.3-14.9) per 100,000 residents. Heterosexual women (panel B) – number of undiagnosed heterosexual women with CD4 < 350 cells/mm3 divided by the number of women resident in each region, multiplied by 100,000; Italian average: 3.0 (95%CI: 1.4-5.6) per 100,000 heterosexual women residents. MSM (panel C) – number of undiagnosed MSM with CD4 counts < 350 cells/mm3 divided by the number of MSM (3% of men) resident in each region, multiplied by 100,000; Italian average: 280.4 (95%CI: 173.3–450.2) per 100,000 MSM residents. Heterosexual men (panel D) – number of undiagnosed heterosexual men with CD4 counts < 350 cells/mm3 divided by the number of heterosexual men (97% of men), resident in each region, multiplied by 100,000; Italian average: 8.3 (95%CI:4.9-13.6) per 100,000 heterosexual men residents.
c For regions (one in the Central area and one in the North area) that did not collect data on the clinical stage and CD4 count, the number of
revision of health policies and the allocation of eco-nomic resources to prevention and control efforts [11]. The aim of this study was to estimate the number of people living with undiagnosed HIV and a low CD4 count in Italy, to analyse the characteristics of this pop-ulation and to evaluate the prevalence of undiagnosed HIV infection in the general population.
Methods
To estimate the number of people living with undi-agnosed HIV and a low CD4 count, we applied the model proposed by Lodwick et al. [12]. This model is part of the European Centre for Disease Prevention and Control (ECDC) HIV modelling tool. The tool uses routine surveillance data to calculate estimates of the number of people living with HIV as well as of those not yet diagnosed. It does not depend on historical data, i.e. it can be used even with limited years of available data [13]. Of the two models included we choose the London model as it applies to the way HIV data was collected through the Italian HIV surveillance system effective as of 2012.
Data source
We obtained data from the Italian National HIV Surveillance system (INHS) on people aged > 15 years
who were diagnosed with HIV between 2012 and 2014 and reported to the INHS by June 2015 [5].
In Italy, the reporting of new HIV diagnoses is manda-tory since July 2008 for all clinicians [14]. There are 173 Infectious Diseases Centers (IDC) in Italy that offer free monitoring and health management to all HIV-positive persons, including non-nationals and undocumented migrants [15]. Most people who test HIV-positive are diagnosed at IDCs directly and those who are tested in other health facilities are further referred to an IDC for confirmatory testing and diagnosis.
Data on new diagnoses are collected by regional sur-veillance systems and sent annually to the INHS coor-dinated by the Italian national institute of health in Rome. While the surveillance did not cover all regions previously, since 2012 there was 100% geographical coverage with all regions reporting data to the INHS [5]. The INHS collects the following data on an annual basis: (i) demographic data (age, sex, nationality, geo-graphical area of diagnosis, and geogeo-graphical area of residence), (ii) clinical information (clinical stage, CD4 counts, and viral load) and (iii) HIV exposure group data (people who inject drugs (PWID), heterosexual
Figure 2
Correlation between the prevalence rates of undiagnosed people living with HIV and with low CD4 counta and new HIV diagnoses rates, Italy, 2014
0 5 10 15 20 25 0 2 4 6 8 10 12
Rate of undiagnosed people living with HIV and with CD4 < 350 cell/mm 3 per 100,000 residents
Rate of new HIV diagnoses per 100,000 residents
ρ of Spearman= 0.656 p value=0.002
women, heterosexual men, men who have sex with men (MSM), and other/not available) [5].
Residences in Italy were grouped into three areas based on the of Italian National Bureau of Statistics (ISTAT) classification: (i) North (Piemonte, Valle d’Aosta, Liguria, Lombardia, Trentino–Alto Adige, Friuli–Venezia Giulia, Veneto and Emilia Romagna); (ii) Central (Toscana, Marche, Lazio, and Umbria); and (iii) South (Abruzzo, Molise, Campania, Puglia, Calabria, Basilicata, Sicilia, and Sardegna) [16]. For non-Italian citizens without residence in Italy, we assigned the place of diagnosis as residence.
Description of the model
The model proposed by Lodwick et al. [12] is based on back-calculation principles. In brief, the method assumes that people living with undiagnosed HIV develop AIDS or other HIV-related symptoms of suf-ficient severity, or symptoms which are sufsuf-ficiently specific to HIV, and will seek care and, as a result, be diagnosed with HIV. It uses information derived from people newly diagnosed at an advanced stage of HIV infection (clinical stage B or clinical stage C) with CD4 counts < 350 cells/mm3, stratified into eight groups
based on CD4 counts at HIV diagnosis (< 20, 20–49, 50–99, 100–149, 150–199, 200–249, 250–299, 300– 350). Specifically, for each CD4 count stratum the num-ber of those undiagnosed is obtained by dividing the number of symptomatic diagnoses by the CD4-specific rate of HIV symptoms estimated in cohort studies. The total number of undiagnosed people with HIV with a CD4 count < 200 cells/mm3(advanced HIV infection)
was obtained summing the specific stratum estimates, from the first (< 20 cells/mm3) to the fifth (150–199
cells/mm3) stratum. Similarly, the total number of
undi-agnosed people with HIV with a CD4 count < 350 cells/ mm3 (late presenters) was obtained summing the eight
specific stratum estimates.
The ECDC HIV modelling tool version 1.2.1 [13] was used to calculate the estimates stratified by main demo-graphic characteristics (age, sex, nationality, geo-graphical area of residence) and HIV exposure groups (PWID, heterosexual women, heterosexual men, MSM, and other/not available). The tool permits the estima-tion of undiagnosed people living with HIV according to the different characteristics.
Adjustment for missing values and reporting
delay
The estimates obtained from the model were adjusted for reporting delays or underreporting of HIV diagnoses with HIV-related symptoms as proposed in the original publication [12]. As information on clinical stage and CD4 count were missing in around 30% of the INHS records, the missing values were adjusted under the assumption that the distribution of clinical stage and CD4 count among diagnosed cases with missing data was similar to that of diagnosed cases with available data [17]. In brief, the estimates obtained from the
London method were divided by the proportion of all diagnoses with symptoms, where the CD4 count was known.
The following steps were used for the adjustment: first, the proportion of missing data was calculated relative to the clinical stage and CD4 count for each character-istic of the new diagnoses. Second, the estimates of undiagnosed people living with HIV were multiplied by the inverse of the missing proportion according to each characteristic. Last, the reporting delay to the INHS was considered, with the adjusting of the annual esti-mates by a reporting delay of 5%, introduced for each year of the 3 years, given that all new HIV diagnoses were notified to the surveillance system within 3 years after diagnosis [5]. In other words, it was assumed that in 2015 the INHS data were all complete for 2012 (100%), and almost complete for 2013 (95%) and 2014 (90%). Therefore, for each characteristic we adjusted the estimates multiplying them by the following:
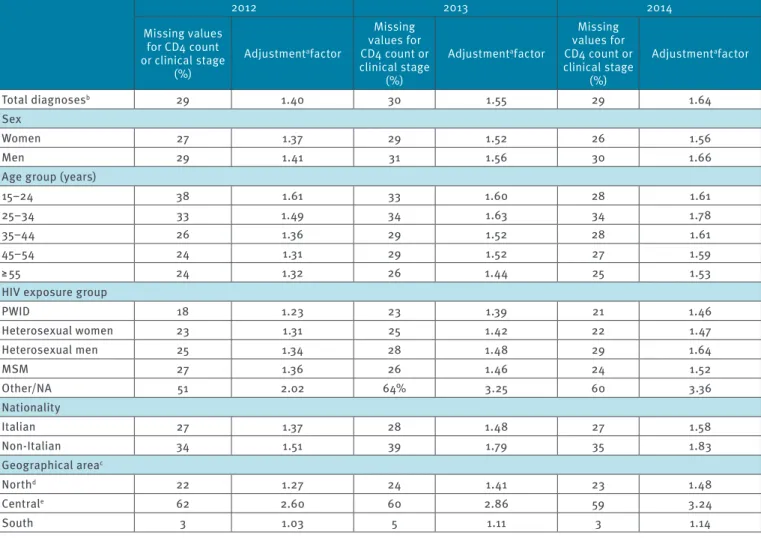
Table 1 shows the proportion of missing data (of CD4 count and/or clinical stage) with the respective ‘adjustment factors’ applied to undiagnosed people living with HIV estimates by main characteristics. As an example, when estimating the undiagnosed number of women, missing CD4 count and clinical stage accounted for 27% in 2012, 29% in 2013, and 26% in 2014 of the cases. The adjustment factors for women were: 1/(1 - 0.27) = 1.37; 1/(1 - 0.29 - 0.05) = 1.52 and 1/(1 - 0.26 - 0.05 - 0.05) = 1.56 in the 3 years, respec-tively. Of note, there was a direct relationship between the proportions of missing data and the value of the adjustment factors: the higher the adjustment factor, the higher the proportion of missing data (Table 1).
Characteristics of people undiagnosed and
newly diagnosed with HIV and with low CD4
count in 2014
The characteristics of both people undiagnosed and newly diagnosed with HIV and a low CD4 count were described for the year 2014 to compare characteristics of those undiagnosed with low CD4 count with new HIV diagnoses with a low CD4 count.
The yearly diagnosed fraction (YDF) in people with a low CD4 count (CD4 < 350 cells/mm3 or CD4 < 200 cells/
mm3) was calculated according to main characteristics
for the year 2014. YDF has been recently proposed by Sasse et al. [18] to evaluate the ratio of new diagnoses among people living with HIV who can be diagnosed in a given year. In our study, YDF was calculated among people with HIV and with a low CD4 count according to the following formula:
Adjustment factor =
(1 – proportion of missing − annual reporting delay) 1
.
YDF = x 100
( Number of new diagnoses + Estimated number of undiagnosed HIV ) Number of new diagnoses
Prevalence of undiagnosed HIV infection with
low CD4 count in 2014
To evaluate the prevalence of undiagnosed people liv-ing with HIV and a low CD4 count for the year 2014, the rate expressed was calculated as follows:
As a denominator, the population aged > 15 years up to 75 years estimated by the ISTAT was used [16].The described undiagnosed prevalence of HIV infection was also calculated by region of residence and by HIV exposure group. As denominator, the female popula-tion for heterosexual women and the male populapopula-tion for men was used. For MSM, a proportion of 3% of the adult male population was assumed, given that pub-lished data reveals estimates of MSM ranging from 2% to 4% of the male population in Italy [19-21]. Thus, for heterosexual men the remaining 97% of male popula-tion was used.
Results
National HIV surveillance system data
About 4,000 new HIV diagnoses were notified to the INHS annually during the period 2012–2014 (Table 2). Clinical stage at HIV diagnosis was reported for 70% of people, 39% of them were diagnosed at clinical advanced stage (clinical stage B or C). Table 2, shows the distribution of new HIV diagnoses by main char-acteristics; these were similar during the 3 years: the majority were men, more than half aged between 25 and 44 years, and more than one third were MSM. More than half were diagnosed late, namely with CD4 count < 350 cells/mm3.
Estimates of people living with undiagnosed
HIV and a low CD4 count
Using the described model, the estimated number of people living with undiagnosed HIV infection and with CD4 count < 350 cells/mm3 in Italy was 6,028 (95% CI:
5,090–7,826) in 2012, 6,156 (95% CI: 4,891–8,517) in 2013, and 5,899 (95% CI: 4,882–7,786) in 2014. Table 3, shows the estimated number of undiagnosed peo-ple living with HIV and CD4 count < 350 cells/mm3 by
demographic information, and by geographical area of residence. The highest estimated numbers in 2014 were in men (4,893; 95% CI: 3,992–6,568), both MSM (2,115; 95% CI: 1,292–3,395) and heterosexual men (2,017; 95% CI: 1,183–3,301) as well as in people living in the North (2,475; 95% CI: 1,651–3,783).
The estimated number of people living with undiag-nosed HIV infection and CD4 count < 200 cells/mm3 in
Italy was 2,467 (95% CI: 2,052–3,145) in 2012, 2,456 (95% CI: 2,027–3,151) in 2013, and 2,524 (95% CI: 2,075–3,246) in 2014 (Table 3). Also for the undiag-nosed people with CD4 count < 200 cells/mm3, the
high-est high-estimates were in men, those living in the North and in MSM.
Among the undiagnosed people living with HIV and with low CD4 count, the proportion of those with CD4 count < 200 cells/mm3 was 40.9% in 2012, 39.9% in 2013,
and 42.8% in 2014. These proportions were similar according to all characteristics from 2012 to 2014.
Characteristics of people undiagnosed and
newly diagnosed with HIV and with low CD4
count in 2014
In Table 4, for the year 2014, main characteristics of people undiagnosed and newly diagnosed with HIV and with a low CD4 count are compared. The charac-teristics of those newly diagnosed and with a low CD4 count were similar to those of people with undiagnosed HIV and with a low CD4 count.
Many people undiagnosed and with CD4 count < 350 cells/mm3 were men and older than 35 years, while a
third were MSM and, another third were heterosexual men. About a third were born abroad and nearly half resided in the North of Italy. Similarly, men (MSM and heterosexual men), people older than 35 years, and those living in the North were among those most repre-sented among undiagnosed people with HIV and with CD4 count < 200 cells/mm3 (Table 4).
In Table 4 also shows the YDFs by main characteristics and CD4 count. The YDF was 20.6% (95% CI: 16.4– 23.8%) among people with CD4 count < 350 cells/mm3;
the highest proportion was observed among hetero-sexual women (27.1%; 95% CI: 16.9–45.2%) and among people living in the North (26.6%; 95% CI: 19.1–35.2%). The YDF among people with CD4 count < 200 cells/ mm3 was 28.3% (95% CI: 23.5–32.5%); once again, the
highest proportion was observed among heterosexual women (36.1%; 95% CI: 26.0–49.9%). Similar results for the previous years (2012 and 2013) were observed (data not shown).
Prevalence of people living with undiagnosed
HIV and with low CD4 cell count in 2014
Figure 1 shows the prevalence of people with undiagnosed HIV and with CD4 < 350 cells/mm3,
calcu-lated as a rate per 100,000 adult residents. Overall, this rate was 11.3 (95% CI: 9.3–14.9) per 100,000 resi-dents older than 15 years. The prevalence of people with undiagnosed HIV varied between the different Italian regions from 0.7 per 100,000 (Calabria) to 20.8 per 100,000 adults (Liguria); North and Central areas showed higher rates of those undiagnosed with a low CD4 count (Figure 1A ).
Figure 1 (Panel B–D) shows the regional prevalence rates of undiagnosed people with HIV and with low CD4 cell count by HIV exposure groups. For heterosexual women the prevalence rate was 3.0 (95% CI: 1.4–5.6) per 100,000 women; the regional rates ranged from 0.1 (Friuli) to 15.6 (Trentino Alto Adige). Most of the Italian regions (15 regions) had prevalence rates ranging from 2.0 to 4.0 per 100,000 women (Figure 1B). For MSM the rate at national level was 280.4 (95% CI: 173.3
x 100,000
Number of people aged 15−74 years
– 450.2) per 100,000 MSM, for heterosexual men it was 8.3 (95% CI: 4.9–13.6) per 100,000 heterosexual men. The prevalence rates among MSM ranged from 6.2 (Basilicata, Molise, and Valle d’Aosta) to 450.6 (Liguria); almost all regions showed rates higher than 16 per 100, 000 (Figure 1C), in particular five regions showed a regional rate higher than 300.0 per 100,000 MSM (Umbria, Sicilia, Toscana, Lombardia, and Liguria) (results not shown in the figure). The regional rates varied for heterosexual men from 0.4 (Basilicata, and Friuli) to 16.1 (Valle d’Aosta) per 100,000 heterosexual men; almost half of the Italian regions (nine regions) had an estimated prevalence rate higher than 8.0 per 100,000 heterosexual men (Figure 1D).
The annual rate of new diagnoses in Italy was 6.1 per 100,000 adult residents in 2014, ranging from 2.0 (Calabria region) to 11.1 (Lazio region) [5] (data not shown).
Figure 2 shows the relationship between the prevalence rate of undiagnosed HIV infection with CD4 count < 350 cells/mm3, and the rate of new HIV diagnoses
in the 20 Italian regions. A positive correlation (ρ Spearman = 0.66; p value = 0.002) showed that regions with higher rate of new diagnoses also were the regions with a higher rate of undiagnosed people.
Table 1
CD4 count and/or clinical stage missing value proportions for HIV diagnoses and adjustment factors by specific stratum estimate for undiagnosed people living with HIV by year, Italy, 2012–2014
2012 2013 2014 Missing values for CD4 count or clinical stage (%) Adjustmentafactor Missing values for CD4 count or clinical stage (%) Adjustmentafactor Missing values for CD4 count or clinical stage (%) Adjustmentafactor Total diagnosesb 29 1.40 30 1.55 29 1.64 Sex Women 27 1.37 29 1.52 26 1.56 Men 29 1.41 31 1.56 30 1.66
Age group (years)
15–24 38 1.61 33 1.60 28 1.61
25–34 33 1.49 34 1.63 34 1.78
35–44 26 1.36 29 1.52 28 1.61
45–54 24 1.31 29 1.52 27 1.59
≥ 55 24 1.32 26 1.44 25 1.53
HIV exposure group
PWID 18 1.23 23 1.39 21 1.46 Heterosexual women 23 1.31 25 1.42 22 1.47 Heterosexual men 25 1.34 28 1.48 29 1.64 MSM 27 1.36 26 1.46 24 1.52 Other/NA 51 2.02 64% 3.25 60 3.36 Nationality Italian 27 1.37 28 1.48 27 1.58 Non-Italian 34 1.51 39 1.79 35 1.83 Geographical areac Northd 22 1.27 24 1.41 23 1.48 Centrale 62 2.60 60 2.86 59 3.24 South 3 1.03 5 1.11 3 1.14
NA: not available; MSM: men who have sex with men; PWID: people who inject drugs.
a Adjustment factors were calculated as follows = 1 / (1 - proportion of missing - annual reporting delay).
b Missing values for CD4 count in 2012 were 21.7% and for clinical stage 28.2%; missing values for CD4 count in 2013 were 21.8% and for
clinical stage 30.1%; missing values for CD4 count in 2014 were 22.2% and for clinical stage 28.6%.
c North area includes: Piemonte, Valle d’Aosta, Liguria, Lombardia, Trentino– Alto Adige, Friuli–Venezia Giulia, Veneto, Emilia Romagna;
Central area includes: Toscana, Marche, Lazio, Umbria; South area includes: Abruzzo, Molise, Campania, Puglia, Calabria, Basilicata, Sicilia, Sardegna.
d In the North area, the proportion of missing values were concentrated mainly in one region that does not routinely collect data on clinical
stage.
e In the Central area, the proportion of missing values were concentrated mainly in one region (100% in one region and less than 5% in the
Discussion
Estimating the number of people living with undiag-nosed HIV and with a low CD4 count enables the iden-tification of determinants for a delayed access to care. We estimated the number of people with HIV and with a low CD4 count in Italy who are not yet diagnosed using an easy, reproducible, and validated model [13]. The strength of this study is that it provided estimates of demographic characteristics of undiagnosed people with HIV. The average yearly number of people living with undiagnosed HIV infection and CD4 < 350 cells/ mm3 was 6,000 over the period 2012 to 2014, with
a similar pattern across the years. The estimate of people with low CD4 count corresponded to 40% of the total number of people (including asymptomatic) with undiagnosed HIV infection in Italy (i.e. 15,000) [10]. The same proportion of people (40%) with CD4 count < 350 cells/mm3 was found in France for the estimated
undiagnosed people with HIV in 2010 [22]. Our num-bers indicate there are a substantial number of people with undiagnosed HIV in Italy who need to be treated immediately. Failure to diagnose these individuals will result in greater morbidity and mortality for them, risk
Table 2
Main characteristics of new HIV diagnoses in people aged above 15 years by year, Italy, 2012–2014
2012 2013 2014 n % % excluding NA values n % % excluding NA values n % % excluding NA values Total diagnoses 4,127 – – 3,797 – – 3,679 – – Sex Women 872 21.1 21.1 833 21.9 21.9 746 20.3 20.3 Men 3,255 78.9 78.9 2,964 78.1 78.1 2,933 79.7 79.7
Age group (years)
15–24 331 8.0 8.0 291 7.7 7.7 322 8.8 8.8
25–34 1,319 32.0 32.0 1,121 29.5 29.5 1,063 28.9 28.9
35–44 1,239 30.0 30.0 1,210 31.9 31.9 1,131 30.7 30.7
45–54 827 20.0 20.0 775 20.4 20.4 746 20.3 20.3
≥ 55 411 10.0 10.0 400 10.5 10.5 417 11.3 11.3
HIV exposure groups
PWID 211 5.1 5.1 178 4.7 4.7 141 3.8 3.8 Heterosexual women 704 17.1 17.1 709 18.7 18.7 625 17.0 17.0 Heterosexual men 1,059 25.7 25.7 981 25.8 25.8 973 26.5 26.5 MSM 1,579 38.2 38.2 1,507 39.7 39.7 1,512 41.1 41.1 Other/NA 574 13.9 13.9 422 11.1 11.1 428 11.6 11.6 Nationality Italian 3,019 73.1 73.6 2,864 75.4 75.6 2,671 72.6 72.9 Non-Italian 1,084 26.3 26.4 925 24.4 24.4 995 27.0 27.1 NA 24 0.6 – 8 0.2 – 13 0.4 – Geographical area North 2,354 57.0 57.0 2,113 55.6 55.6 1,978 53.8 53.8 Central 1,054 25.6 25.6 1,028 27.1 27.1 1,023 27.8 27.8 South 719 17.4 17.4 656 17.3 17.3 678 18.4 18.4
Clinical stage of HIV infection
A 1,832 44.4 61.8 1,660 43.7 62.6 1,705 46.3 64.9 B 483 11.7 16.3 397 10.5 14.9 352 9.6 13.4 C 649 15.7 21.9 596 15.7 22.5 571 15.5 21.7 NA 1,163 28.2 – 1,144 30.1 – 1,051 28.6 – CD4 count (cells/mm3) < 200 1,188 28.8 36.7 1,108 29.2 37.3 998 27.1 34.9 200–349 591 14.3 18.3 587 15.5 19.8 531 14.4 18.6 350–499 581 14.1 18.0 514 13.5 17.3 535 14.5 18.7 ≥ 500 873 21.2 27.0 759 20.0 25.6 798 21.7 27.9 NA 894 21.7 – 829 21.8 – 817 22.2 –
Table 3
Estimated number of people living with undiagnosed HIVa with CD4 < 350 cells/mm3 or CD4 < 200 cells/mm3, by main characteristics and year, Italy, 2012–2014
2012 2013 2014
Point estimate (n) 95% CI Point estimate (n) 95% CI Point estimate (n) 95% CI
Undiagnosed with CD4 < 350 cells/mm3
Total population 6,028 5,090–7,826 6,156 4,891–8,517 5,899 4,882–7,786
Sex
Women 1,230 1,021–1,690 1,200 650–2,051 1,017 499–1,790
Men 4,799 3,998–6,323 4,961 3,874–7,085 4,893 3,992–6,568
Age group (years)
15–24 148 29–349 267 40–589 218 32–500
25–34 1,483 811–2,510 1,593 849–2,749 1,283 671–2,171
35–44 1,963 1,255–3,074 1,935 1,224–3,095 1,798 1,047–2,958
45–54 1,393 828–2,262 1,354 750–2,316 1,294 672–2,277
≥ 55 932 459–1,670 965 458–1,752 1,233 640–2,149
HIV exposure group
PWID 413 132–868 304 104–603 213 55–457 Heterosexual women 1,039 539–1,787 952 480–1,689 827 374–1,514 Heterosexual men 1,863 1,177–3,322 2,018 1,242–3,263 2,017 1,183–3,301 MSM 1,860 1,164–2,937 2,050 1,255–3,279 2,115 1,292–3,395 Other/NA 835 376–1,554 1,037 273–2,268 868 306–1,701 Nationality Italian 4,386 3,382–6,101 4,703 3,617–6,617 4,178 3,128–5,922 Non-Italian 1,644 960–2,668 1,441 781–2,497 1,738 972–2,926 Geographical area North 3,063 2,203–4,462 2,924 2,025–4,414 2,475 1,651–3,783 Central 1,899 947–3,310 2,027 963–3,636 1,838 943–3,109 South 1,212 728–1,948 1,320 763–2,194 1,555 940–2,511
Undiagnosed with CD4 < 200 cells/mm3
Total population 2,467 2,052–3,145 2,456 2,027–3,151 2,524 2,075–3,246
Sex
Women 457 326–644 553 341–860 416 247–656
Men 2,012 1,650–2,590 1,903 1,544–2,472 2,114 1,714–2,755
Age group (years)
15–24 96 27–203 81 18–178 65 8–155
25–34 461 272–731 442 251–709 358 196–587
35–44 810 546–1,215 826 547–1,247 812 530–1,236
45–54 638 423–952 654 421–1,002 667 421–1,033
≥ 55 406 238–645 419 251–664 569 345–896
HIV exposure group
PWID 149 58–283 122 47–232 133 42–265 Heterosexual women 378 219–602 415 241–663 345 196–554 Heterosexual men 808 550–1,123 859 578–1,290 889 585–1,354 MSM 761 514–1,123 734 485–1,103 787 523–1,183 Other/NA 379 188–657 403 156–760 503 232–892 Nationality Italian 1,770 1,446–2,285 1,794 1,455–2,334 1,920 1,558–2,494 Non-Italian 701 452–1,070 674 417–1,047 590 350–942 Geographical area North 1,349 1,053–1,817 1,214 921–1,674 1,194 899–1,652 Central 531 284–877 729 417–1,171 768 421–1,254 South 517 341–777 520 335–795 568 369–866
CI: confidence interval; MSM: men who have sex with men; NA: not available; PWID: people who inject drugs.
of onward transmission and greater costs accrued for the health system.
Focusing on the most recent year analysed, the prev-alence of undiagnosed HIV infections was 11.3 per 100,000 adults in the resident population in 2014, rang-ing from 0.7 to 20.8 for different regions. Differences in regional prevalence could be attributed to factors, such as (i) different spread of HIV infection [5,15], (ii) different levels of HIV risk awareness [23,24], and (iii) the risk groups prevalent in each region.
This is in line with a cross-sectional study [20] that indicated a higher prevalence of people diagnosed and linked to care in northern Italy. Moreover, despite IDCs being well distributed throughout Italy, surveillance
data indicates higher numbers of new diagnoses of HIV infection and AIDS, as well as of HIV-positive people under treatment, in the North [5,15].
Different levels of HIV risk awareness were confirmed in a respective study, which showed that people living in the North were less aware of HIV risk factors com-pared with those in the Centre and South of Italy [23]. Furthermore, a study showed that regional differences of HIV risk awareness seem to be correlated with dif-ferent socioeconomic factors and lifestyles existent in North and South Italy (unpublished data).
Differences in regional prevalences of undiagnosed HIV infection were very similar to those observed among HIV-positive people diagnosed that were linked to care
Table 4
Proportions of new HIV diagnoses, undiagnosed and yearly diagnosed fraction among people living with HIV and with low CD4 counta by main characteristics, Italy, 2014
New diagnoses with CD4 < 350 cells/mm3 Undiagnosed people with CD4 < 350cells/ mm3 YDF in people with CD4 < 350 cells/ mm3 New diagnoses with CD4 < 200 cells/ mm3 Undiagnosed people with CD4 < 200 cells/ mm3 YDF in people with CD4 < 200 cells/ mm3 n % n % % 95% CI n % n % % 95% CI Total population 1,529 100.0 5,899 100.0 20.6 16.4–23.8 998 100.0 2,524 100.0 28.3 23.5–32.5 Sex Women 344 22.5 1,017 17.2 25.3 16.1–40.8 216 21.6 416 16.4 34.2 24.8–46.7 Men 1,185 77.5 4,893 82.8 19.5 15.3–22.9 782 78.4 2,114 83.6 27.0 22.1–31.3
Age group (years)
15–24 76 5.0 218 3.7 25.9 13.2–70.4 36 3.6 65 2.6 35.6 18.8–81.8
25–34 326 21.3 1,283 22.0 20.3 13.1–32.7 163 16.3 358 14.5 31.3 21.7–45.4
35–44 501 32.8 1,798 30.9 21.8 14.5–32.4 328 32.9 812 32.9 28.8 21.0–38.2
45–54 380 24.8 1,294 22.2 22.7 14.3–36.1 294 29.5 667 27.0 30.6 22.2–41.1
≥ 55 246 16.1 1,233 21.2 16.6 10.3–27.8 177 17.7 569 23.0 23.7 16.5–33.9
HIV exposure group
PWID 65 4.3 213 3.5 23.4 12.5–54.2 48 4.8 133 5.0 26.5 15.3–53.3 Heterosexual women 308 20.1 827 13.7 27.1 16.9–45.2 195 19.5 345 13.0 36.1 26.0–49.9 Heterosexual men 486 31.8 2,017 33.4 19.4 12.8–29.1 347 34.8 889 33.5 28.1 20.4–37.2 MSM 539 35.2 2,115 35.0 20.3 13.7–29.4 306 30.7 787 29.6 28.0 20.6–36.9 Other/NA 131 8.6 868 14.4 13.1 7.2–30.0 102 10.2 503 18.9 16.9 10.3–30.5 Nationality Italian 1,105 72.6 4,178 70.6 20.9 15.7–26.1 738 74.3 1,920 76.5 27.8 22.8–32.1 Non-Italian 418 27.4 1,738 29.4 19.4 12.5–30.1 255 25.7 590 23.5 30.2 21.3–42.1 Geographical area North 895 58.5 2,425 42.2 26.6 19.1–35.2 570 57.1 1,194 47.1 32.3 25.7–38.8 Central 230 15.1 1,838 31.3 11.1b 6.9–19.6 156 15.6 768 30.4 16.9b 11.1–27.0 South 404 26.4 1,555 26.5 20.6 13.9–30.1 272 27.3 568 22.5 32.4 23.9–42.4
MSM: men who have sex with men; NA: not available; PWID; people who inject drugs; YDF: yearly diagnosed fraction.
a Defined as CD4 < 350 cells/mm3 and CD4 < 200 cells/mm3.
b Data in this table are underestimated, as in the Central area new diagnoses with missing CD4 count was at 60%.
The YDF is expressed as the yearly number of new diagnoses / (yearly number of new diagnoses + estimated number of undiagnosed people living with HIV).
[15] as well as to differences observed among new HIV diagnoses across the Italian regions [5]. These findings confirm that, at least in Italy, regions with high rates of new diagnoses also encompass a high proportion of both diagnosed and undiagnosed people [5,15]. This highlights the importance of the regional differences in the spread of HIV infection that can be observed at a wider level across European countries as well as within the United States [25,26].
In addition, the highest prevalence of undiagnosed HIV infection was observed among MSM in whom it was 280 per 100,000 MSM, whereas among hetero-sexual men it was 8 per 100,000 heterohetero-sexual men, and among heterosexual women it was 3 per 100,000 female residents, with large differences across the Italian regions. Even though MSM have been reported to have high HIV testing rates compared with other key populations in high-income countries [24,27-29], as well as, the highest perception of the risk of HIV infec-tion [23,24], the study findings show that they account for the highest number (2,115) and the highest pro-portion (35%) of undiagnosed people with a low CD4 count in 2014. MSM in Italy are also the subgroup most represented (nearly 50%) among the total population of undiagnosed HIV people (including asymptomatic), as estimated by Mammone et al. [10]. This could be attributed to a high rate of new infections in this group during the most recent years [1,30-32] combined with a large number of undiagnosed people who contribute to ongoing transmission [10,22,33]. In addition, a high HIV prevalence and a high proportion of MSM with undiag-nosed HIV could be attributed to high levels of sexual activity and to some risk behaviours for sexual trans-mission of HIV [34]. Therefore, test-seeking behaviour should be encouraged and voluntary counselling and testing made more accessible in Italy, a country where the stigma against HIV and homosexuality may still be prevalent [20,35].
Focusing on the most recent year in our analysis, a high proportion of undiagnosed people with low CD4 count was reported among heterosexual men (33.4%), whereas in other Italian studies this popula-tion accounted for a quarter of the total undiagnosed (including those asymptomatic [10]), and a quarter of new diagnoses reported to the INHS [5]. The higher proportion of heterosexual men among undiagnosed with a low CD4 count could depend, partly, on the fact that heterosexuals were more likely to have a longer undiagnosed interval (time lag from infection to HIV diagnosis) as shown in other studies worldwide [8,36-38]. In Italy, Mammone et al. [37] estimated that het-erosexuals had a far longer lag from infection to HIV diagnosis compared with MSM (7.7 vs 3.7 years). We found a YDF of 20.6% which was similar to that reported recently by Sasse [18] on the total HIV popu-lation in the European countries. Among heterosexual women the YDF was the highest (27.1%) compared to the other groups, suggesting a more frequent access
to HIV testing, likely facilitated from routine screening during pregnancy in this population [5,39]. This result may mean a certain degree of success with regard to testing in this group. The highest YDF (26.6%) among people living in the North compared to the other areas may be an indicator of the wider availability of IDCs and HIV testing services in this area [40]. A higher detection could represent a more efficient and therefore better surveillance system.
This study has some limitations. First, we assumed that people with HIV who develop AIDS, or other HIV-related symptoms, will almost certainly present for care, and as consequence, will be all diagnosed with HIV and notified to the surveillance system (assumption of London method) [12,13]. However, the assumption of the London method can be considered acceptable for our study, as HIV testing and access to care are free in all IDCs and the proportion of people living with HIV who do not attend the IDCs should be reasonably low. Another limitation was the assumption that CD4 counts in those where the information was not available was the same as in those with available information. This assumption was supported by other studies conducted on the Italian HIV Surveillance data [10]. The missing CD4 count information, In the Italian national HIV sur-veillance data, mainly in the Central regions, may make the estimates less robust. However, in the remaining areas the proportion of missing data were lower than 10%.
In terms of the reporting delay we assumed a constant decrease over the 3 years. This had a small impact on the estimates as it was sufficiently low. Other limita-tions which may have a considerable impact on the eventual estimates include the effect of new testing strategies, the changes over time in the reporting of data, and the different quality of data in the surveil-lance systems of all the regions.
Conclusions
About 6,000 HIV-positive people with low CD4 counts, remained annually undiagnosed between 2012 and 2014 in Italy. This indicates that ca 40% of the 15,000 total undiagnosed people living with HIV in Italy were in immediate need of diagnosis, linkage to care and antiretroviral treatment in order to avert high HIV-related morbidity, mortality and healthcare costs. The majority of those with undiagnosed HIV and with low CD4 counts were MSM and heterosexual men, and there were large differences in prevalence of undiag-nosed HIV infections with low CD4 across the Italian regions. These findings highlight the importance of improving HIV testing availability, with a focus on men, in order to diagnose and provide treatment to those liv-ing with undiagnosed HIV in Italy.
Regional representatives of the National HIV Surveillance System
National HIV Surveillance System include: Abruzzo: Manuela Di Giacomo, Viviana Faggioni, Luigi Scancella; Basilicata: Francesco Locuratolo, Gabriella Cauzillo; Calabria: Anna Domenica Mignuoli, Daniele Giuseppe Chirico; Campania: Guglielmo Borgia; Emilia Romagna: Erika Massimiliani; Friuli Venezia Giulia: Tolinda Gallo, Cinzia Braida; Lazio: Vincenzo Puro, Paola Scognamiglio, Alessia Mammone; Liguria: Giancarlo Icardi, Piero Luigi Lai; Lombardia: Maria Gramegna, Liliana Coppola, Alessandra Piatti, Annamaria Rosa, Danilo Cereda; Marche: Fabio Filippetti; Molise: Alessandra Prozzo; Piemonte: Chiara Pasqualini; Provincia Autonoma di Bolzano: Peter Mian, Oswald Moling, Leonardo Pagani; Provincia Autonoma di Trento: Paolo Lanzafame, Lucia Collini, Danila Bassetti; Puglia: Maria Chironna; Sardegna: Maria Antonietta Palmas; Sicilia: Gabriella Dardanoni; Toscana: Fabio Voller, Monia Puglia, Lucia Pecori; Umbria: Anna Tosti, Rita Papili; Valle d’Aosta: Mauro Ruffier, Marina Giulia Verardo, Elisa Francesca Echarlod, Saveria Amoroso; Veneto: Francesca Russo, Filippo da Re.
Acknowledgements
The authors wish to thank all the regional representatives of the HIV Surveillance System for their useful help and constant availability. We would like to thank ISS colleagues involved in the management of National HIV Surveillance System: Laura Camoni, Mariangela Raimondo, Lucia Pugliese. The authors thank the referees for many helpful comments and suggestions.
Preliminary results of this study were presented orally at the 8th Italian Conference on AIDS and Retroviruses (ICAR), June 6–8 2016, Milan, Italy; Not Ist Super Sanità 2016; 29(9) Suppl 1, presentation n.47.
Financial support: The Italian National HIV Surveillance system is funded by the Italian Ministry of Health – CCM (National Centre for Disease Prevention and Control).
Conflict of interest
None declared.
Authors’ contributions
Vincenza Regine designed the study and was responsible for study coordination; Vincenza Regine and Maria Dorrucci made statistical analysis, applied the model and drafted the manuscript; Patrizio Pezzotti, Alessia Mammone and Chantal Quinten have made statistical advice, contributed to draft data interpretation and revised the manuscript; Anastasia Pharris contributed to draft data interpretation. Barbara Suligoi coordinated the National HIV Surveillance System, was the guarantor of the study and revised the manuscript. The regional representatives of the National HIV Surveillance System were responsible for data collection. All authors read, amended and approved the final manuscript.
References
1. European Centre for Disease Prevention and Control (ECDC) / World Health Organization Regional Office for Europe (WHO). HIV/AIDS surveillance in Europe 2015. Stockholm: ECDC;
2016. Available from: http://ecdc.europa.eu/en/publications/ Publications/HIV-AIDS-surveillance-Europe-2015.pdf 2. The late presenters working group in COHERE in EuroCoord.
Late presentation for HIV care across Europe: update from the Collaboration of Observational HIV Epidemiological Research Europe (COHERE) study, 2010 to 2013. Euro Surveill. 2015;20(47):30070.
3. Centers for Disease Control and Prevention (CDC). HIV Surveillance Report, 2014; vol. 26. Atlanta: CDC; Nov 2015. Available from: https://www.cdc.gov/hiv/library/reports/hiv-surveillance.html
4. Camoni L, Raimondo M, Regine V, Salfa MC, Suligoi Bregional representatives of the HIV Surveillance System. Late presenters among persons with a new HIV diagnosis in Italy, 2010-2011. BMC Public Health. 2013;13(1):281. https://doi. org/10.1186/1471-2458-13-281 PMID: 23537210
5. Raimondo M, Boros S, Regine V, Pugliese L, Santaquilani M, Ferri M, et al. Aggiornamento nuove diagnosi di infezione HIV e dei casi di AIDS 2015. [Updating of new diagnoses of HIV infection and AIDS cases in Italy at December 31, 2015]. Not Ist Super Sanità. 2016; 29(9) Suppl 1. Italian. Available from: http://www.iss.it/publ/index.php?lang=1&id=3003&tipo=4 6. Girardi E, Sabin CA, Monforte AD. Late diagnosis of HIV
infection: epidemiological features, consequences and strategies to encourage earlier testing. J Acquir Immune Defic Syndr. 2007;46(Suppl 1):S3-8. https://doi.org/10.1097/01. qai.0000286597.57066.2b PMID: 17713423
7. Platten M, Linnemann R, Kümmerle T, Jung N, Wyen C, Ehren K, et al. Clinical course and quality of care in ART-naïve patients newly presenting in a HIV outpatient clinic. Infection. 2014;42(5):849-57. https://doi.org/10.1007/s15010-014-0646-9 PMID: 24https://doi.org/10.1007/s15010-014-0646-965613
8. Wong NS, Wong KH, Lee MP, Tsang OTY, Chan DPC, Lee SS. Estimation of the undiagnosed intervals of HIV-Infected people by a modified back-calculation method for reconstructing the epidemic curves. PLoS One. 2016;11(7):e0159021. https://doi. org/10.1371/journal.pone.0159021 PMID: 27403882 9. Quinn TC, Wawer MJ, Sewankambo N, Serwadda D, Li C,
Wabwire-Mangen F, et al. Rakai Project Study Group. Viral load and heterosexual transmission of human immunodeficiency virus type 1. N Engl J Med. 2000;342(13):921-9. https://doi. org/10.1056/NEJM200003303421303 PMID: 10738050 10. Mammone A, Pezzotti P, Regine V, Camoni L, Puro V, Ippolito
G, et al. How many people are living with undiagnosed HIV infection? An estimate for Italy, based on surveillance data. AIDS. 2016;30(7):1131-6. https://doi.org/10.1097/ QAD.0000000000001034 PMID: 26807973
11. Op de Coul EL, Schreuder I, Conti S, van Sighem A, Xiridou M, Van Veen MG, et al. Changing Patterns of Undiagnosed HIV Infection in the Netherlands: Who Benefits Most from Intensified HIV Test and Treat Policies? PLoS One. 2015;10(7):e0133232. doi: https://doi.org/10.1371/journal. pone.0133232 . eCollection 2015.
12. Lodwick RK, Nakagawa F, van Sighem A, Sabin CA, Phillips AN. Use of surveillance data on HIV diagnoses with HIV-related symptoms to estimate the number of people living with undiagnosed HIV in need of antiretroviral therapy. PLoS One. 2015;10(3):e0121992. https://doi.org/10.1371/journal. pone.0121992 PMID: 25768925
13. European Centre for Disease Prevention and Control (ECDC). HIV modelling tool. Stockholm: ECDC; 14 Sep 2015. Available from: https://ecdc.europa.eu/en/publications-data/ hiv-modelling-tool
14. Italian Ministry of Health. Decreto Ministeriale 31 marzo 2008. Istituzione del sistema di sorveglianza delle nuove diagnosi di infezioni da HIV. [Establishment of the surveillance system for new diagnoses of HIV infection]. Gazzetta Ufficiale n. 175, 28 July 2008. Italian. Available from: http://old.iss.it/binary/ccoa/ cont/7_DECRETO_31_marzo_2008.pdf
15. Camoni L, Raimondo M, Dorrucci M, Regine V, Salfa MC, Suligoi BCARPHA Study Group. Estimating minimum adult HIV prevalence: a cross-sectional study to assess the characteristics of people living with HIV in Italy. AIDS Res Hum Retroviruses. 2015;31(3):282-7. https://doi.org/10.1089/ aid.2014.0154 PMID: 25432098
16. Istituto Nazionale di Statistica (ISTAT). Demografia in Cifre. [Demography in figures]. Rome: ISTAT. [Accessed 28 Jun 2017]. Italian. Available from: http://www.demo.istat.it/
17. Little RJA, Rubin DB. Statistical Analysis with Missing Data. 2nd ed. New York: Wiley; 2002.
18. Sasse A. Letter to the editor: New metrics to monitor progress towards global HIV targets: using the estimated number of undiagnosed HIV-infected people as denominator. Euro Surveill. 2016 Dec 15;21(50). pii: 30424. doi: https://doi. org/10.2807/1560-7917.ES.2016.21.50.30424
19. Marcus U, Hickson F, Weatherburn P, Schmidt AJEMIS Network. Estimating the size of the MSM populations for 38 European countries by calculating the survey-surveillance discrepancies (SSD) between self-reported new HIV diagnoses from the European MSM internet survey (EMIS) and surveillance-reported HIV diagnoses among MSM in 2009. BMC Public Health. 2013;13(1):919. https://doi.org/10.1186/1471-2458-13-919 PMID: 24088198
20. Istituto Nazionale di Statistica (ISTAT). [The homosexual population in Italian society]. Statistiche. Report Anno 2011. Italian. Available from: http://www.istat.it/it/archivio/62168 21. Grazzini G, Raimondo M, Facco G, Regine V, Pupella S, Piccinini
V, et al. A cross-sectional study among blood donors on sexual risk behaviors for HIV infection. Vox Sang. 2015;109(Suppl. 1):228-9.
22. Supervie V, Ndawinz JD, Lodi S, Costagliola D. The
undiagnosed HIV epidemic in France and its implications for HIV screening strategies. AIDS. 2014;28(12):1797-804. https:// doi.org/10.1097/QAD.0000000000000270 PMID: 24681416 23. Dorrucci M, Regine V, Pezzotti P, Suligoi B, Mammone A,
Girardi E. “Stima della proporzione di inconsapevoli del rischio di HIV in Italia: analisi dei dati del sistema di sorveglianza HIV”. Approfondimenti in: Regine V, Pugliese L, Boros S, Santaquilani M, Ferri M, Suligoi B. Aggiornamento delle nuove diagnosi di infezione da HIV e dei casi di AIDS in Italia al 31 dicembre 2016. Not Ist Super Sanità. 2017; 30(9) Suppl 1:17-18. Available from: http://old.iss.it/publ/index. php?lang=1&id=3087&tipo=4
24. Clifton S, Nardone A, Field N, Mercer CH, Tanton C, Macdowall W, et al. HIV testing, risk perception, and behaviour in the British population. AIDS. 2016;30(6):943-52. https://doi. org/10.1097/QAD.0000000000001006 PMID: 26963528 25. Hall HI, An Q, Tang T, Song R, Chen M, Green T, et al.
Prevalence of Diagnosed and Undiagnosed HIV Infection--United States, 2008-2012. MMWR Morb Mortal Wkly Rep. 2015;64(24):657-62. PMID:26110835
26. Pharris A, Quinten C, Noori T, Amato-Gauci AJ, van Sighem AECDC HIV/AIDS Surveillance and Dublin Declaration Monitoring Networks. Estimating HIV incidence and number of undiagnosed individuals living with HIV in the European Union/European Economic Area, 2015. Euro Surveill. 2016;21(48):30417. https://doi.org/10.2807/1560-7917. ES.2016.21.48.30417 PMID: 27934585
27. Sonnenberg P, Clifton S, Beddows S, Field N, Soldan K, Tanton C, et al. Prevalence, risk factors, and uptake of interventions for sexually transmitted infections in Britain: findings from the National Surveys of Sexual Attitudes and Lifestyles (Natsal). Lancet. 2013;382(9907):1795-806. https://doi.org/10.1016/ S0140-6736(13)61947-9 PMID: 24286785
28. Fernàndez-López L, Reyes-Urueña J, Agustí C, Kustec T, Klavs I, Casabona C; COBATEST Network group. The COBATEST network: a platform to perform monitoring and evaluation of HIV community-based testing practices in Europe and conduct operational research. AIDS Care. 2016;28(sup1) Suppl 1;32-6. http://dx.doi.org/ https://doi.org/10.1080/09540121.2016.1146 218 PMID:26883807
29. Tao G, Hoover KW. Differences in access to healthcare and utilisation of HIV and sexually transmissible infection services between men who have sex with men and men who have sex only with women: results of the 2006-10 National Survey of Family Growth in the United States. Sex Health. 2013;10(4):363-8. https://doi.org/10.1071/SH13017 PMID: 23806743
30. Giuliani M, Vescio MF, Latini A, Palamara G, Pimpinelli F, Dona MG, et al. Continuous increase in HIV-1 incidence after the year 2000 among men who have sex with men in Rome: insights from a 25-year retrospective cohort study. Euro Surveill. 2014;19(47):20969. https://doi.org/10.2807/1560-7917. ES2014.19.47.20969 PMID: 25443035
31. Le Vu S, Le Strat Y, Barin F, Pillonel J, Cazein F, Bousquet V, et al. Population-based HIV-1 incidence in France, 2003-08: a modelling analysis. Lancet Infect Dis. 2010;10(10):682-7. https://doi.org/10.1016/S1473-3099(10)70167-5 PMID: 20832367
32. Meireles P, Lucas R, Carvalho C, Fuertes R, Brito J, Campos MJ, et al. Incident risk factors as predictors of HIV seroconversion in the Lisbon cohort of men who have sex with men: first results, 2011-2014. Euro Surveill. 2015;20(14):21091. https:// doi.org/10.2807/1560-7917.ES2015.20.14.21091 PMID: 25884151
33. Yin Z, Brown AE, Hughes G, Nardone A, Gill ON, Delpech VC, et al. HIV in the United Kingdom 2014 Report: data to end 2013. London: Public Health England. Nov 2014. Available from: https://www.gov.uk/government/uploads/system/uploads/ attachment_data/file/401662/2014_PHE_HIV_annual_report_ draft_Final_07-01-2015.pdf
34. Ferrer L, Furegato M, Foschia JP, Folch C, González V, Ramarli D, et al. Undiagnosed HIV infection in a population of MSM from six European cities: results from the Sialon project. Eur J Public Health. 2015;25(3):494-500. https://doi.org/10.1093/ eurpub/cku139 PMID: 25161202
35. Mirandola M, Gios L, Joanna Davis R, Furegato M, Breveglieri M, Folch C, et al. Socio-demographic factors predicting HIV test seeking behaviour among MSM in 6 EU cities. Eur J Public Health. 2017;27(2):313-8. https://doi.org/10.1093/eurpub/ ckw144 PMID: 27615734
36. Ndawinz JD, Costagliola D, Supervie V. New method for estimating HIV incidence and time from infection to diagnosis using HIV surveillance data: results for France. AIDS. 2011;25(15):1905-13. https://doi.org/10.1097/ QAD.0b013e32834af619 PMID: 21811147
37. Mammone A, Pezzotti P, Camoni L, Regine V, Raimondo M, Dorrucci M, et al. Time from infection with HIV to diagnosis in Italy: an estimate using surveillance data. Oral presentation. Proceedings of the 8th Italian Conference on AIDS and antiviral research (ICAR); 2016 Jun 6-8; Milan, Italy.
38. Song R, Hall HI, Green TA, Szwarcwald CL, Pantazis N. Using CD4 Data to Estimate HIV Incidence, Prevalence, and Percent of Undiagnosed Infections in the United States. J Acquir Immune Defic Syndr. 2017;74(1):3-9. https://doi.org/10.1097/ QAI.0000000000001151 PMID: 27509244
39. European Centre for Disease Prevention and Control. Antenatal screening for HIV, hepatitis B, syphilis and rubella susceptibility in the EU/EEA. Stockholm: ECDC; 2016. Available from: http://ecdc.europa.eu/en/publications/Publications/ antenatal-screening-HIV-hepatitis-B-syphilis-rubella-EU.pdf 40. Camoni L, Raimondo M, Urciuoli R, Iacchini S, Suligoi B,
Pezzotti P, et al. [People living with HIV in Italy: data from the second census]. Not Ist Super Sanità. 2017; 30(1). Italian. Available from: http://www.iss.it/binary/publ/cont/ONLINE_ GENNAIO.pdf
License and copyright
This is an open-access article distributed under the terms of the Creative Commons Attribution (CC BY 4.0) Licence. You may share and adapt the material, but must give appropriate credit to the source, provide a link to the licence, and indi-cate if changes were made.