http://dx.doi.org/10.12988/ces.2016.68140
Integrated Pyro-Gasification Process of
Heterogeneous Mediterranean Wood Species
Martino Negri and Marco Fellin
CNR IVALSA Via Biasi 75, 38010 San Michele a/A (TN), Italy
Vincenzo Carè
Agricola Faggitello, (RC) Italy
Andrea R. Proto
Department of Agraria Mediterranean University
Reggio Calabria, Italy
Copyright © 2016 Martino Negri et al. This article is distributed under the Creative Commons Attribution License, which permits unrestricted use, distribution, and reproduction in any medium, provided the original work is properly cited.
Abstract
Within the framework of the PSR 2014 Regione Calabria “Energia Slow” project the pyro-gasification process of various wood species was held in a micro-co-generation plant able to transform the chipped wood into 45 kW electric power. The whole process from timber felling and harvesting to chipping, drying, gasifying and feeding the generator engine was managed by the same agroforestry enterprise; the main steps of the process has been monitored and measured.
Keywords: Wood pyro-gasification, environmental impact of wood gasification,
forestry biomass exploitation
1 Introduction
The exploitation of locally produced biomass for heating and energy production is a growing trend in many EU countries, encouraged and granted by the regional policies often developed within EU framework [1, 5, 6]. A wide variety of plants
are now available exploiting various biomasses (wooden chips, agricultural stocks, industrial residues and waste), different technologies (from steam turbines to organic Rankine cycle) and power sizes (domestic micro-cogeneration to large industrial plants) [19]. Even if the present technologies are able to control the environmental impact, some concerns are still to be considered using the biomass [12, 13, 14]. As many transformation processes some gaseous emissions in atmosphere or residues (ashes, char, tar, particulate) are expected. This work describes the impact of a micro-cogeneration plant based on the transformation of dried wooden chips into syngas (wood gas); the syngas is then transformed via Otto cycle engine into thermal energy and electric power (45 kW). The properties of wooden chips, the quality of syngas, the amount of particulate and the concentration of exhaust emissions describe the environmental impact of the whole transformation chain. This project set up a partnership between forest enterprises, CNR-IVALSA Institute and University of Reggio Calabria (Department of Agriculture) in the Calabria region to improve the economic output of local biomass and support sustainable agroforestry management.
1.1 Local framework
The study has been held in cooperation with a couple of agro-forestry enterprises, Agricola Faggitello and Gorna, both located close to the village of San Pietro in Caridà (325 m msl), a municipality in the Province of Reggio Calabria in the Italian region Calabria, located about 60 kilometers southwest of Catanzaro and about 60 kilometers northeast of Reggio Calabria. The two enterprises recently acquired two wood gasifiers Spanner Wood Power System HK45 produced by Spanner Re2 GmbH, Neufahrm (D) in order to use the underexploited broadleaves forests nearby. As a consequence of the past forest management the woodland is characterized by the presence of beech (Fagus sylvatica L.). The structures are very heterogeneous either because of management implemented in the past, either for the different ecological conditions of the different areas, especially concerning the characteristics of the soil. In addition to the beech forest, there are also natural populations of black alder (Alnus glutinosa (L.) Gaertn.) and Italian alder (Alnus cordata Desf.), deriving from recent artificial plantations.
2 Material and methods
A sampling plan for the characterization of biomass for energy production must meet the following requirements:
have the ability to represent the salient features of the biomass
identify the relevant characteristics for the purpose of energy production indicate what information is available in the literature
indicate and related to certain standards according to the sampling plan respect the rules of statistics
comply with the principles of technical standards available
This sampling plan followed the principles of the European Standard EN 14778
dimensi-ons. To that end, appropriate adjustments were adopted to calibrate the use of the small size of the plant.
The pyrogasification plant in question required a feeding of 45 kg of biomass / hour, and a continued process time not greater than 8,000 hours / year.
The identified biomass is represented by wood chips harvested in the woodlands of Azienda Faggitello; the biomass is homogeneous and constant over time. The total annual requirement is less than 360 tons, which therefore forms less than 2500 tons value representing the mass threshold that defines the number of samples greater than one, according to EN 14778 [3].
Being within the threshold of 2500 t / year in the case in question is carried out only one sample / year. The number of lots and portions is a consequence of primary variance of the portion, the overall accuracy of the sampling and the variance of the sample preparation and measurement. For wood chips in question, the above variables are defined by the standard, as follows:
primary portion of the variance = 1 overall accuracy of the sample = 12.5
variance of the sample preparation and measurement = 0.059
The empirical values of primary variance of the portion, the overall accuracy of the sampling, sample preparation and measures for the total batch of biofuel, at 95% confidence level and variance of the sample preparation and measurement may initially be taken from the tables D.1-D.10 of the UNI EN 14778: 2011 [3].
2.1 Biomass characterization
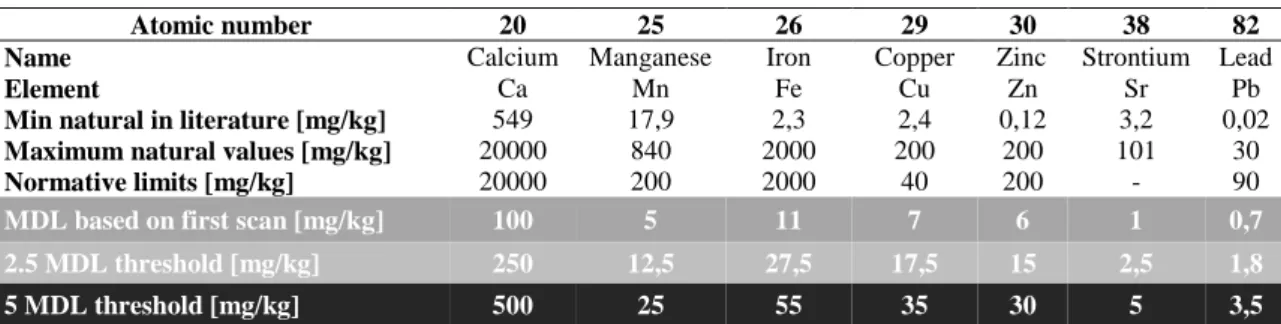
One of the most popular feature tested on wooden biomasses is the heating value (Lower Heating Value, LHV), since it describes the power content of the (bio) fuel per unit of mass. But since the power content of wooden biomass is mainly dependent on the moisture content (normally very variable) and slightly dependent on the different LHV of the wood species, we focused our attention to the properties affecting the usability of the biochar (the mail by-products) [1, 15, 19], i.e. the metal contents. The heavy metal content of biochar (and ashes) is strictly related to the heavy metal content of wood and bark. The heavy metals detection on wood has been performed with a handheld ED-XRF (X-Ray Fluorescence Energy Dispersion) device. It allows analyzes of the chemical elements with atomic number higher than 12 (Magnesium) with good accuracy and speed. The instrument used is the Oxford Instruments X-MET 5100; the wood tailored analysis methods has been developed in-house [7, 8, 9, 10, 11, 16]. The chemical elements present in the fuels were measured using a measurement time of 300 s. The following table shows the indicative reference values for wood material, regarding the concentrations commonly found in nature, the law limits / rules, and the minimum detection limits (MDL). In order to be sure of the presence of the chemical element it is necessary to use a security multiplier of the MDL, in order to be sure to distinguish signal from noise. For this reason we are presented with two thresholds (threshold) corresponding to a multiplication of 2.5 and 5 times the MDL.
Atomic number 20 25 26 29 30 38 82
Name Calcium Manganese Iron Copper Zinc Strontium Lead
Element Ca Mn Fe Cu Zn Sr Pb
Min natural in literature [mg/kg] 549 17,9 2,3 2,4 0,12 3,2 0,02
Maximum natural values [mg/kg] 20000 840 2000 200 200 101 30
Normative limits [mg/kg] 20000 200 2000 40 200 - 90
MDL based on first scan [mg/kg] 100 5 11 7 6 1 0,7
2.5 MDL threshold [mg/kg] 250 12,5 27,5 17,5 15 2,5 1,8
5 MDL threshold [mg/kg] 500 25 55 35 30 5 3,5
Table 1: concentrations commonly found in nature, the law limits / rules, and the minimum detection limits (MDL)
2.2 Syngas quality
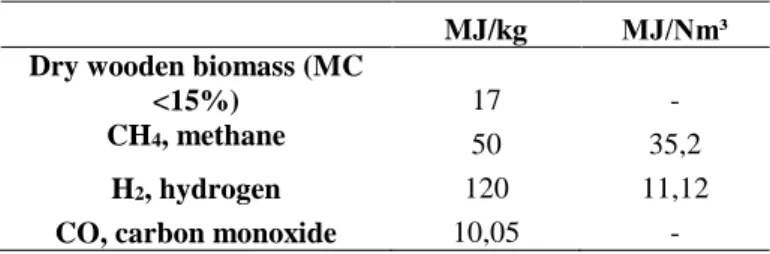
The chemical composition of the syngas is variable depending on the gasification process and the biomass type. In principle, the syngas is formed from hydrogen (10-18%), methane (1-4%), carbon monoxide (12-20%), oxygen (2-5%), carbon dioxide (10-12%) and nitrogen (50%). The syngas produced is used with some key technologies, widespread and widely tested. The technology of simple handling is the use of the syngas to feed an internal combustion engine that produces electrical energy through an alternator. The measuring instrument of the syngas provides results as the chemical composition of the syngas, expressed as a percentage, and the total calorific value of the mixture. In order to assess the contribution that each of the mixture fuel gas (H2, CH4, CO) brings the total calorific value, it was necessary to develop a computational model. Using this model, it is possible to calculate the exact contribution of each gas to the total calorific value, and this is of fundamental help for the stage set-up of the gasifier. The constant input of the model are:
1) The atomic masses of elements and molecules of gas; 2) Lower heating value of gas.
Molecules Molecular mass
H2 2.0159 g / mol CO 28.0101 g / mol CH4 16.0425 g / mol N2 28.0200 g / mol CO2 44.0095 g / mol O2 31.9988 g / mol
MJ/kg MJ/Nm³ Dry wooden biomass (MC
<15%) 17 -
CH4, methane 50 35,2
H2, hydrogen 120 11,12
CO, carbon monoxide 10,05 -
Table 3: LHV, lower heating value of considered gas
The analyzer used is a MRU Varioplus Syngas model, equipped with O2 sensor Long Life electrochemical sensors CO / CO2 / CH4 NDIR (infrared bench) and H2 sensor TCD (thermal conductivity). The technical features are: detection limit 0.05%, linearity error 1%, repeatability 1% zero drift negligible, drift span 2%. To prevent damage to the IR bench we have provided a system for filtering through a wet stage (bubbler water), one condensation step, one oil bubbler, a condensation lung diesel, two cotton filters and one of the final expansion stage. The gas arrives to the sensor free of tarry residues and other impurities.
2.3 Particulate matter
Atmospheric particulate matter, also known as particulate matter or particulates, are microscopic solid or liquid matter suspended in the atmosphere. Sources of particulate matter can be either natural or artificially produced by the human activities. The particulate matter have impacts on climate and precipitation, and can affect human health. The particulate matter include [17]:
Suspended particulate matter (SPM); Thoracic and respirable particles;
Inhalable coarse particle, with a diameter between 2.5 and 10 μm; Fine particles with a diameter of 2.5 μm or less;
PM2.5; PM10;
Ultrafine particles, and soot.
The IARC and WHO designate airborne particulates a Group 1 carcinogen. The system for the measurement of the particulates is TSI AeroTrak 9306 Handheld Particle Counter, which operates by the principle of laser scatter. It is able to measure the number of particles (count) divided into six diameter classes, between 0.3 and 10 m (the so-called PM10). The measures have sampled an air volume of 10 l over a sampling period of 3'33 "(213 s). The counting of the laser scatter has been then converted into mass over volume (g/m3), applying a bulk density of the particulate matter 1 g/cm3 over a nominal volume of each dimensional class [17].
2.4 Exhaust emission
The flue gas analyzer is an analyzer Handheld Industrial MRU Optima 7, in accordance with EN 50379-1. The instrument is equipped with an electrochemical sensors for O2, CO, NO, NO2, NOx, SO2, temperature and fume velocity. In conjunction with measurements of emissions were carried out velocity measurements of the smoke through Pitot tube.
3 Results
3.1 Biomass characterization
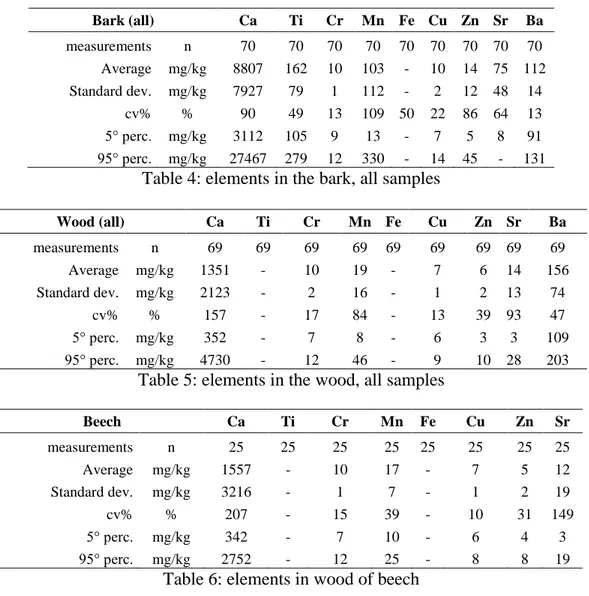
The results of the analysis of heavy metals show a greater presence and concentration of metals in the cortex compared to wood. This is a natural phenomenon linked to the formation and growth of the cortex. The concentrations of the detected elements both in the wood cortex indicate the absence of external contaminants. The following tables report all the Calabrian samples.
Bark (all) Ca Ti Cr Mn Fe Cu Zn Sr Ba measurements n 70 70 70 70 70 70 70 70 70 Average mg/kg 8807 162 10 103 - 10 14 75 112 Standard dev. mg/kg 7927 79 1 112 - 2 12 48 14 cv% % 90 49 13 109 50 22 86 64 13 5° perc. mg/kg 3112 105 9 13 - 7 5 8 91 95° perc. mg/kg 27467 279 12 330 - 14 45 - 131 Table 4: elements in the bark, all samples
Wood (all) Ca Ti Cr Mn Fe Cu Zn Sr Ba measurements n 69 69 69 69 69 69 69 69 69 Average mg/kg 1351 - 10 19 - 7 6 14 156 Standard dev. mg/kg 2123 - 2 16 - 1 2 13 74 cv% % 157 - 17 84 - 13 39 93 47 5° perc. mg/kg 352 - 7 8 - 6 3 3 109 95° perc. mg/kg 4730 - 12 46 - 9 10 28 203
Table 5: elements in the wood, all samples
Beech Ca Ti Cr Mn Fe Cu Zn Sr measurements n 25 25 25 25 25 25 25 25 Average mg/kg 1557 - 10 17 - 7 5 12 Standard dev. mg/kg 3216 - 1 7 - 1 2 19 cv% % 207 - 15 39 - 10 31 149 5° perc. mg/kg 342 - 7 10 - 6 4 3 95° perc. mg/kg 2752 - 12 25 - 8 8 19
Alder Ca Ti Cr Mn Fe Cu Zn Sr measurements n 6 6 6 6 6 6 6 6 Average mg/kg 537 - 11 12 - 8 7 13 Standard dev. mg/kg 104 - 1 2 - 1 1 2 cv% % 19 - 5 14 - 10 19 16 5° perc. mg/kg 413 - 10 10 - 7 6 11 95° perc. mg/kg 651 - 11 15 - 9 9 16
Table 7: elements in wood of alder
3.2 Syngas quality
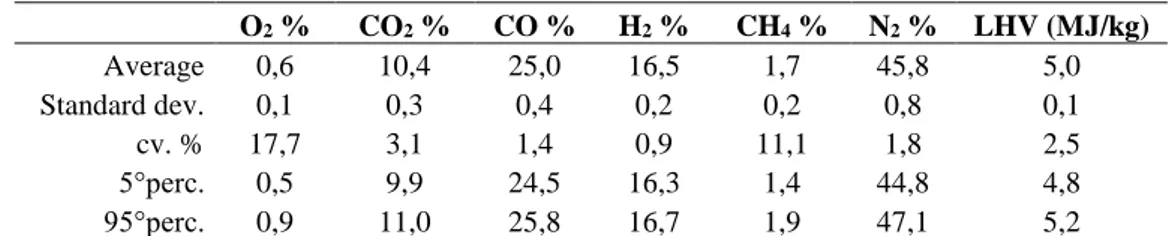
The tests provided information on the behavior of the plant performances. The table shows the following chemical concentration of the syngas and its calorific value calculated, reported as average values for the entire period of measurement and performance as a function of time. The LHV is 5 MJ / kg.
O2 % CO2 % CO % H2 % CH4 % N2 % LHV (MJ/kg) Average 0,6 10,4 25,0 16,5 1,7 45,8 5,0 Standard dev. 0,1 0,3 0,4 0,2 0,2 0,8 0,1 cv. % 17,7 3,1 1,4 0,9 11,1 1,8 2,5 5°perc. 0,5 9,9 24,5 16,3 1,4 44,8 4,8 95°perc. 0,9 11,0 25,8 16,7 1,9 47,1 5,2
Table 8: composition of the syngas measured with MRU Vario Plus-Syngas 1
Looking at the Standard Deviation values in relationship with the average values, the plants monitored in Agricola Faggitello and Gorna show an exceptional stability along the time in the syngas composition, producing high quality syngas with a high and constant Lower Heating Value.
3.3 Particulate matter
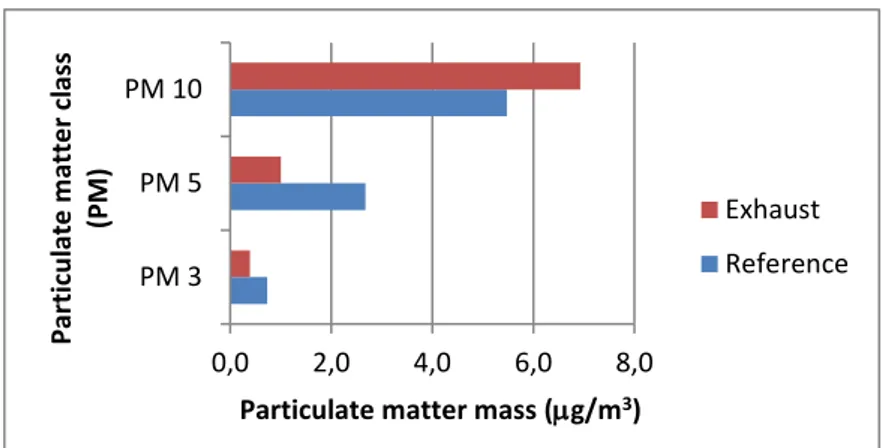
The particulate matter has been measured either in close environment far from the plants, reported as reference for the area, and close to exhaust. According to the Figures 1 and 2 the difference between the reference values of each class (PM 10; 5; 3; 1; 0.5 and 0.3) are slightly different, being in some cases the close to exhaust measurements lower than the reference.
Fig. 1: Particulate matter classes PM 10, PM 5 and PM 3
Fig. 2: Particulate matter classes PM 1, PM 0.5 and PM 0.3
In the following table the comparison with some reference values provides the impact of particulate matter produced by the gasifier plant.
Reference values for PM 10 class µg/m³
Maximum value for the annual average * 40
Daily maximum value (24-hours) * 50
Reference value for urban environment ** 30
Maximum measured value close to exhaust of gasifier 7
* PM 10 Law thresholds (Italian law Dec. Lgs 155/2010)
** APPA – Environmental Agency of Trento, 632 measurements sampled on March 3-5 2012, via Brennero, Trento (IT)
Table 9: reference values of PM10 concentration
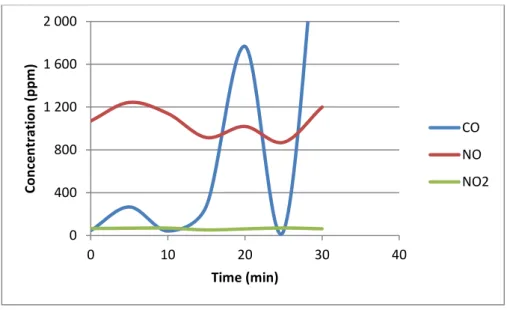
3.3 Exhaust emission
The exhaust emissions here considered are the nitrogen oxides (NO and NO2) and the carbon monoxide. The Nitrogen oxides showed a quite constant behavior along the time.
0,0 2,0 4,0 6,0 8,0
PM 3 PM 5 PM 10
Particulate matter mass (g/m3)
Par ticu late m att e r cl ass (PM ) Exhaust Reference 0,0 0,2 0,4 0,6 0,8 1,0 PM 0,3 PM 0,5 PM 1
Particulate matter mass (g/m3)
Par ticu late m att e r cl ass (PM ) Exhaust Reference
The carbon monoxide is supposed to be (completely) burned by the engine. Since from time to time huge “bubbles” of carbon monoxides are released in the atmosphere, the burning process of the engine should be verified, and the engine efficiency in exploiting all the biofuel should be monitored
Fig. 3: Averaged emissions of the two plants along the time
4. Conclusions
The case studies described in this paper show that all aspects of biomass supply chain are evolving. The role of biomass as a renewable source of energy is encouraging an increasing interest in environmental, social and economic issues. Thanks to this project many agroforest farms have diversified their forest production, starting in some cases also bio-energy production, and they have introduced more sustainable management practices, ensuring a better preservation of biodiversity [18]. The properties of wooden chips, the quality of syngas, the amount of particulate and the concentration of exhaust emissions have been successfully monitored in a real case pyrogasification plant integrated in two agro-forestry enterprises. The resulted low environmental impact of the whole transformation chain encourages the use of these plants in agro-forestry contexts.
Acknowledgements. This study is a part of the Project ENERGIA SLOw– n°
94752193691. This is a regional project funded by PSR Calabria 2007- 2013 (Calabria’s Rural Development Programme) under Project Action 124: “Cooperation for development of new products, processes and technologies in the agriculture and food sector and the forestry sector.”
0 400 800 1 200 1 600 2 000 0 10 20 30 40 Co n ce n tr ation (p p m ) Time (min) CO NO NO2
References
[1] A. Colantoni, N. Evic, R. Lord S. Retschitzegger, A.R. Proto, F.Gallucci, D. Monarca, Characterization of biochars produced from pyrolysis of pelletized agricultural residues, Renewable and Sustainable Energy Reviews, 64 (2016), 187–194. http://dx.doi.org/10.1016/j.rser.2016.06.003
[2] EN 14774-2: 2010, Solid biofuels, Determination of moisture content - Oven dry method, Part 2: Total moisture - Simplified method, CEN, European Committee for Standardization, rue de Stassart, 36 - B-1050 Bruxelles. [3] EN 14778: 2011, Solid biofuels, Sampling. CEN, European Committee for
Standardization, rue de Stassart, 36 - B-1050 Bruxelles.
[4] EN 15234:2011, Solid biofuels, Fuel quality assurance, CEN, European Committee for Standardization, rue de Stassart, 36 - B-1050 Bruxelles. [5] ENER/C1/427-2012 on ‘Carbon impacts of biomass consumed in the EU’ [6] EUBCE 2016 Amsterdam 6-9 June 2016 Bioenergy integrated in the
bio-based economy crucial to meet climate targets.
[7] M. Fellin and M. Negri, Monitoring Pollutants in biomass using FT-IR-ATR technology, in Proc. of 19th European Biomass Conference and Exhibition, Berlin, Germany, (2011), 320 – 327.
[8] Fellin, M., Negri, M. & Zanuttini, R. (2013a). X-ray fluorescence as a tool for wood ecology, in Proc. of ISCHP International Scientific Conference on Hardwood Processing, (2013), Florence, Italy, 322-326.
[9] M. Fellin, M. Negri, R. Zanuttini, Multi-elemental analysis of wood waste using Energy Dispersive X-Ray Fluorescence (ED-XRF) analyzer, European Journal of Wood and Wood Products, 72 (2013), no. 2, 199-211.
http://dx.doi.org/10.1007/s00107-013-0766-4
[10] M. Fellin, M. Negri, R. Zanuttini and F. Maffei, Characterization of ED-XRF technology applied to wood matrix, Wood Research, 59 (2013), no. 4, 533-546.
[11] M. Fellin, R. Zanuttini and M. Negri, Monitoring wooden materials for recycling, PhD Thesis, Università di Torino, CNR-IVALSA, (2014), 182 ISBN: 9788890927317, DOI: 10.13140/2.1.1460.5128
[12] P. McKendry, Energy production from biomass (part 1): overview of biomass, Bioresource Technology, 83 (2002), no. 1, 37-46,
http://dx.doi.org/10.1016/S0960-8524(01)00118-3
[13] P. McKendry, Energy production from biomass (part 2): conversion technologies, Bioresource Technology, 83 (2002), no. 1, 47-54.
http://dx.doi.org/10.1016/S0960-8524(01)00119-5
[14] P. McKendry, Energy production from biomass (part 3): gasification technologies, Bioresource Technology, 83 (2002), no. 1, 55-63.
[15] M. Moneti, L. M. P. Delfanti, A. Marucci, R. Bedini, F. Gambella, A. R. Proto, F. Gallucci, Simulations of a plant with a fluidized bed gasifier WGS and PSA, Contemporary Engineering Sciences, 8 (2015), no. 31, 1461-1473. http://dx.doi.org/10.12988/ces.2015.56191
[16] M. Negri, M. Fellin, Experimental survey with X-ray Fluorescence for multi-elemental analysis of biomasses from recovered wood, in Proc. of BIT’s 3rd annual World Congress of Bioenergy, (2013), Nanjing, China, 525.
[17] A.R. Proto, G. Zimbalatti, M. Negri, The Measurement and Distribution of Wood Dust, Journal of Agricultural Engineering, 1 (2010), 25-32.
http://dx.doi.org/10.4081/jae.2010.1.25
[18] A. R. Proto, G. Zimbalatti, L. Abenavoli, B. Bernardi and S. Benalia, Biomass Production in Agroforestry Systems: V.E.Ri.For Project, Advanced Engineering Forum, 11 (2014), 58–63.
http://doi.org/10.4028/www.scientific.net/AEF.11.58
[19] I. Zambon, F. Colosimo, D. Monarca et al., An Innovative Agro-Forestry Supply Chain for Residual Biomass: Physicochemical Characterisation of Biochar from Olive and Hazelnut Pellets, Energies, 9 (2016), no. 7, 526.