DOI:10.1051/0004-6361/201730869 c ESO 2017
Astronomy
&
Astrophysics
Swift J164449.3+573451 and Swift J2058.4+0516: Black hole mass
estimates for tidal disruption event sources
Elena Seifina
1, 2, Lev Titarchuk
3, 4, and Enrico Virgilli
31 LAPTh, 74941 Annecy-le-Vieux, France
e-mail: [email protected]
2 Lomonosov Moscow State University/Sternberg Astronomical Institute, Universitetsky Prospect 13, 119992 Moscow, Russia
e-mail: [email protected]
3 Dipartimento di Fisica, Università di Ferrara, via Saragat 1, 44122 Ferrara, Italy
e-mail: [titarchuk;virgilli]@fe.infn.it
4 National Research Nuclear University, MEPhI (Moscow Engineering Physics Institute), Moscow, Russia
Received 25 March 2017/ Accepted 7 July 2017
ABSTRACT
A tidal disruption event (TDE) is an astronomical phenomenon in which a previously dormant black hole (BH) destroys a star passing too close to its central part. We analyzed the flaring episode detected from the TDE sources, Swift J164449.3+573451 and SwiftJ2058.4+0516 (hereafter Swift J1644+57 and Swift J2058+05, respectively) using RXTE, Swift and Suzaku data. The spectra are well fitted by the so called Bulk Motion Comptonization model for which the best-fit photon indexΓ varies from 1.1 to 1.8. We have firmly established the saturation of the photon index versus mass accretion rate atΓsatabout 1.7–1.8. The saturation ofΓ is
usually identified as a signature of a BH now established in Swift J1644+57 and Swift J2058+05. In Swift J1644+57 we found the relatively lowΓsatvalues which indicate a high electron (plasma) temperature, kTe ∼ 30–40 keV. This is also consistent with high
cutoff energies, Ecut ∼ 60–80 keV found using best fits of the RXTE spectra. Swift J2058+05 shows a lower electron temperature,
kTe ∼ 4–10 keV than that for Swift J1644+57. For the BH mass estimate we used the scaling technique taking the Galactic BHs,
GRO J1655–40, GX 339–4, Cyg X–1 and 4U 1543–47 as reference sources and found that the BH mass in Swift J1644+57 is MBH≥ 7 × 10⁶ M assuming the distance to this source of 1.5 Gpc. For Swift J2058+05 we obtain MBH ≥ 2 × 10⁷ M assuming the
distance to this source of 3.7 Gpc. We have also found that the seed (disk) photon temperatures are quite low, of order of 100–400 eV, in both of the sources, which are consistent with the estimated BH masses.
Key words. accretion, accretion disks – galaxies: individual: Swift J164449.3+573451 – galaxies: individual: Swift J2058.4+0516 – galaxies: general – radiation mechanisms: general – black hole physics
1. Introduction
Rees (1988, hereafter R88), suggested that among bright X-ray flares that continue for a few years, some can be caused by tidal gravitational disruption of a star which passed too close to a su-per massive black hole (SMBH). If a star passes within the tidal radius of a black hole then the gravity rips the star apart (R88). As the stellar remnant approaches a black hole (BH), its gravi-tational potential energy is converted into heat through viscous effects. Some of the debris can be ejected, while the remaining part can be ingested by a central SMBH. In this case the accre-tion flow reaches a temperature of about 105K and emits brightly at optical, ultraviolet, and X-ray wavelengths during the period from about 100 days to a few years.Komossa(2015) described observational appearances of these events in detail.
Swift164449.3+573451 (hereafter Swift J1644+57) was ini-tially discovered as a γ-ray burst (GRB) event. The Swift Burst Alert Telescope (BAT, 15–150 keV) detected a new uncataloged source on 2011 March 28. Because the source was assumed to be a GRB, it was named as GRB 110328A. However, this first detection was also followed by three additional flares with a sub-sequent increase of the count rate over the next two days and thus, it was recognized that this object was not a GRB. Now, the name of the source, Swift J1644+57 based on the initial position of its X-ray counterpart is commonly used.
SwiftJ1644+57 is also characterized by the long duration of the X-ray outburst (with a power-law decay ∝t−5/2) and specific flaring events. We also note that the spatial coincidence of it with the central nucleus of a galaxy at redshift 0.354 (the luminos-ity distance, 1.5 Gpc, see Levan et al.2011) indicates that this source was not a GRB, but associated with an accretion event in the close vicinity of a SMBH (see also Bloom et al. 2011; Burrows et al.2011).
We should emphasize that this TDE phenomenon is only occasionally observed and therefore is poorly studied. Further-more, there are no direct measurements of the mass, MBH of
a dormant BH except of our Galactic center black hole. In the Swift J1644+57 case the optical emission lines imply that the host object is not an active galactic nucleus (AGN), but a HII-type galaxy. Variable emission was also detected in the near-IR and was not detected in the optical band (possibly due to the excess of extinction in the optical spectrum). Various esti-mates of a BH mass, based on the rapid variability timescale, all give that 107 < MBH < 109 M . This indirect constraints
provide only an upper limit to the BH mass (see R88), for ex-ample, a minimum variability time of ∼100 s that sets an upper limit to the light-crossing time (Bloom et al.2011; Burrows et al. 2011; Liang & Liu2003) and well-known empirical relations be-tween MBHand the host galaxy environment (Silk & Rees1998;
host galaxy, Levan et al. (2011) evaluated a spheroidal mass, Msph ∼ 109−1010 M . Using the log-linear spheroidal mass and
the BH mass relation of Bennert et al. (2011), Levan et al. found that likely a BH mass within 2×10⁶≤ M
BH≤ 107M taking into
account the relation by Graham (2012) instead of the relation, Msph− MBH. The latter relation also provides a lower range of
BH masses, 105M
≤ MBH≤ 107 M which is more consistent
with the BH mass, log(MBH/M )= 5.5±1.1 estimated by Miller
& Gultekin (2011), based on empirical, so called fundamental plane relations between radio and X-ray luminosities of accret-ing BHs. Many subsequent observations of Swift J1644+57 have been performed at all wavelengths (X-rays: Mangano et al.2016; Gonzalez-Rodriguez2014; Castro-Tirado et al.2013; Zauderer et al.2013; Saxton et al.2012; Reis et al.2012; radio: Cendes et al. 2014; Zauderer et al. 2013; Berger et al. 2012; IR and radio polarimetry: Wiersema et al. 2012). Aliu et al. (2011). Aleksic et al. (2013) reported non-detections of Swift J1644+57 using MAGIC and VERITAS for energies greater 100 GeV. Evidence for quasi-periodical oscillations (QPOs) in the X-ray power spectrum of Swift J1644+57 with a period of ∼200 s in X-rays was suggested by Reis et al. (2012) and Saxton et al. (2012). In contrast to the long-term X-ray lightcurve, the radio emission of Swift J1644+57 continued to rise (Zauderer et al. 2013; Berger et al.2012).
The Swift X-ray lightcurve of Swift J1644+57 decreased and then (at 507th day from the discovery) showed a sudden drop by a factor of ∼200, that is, it was no longer detectable with Swiftbut only detectable by Chandra (Zauderer et al.2013) and XMM-Newton in longer time pointings (Gonzalez-Rodriguez et al.2014). A second event very similar to Swift J1644+57 was discovered by the Swift/BAT on May 27, 2011 (Krimm et al. 2011) from Swift J2058+0516, hereafter Swift J2058+05. This TDE source is located at a higher redshift, 1.186 (Komossa 2015; Cenko et al. 2012).
The evidence for a possible TDE in Swift J2058+05 was reported by Cenko et al. (2012) who showed that this source demonstrated a luminous, long-term X-ray outburst with a peak luminosity of Lx ∼ 3 × 1047 erg/s. The event was also
accom-panied by a strong radio emission (Pasham et al. 2015). The as-sociated host galaxy of Swift J2058+05 was optically inactive. Because of the many similarities between Swift 2058+05 and Swift J1644+57, Cenko et al. (2012) suggested that a similar outburst mechanism is consistent with multi-wavelength follow-up observations (Pasham et al. 2015). The X-ray lightcurve of SwiftJ2058+05 is similar to that of Swift J1644+57 which shows an abrupt drop after 250–300 days since the initial outburst. Be-cause of rapid variability of the X-rays before the drop, an origin was associated with the vicinity of SMBH rather than with the forward shock location (Pasham et al.2015).
The BH mass limits of Swift J2058+05 were derived based on the X-ray turnoff (104 M
≤ MBH ≤ 2 × 10⁶ M , as well as
using the BH mass upper limit estimate method of applying the X-ray variability timescale, 5 × 10⁷M
(see Pasham et al.2015).
Furthermore, Pasham et al. (2015) assumed that the TDE source optical flux is dominated by the host galaxy and they constrained the BH mass of the central SMBH using the well-known bulge luminosity as a function of BH mass relations (e.g., Lauer et al. 2007). As a result they inferred the SMBH mass of about MBH≤
3 × 10⁷M .
It is desirable to have an independent BH identification for its central object as well as the BH mass determina-tion by an alternative to the aforemendetermina-tioned methods, based on luminosity and minimal variability time estimates only. A method of the BH mass determination was developed by
Shaposhnikov & Titarchuk (2009, hereafter ST09), using a cor-relation scaling between X-ray spectral and timing (or mass ac-cretion rate) properties observed for many Galactic BH binaries during their spectral state transitions.
The origin of the X-ray emission in TDE is still unclear. However, this is for Swift J1644+57, there are two, well de-tected, prominent peaks in the spectral energy distribution: one in the far-infrared and another in the hard X-ray band (Bloom et al.2011; Burrows et al.2011). They can be modeled as a di-rect synchrotron emission (single-component model) from radio to X-rays, with strong dust extinction in the optical and ultravi-olet bands. Alternatively, the radio and IR peaks are related to the synchrotron emission and the X-ray peak is due to inverse Compton scattering of external photons, most likely disk pho-tons (two-component blazar model). Another possibility is that the X-ray emission is due to the inverse Compton emission at the base of the jet, while radio and IR synchrotron emission comes from the forward shock at the interface between the head of the jet and the interstellar medium (Bloom et al.2011).
The goal of the present study is to investigate the peak in X-ray observational data from Swift J1644+57 and Swift J2058+05 and to infer their fundamental observa-tional characteristics. In particular, the soft X-ray spectrum of Swift J1644+57 was fitted by a simple absorbed power law, although more complex spectral models were also discussed (Burrows et al.2011; Saxton et al.2012). An average photon index during the first year was Γ ∼ 1.8 (Burrows et al.2011; Levan et al. 2011). However, the physical meaning of this av-erage value has to be interpreted more carefully, as there were strong variations in hardness and in the photon index between flares, with a change betweenΓ ≈ 1.3 and 3 (Levan et al.2011). In particular, the photon index was harder when the source was brighter (Burrows et al.2011; Kennea et al.2011; Levan et al. 2011).
Our main goal in the present study is the full analysis of the Swift/XRT follow-up data of Swift J1644+57 from the beginning to the end of the 2011–2012 outburst and Swift J2058+05 during 2011 outburst decay. We present spectral analysis and interpreta-tion of RXTE, Swift and Suzaku data of the sources. In Sect. 2 we show the list of observations used in our analysis, while in Sect. 3 we provide details of X-ray spectral fittings. We discuss an evo-lution of the X-ray spectral properties during the high-low state transitions in Sect. 4 and demonstrate the results of the scaling analysis, in order to estimate BH masses of Swift J1644+57 and SwiftJ2058+05 in Sect. 5. We make our conclusions in Sect. 6.
2. Observations and data reduction
SwiftJ1644+57 was observed by Suzaku during April 6, 2011 and May 17, 2012 (see Sect. 2.1) along with the short-term RXTE observations on March 30–31, 2011 which we describe in Sect.2.2and by Swift during the period of 2011–2016 (see Sect.2.3). The RXTE data (three observations) are related to the peak burst phase and probe harder X-ray energies (3–100 keV). In contrast, the well-exposed Suzaku data are very advantageous in determining low-energy photoelectric absorption, which is presumably not associated with the source directly.
Short-term RXTE observations of of Swift J2058+05 on June 1, 2011 are described in Sect.2.2. We also used publicly available data by the Swift Observatory obtained from May 27, 2011 to December 7, 2011 (see Sect.2.3). We extracted these data from the HEASARC archives and found that the Swift data cover the decay phase of X-ray outburst for Swift J1644+57 and Swift2058+05, as well as partly, catch the peak burst interval.
Table 1. List of the Suzaku observations of Swift J1644+57 in the 0.3–10 keV range used in our analysis.
Number of set Obs. ID Start time (UT) End time (UT) MJD interval Mean count rate (cts/s) Sz1 ... 9060010101 2011 April 6 02:24:43 2011 April 7 00:32:17 55 657.1–55 658.0 4.59 ± 0.03
Sz2 ... 7070180101 2012 May 17 17:30:38 2012 May 19 01:15:11 56 064.7–56 066.1 0.032 ± 0.001
References.(1)Usui & Kawai (2015).
Table 2. List of the RXTE observations of Swift J1644+57 and Swift J2058+05.
Source Number Obs. ID Start time (UT) End time (UT) MJD interval
of set
Sw J1644+57 R1 ... 96424-01-01-00 2011 March 30 04:53:04 2011 March 30 05:26:56 55 650.20–55 650.27 R2 ... 96424-01-01-01 2011 March 31 02:51:12 2011 March 31 04:09:36 55 651.11–55 651.17 R3 ... 96424-01-01-02 2011 March 31 04:39:12 2011 March 31 04:57:04 55 651.19–55 651.21 Sw J2058+05 R4 ... 96431-01-01-00 2011 June 1 01:45:36 2011 June 1 02:12:00 55 713.07–55 713.09
A summary of the X-ray observations analyzed in this work is given in Tables 1−3.
2.1. Suzaku
We studied the TDE source, Swift J1644+57 using the Suzaku data, for April 6 of 2011 and May 17 of 2012 observations (see Table1). These particular observations correspond to nine and 416 days after the source discovery. We used HEASOFT software package (version 6.13) and calibration database (CALDB) released on February 10, 2012 for XIS. Since back-ground is dominant in the lower energy band, we used photons in the 1–10 keV (for XIS0, and 3) and 1–7 keV (for XIS 1) en-ergy bands.
The data reduction and spectral analysis are performed fol-lowing the Suzaku Data Reduction Guide1. We obtained cleaned
event files by re-running the Suzaku pipeline implementing the latest calibration database (CALDB) available since January 20 of 2013, and also applying the associated screening criteria files. We extracted spectra from the cleaned event files using XS-ELEC and we generated responses for each detector utilizing the XISRESP script with a medium resolution. The spectral and re-sponse files for the front-illuminated detectors (XIS0, 1 and 3) were combined using the FTOOL ADDASCASPEC, after con-firmation of their consistency. In addition, we grouped the spec-tra in order to have a minimum of 20 counts per energy bin.
We carried out spectral fitting applying XSPEC v12.7.1. The energy ranges around of 1.75 and 2.23 keV are not used for spec-tral fitting because of the known artificial structures in the XIS spectra around the Si and Au edges. Therefore, for spectral fits we chose the 0.3–10 keV range for the XISs (excluding 1.75 and 2.23 keV points).
2.2. RXTE
We analyzed three RXTE observations of Swift J1644+57 made between July 1997 and January 2001 related to different spectral states of the source. In addition, we analyzed only one RXTE observation of Swift J2058+05 made on June 1, 2011 close to peak burst state of the source.
1 http://heasarc.gsfc.nasa.gov/docs/suzaku/analysis/
Standard tasks of the LHEASOFT/FTOOLS 5.3 software package were applied for data processing. For spectral analy-sis we used PCA Standard 2 mode data, collected in the 3– 23 keV energy range, using PCA response calibration (ftool pcarmf v11.7). The standard dead time correction procedure was applied to the data. In order to construct the broadband spectra of the data we also used HEXTE detectors in the case of Swift J1644+57. The spectral analysis of the data in the 19– 150 keV energy range was implemented in order to account for the uncertainties in the HEXTE response and background de-termination. We subtracted a background corrected in off-source observations. The data are available through the GSFC public archive2. Systematic error of 0.5% was applied to all analyzed RXTE spectra.
In Table 2 we listed the groups of RXTE observations of Swift J1644+57 and Swift J2058+05 tracing thoroughly the source evolution during different spectral states. We modeled the RXTE energy spectra using XSPEC astrophysical fitting software.
2.3. Swift
The observational set of Swift J1644+57 is extensive. The source was monitored by the XRT several times a day, every day since March 28, 2011. We used the Swift observations carried out from 2011 to 2016. The log of the Swift/XRT observations used in this paper is shown in Table3. We analyzed only photon-counting mode (PC) data. The Swift-XRT/PC data (ObsIDs, shown in the second column of Table3) were processed using the HEASOFT v6.14, the tool XRTPIPELINE v0.12.84 and the calibration files (CALDB version 4.1). The ancillary response files were created using XRTMKARF v0.6.0 and exposure maps generated by XR-TEXPOMAP v0.2.7. We fitted the spectrum using the response file SWXPC0TO12S6_20010101v012.RMF. We also used the online XRT data product generator3for independent check: light curves and spectra, including background and ancillary response files (see Evans et al.2007,2009).
The log of the Swift/XRT observations of Swift J2058+05 used in this paper is also shown in Table3. The Swift-XRT/PC data (ObsIDs) are indicated in the third column of this table
2 http://heasarc.gsfc.nasa.gov
Table 3. List of the Swift observations of Swift J1644+57 and Swift J2058+05.
Source Number Obs. ID Start time (UT) End time (UT) MJD interval
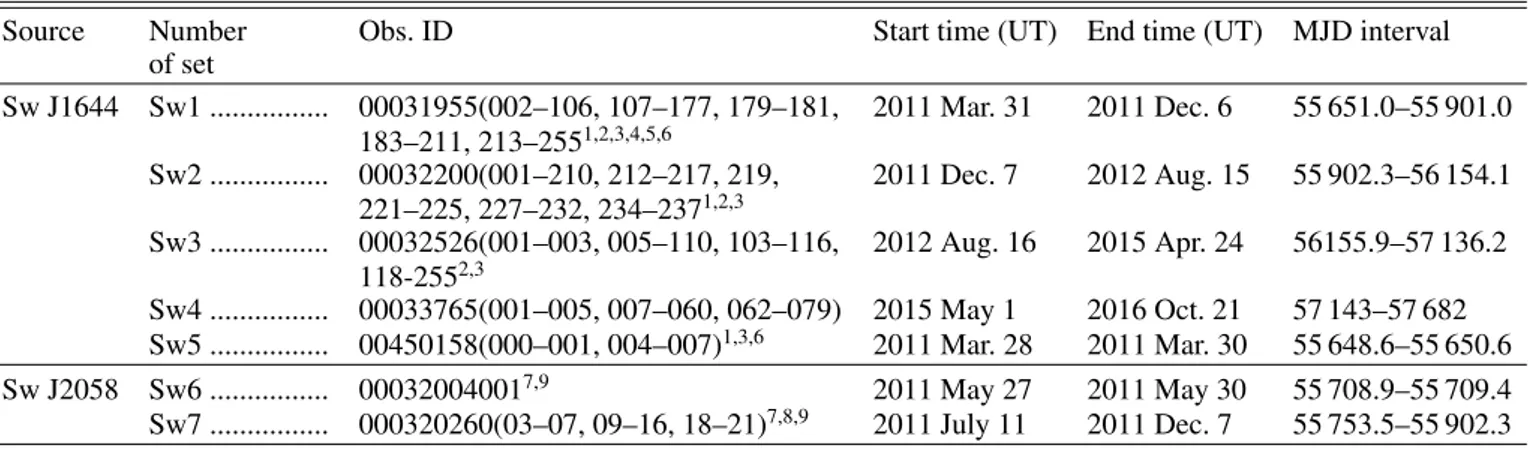
of set Sw J1644 Sw1 ... 00031955(002–106, 107–177, 179–181, 2011 Mar. 31 2011 Dec. 6 55 651.0–55 901.0 183–211, 213–2551,2,3,4,5,6 Sw2 ... 00032200(001–210, 212–217, 219, 2011 Dec. 7 2012 Aug. 15 55 902.3–56 154.1 221–225, 227–232, 234–2371,2,3 Sw3 ... 00032526(001–003, 005–110, 103–116, 2012 Aug. 16 2015 Apr. 24 56155.9–57 136.2 118-2552,3 Sw4 ... 00033765(001–005, 007–060, 062–079) 2015 May 1 2016 Oct. 21 57 143–57 682 Sw5 ... 00450158(000–001, 004–007)1,3,6 2011 Mar. 28 2011 Mar. 30 55 648.6–55 650.6 Sw J2058 Sw6 ... 000320040017,9 2011 May 27 2011 May 30 55 708.9–55 709.4 Sw7 ... 000320260(03–07, 09–16, 18–21)7,8,9 2011 July 11 2011 Dec. 7 55 753.5–55 902.3
References. (1) Saxton et al. (2012); (2) Komossa et al. (2015); (3) Mangano et al. (2016); (4) Burrows et al. (2011); (5) Levan et al. (2011); (6) Zauderer et al. (2013); (7) Pasham et al. (2015); (8) Komossa et al. (2015); (9)Cenko et al.(2012).
and they were processed using the same software as that in the case of Swift J1644+57. We also obtained images using the on-line XRT data processing facility4. In this way, we inspected the image in vicinity of Swift 2058+05 to exlude the presence of other sources close to this source. For the Swift/XRT image 0.3–10 keV of the source field of view (FOV) we use the circle of 5 arcmin radius with the center of the source position (α = 20h58m19.76s, δ = +05◦13029.800, J2000.0;Cenko et al. 2012).
The faint source is at the bottom of the image (at 5.8 arcmin ra-dius), but it is beyond the FOV used for our analysis.
3. Results
3.1. X-ray light curves
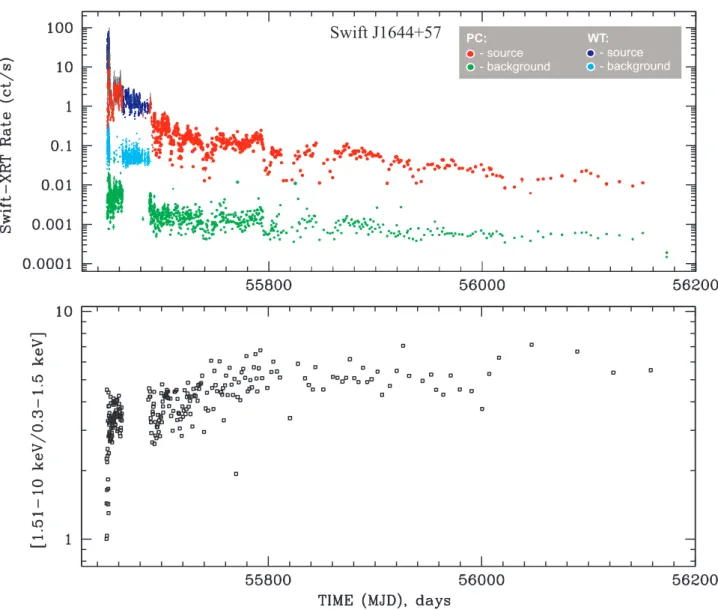
The 0.3–10 keV light curve of Swift J1644+57 is shown in Fig.1 (top panel), for the time period 2011–2012. The source signal (with 2σ detection level) for PC/WT mode is indicated, as is the background level for PC/WT mode, respectively. We found a complex count rate behavior at the burst peak, which is vari-able from 0.3 to 100 counts/s (in PC mode) within 100 s, and a long slow decay (from 1 to 0.1 counts/s) with rough duration of 500 days. For the rest of the Swift observations the source remained in the low state. Specifically, on 508th day (from the first detection on March 28, 2011) the source emission suddenly dropped below the Swift detection limit (Sbarufatti et al.2012). The light curve of Swift J2058+05 in the 0.3–10 keV range using Swift/XRT during the source outburs decay on from May 27 to July 11, 2011 is presented in Fig.2.
3.2. Hardness-intensity diagrams and HR curves
In application to the Swift data of Swift J1644+57 we have de-fined the hardness ratio (HR) as a ratio of the hard and soft counts in the 1.5–10 keV and 0.3–1.5 keV bands, respectively. The HR value strongly depends on calculation of the background counts. In the bottom panel of Fig.1 we show the HR curve ver-sus MJD time using PC mode data of Swift J1644+57. At the beginning, this curve shows variations tracking the light curve local flares, for which the hardness rises when the average rate increases, and then saturation when the average rate decreases.
4 Seehttp://www.swift.ac.uk/user_objects/and Evans et al.
(2007, 2009).
We observe a hardness plateau phase from ∼2.5 to 16 days after the source discovery.
It is interesting that we detect a sharp hardening of X-ray emission flux of Swift J1644+57 near the initial outburst part, which is typical for known Galactic BHs (GBHs) and usually accompanied by the jet turn-on (e.g., in GRS 1915+105, see Belloni & Motta 2016;Migliari & Fender 2006;Titarchuk & Seifina 2009).
In Fig.3 we present the hardness-intensity diagram (HID), which demonstrates that different count-rate observations are as-socated with different color regimes. The HR larger values cor-respond to harder spectra. A Bayesian approach was used to es-timate the HR values and their errors (seePark et al. 2006)5. For clarity, we plot only one point with error bars (in the bottom right corner) to demonstrate typical uncertainties for the count rate and HR.
Figure3clearly shows that the HR monotonically drops with the soft count rate (0.3–1.5 keV). This particular sample is sim-ilar to those of most of outbursts of Galactic X-ray binary tran-sients (see Homan et al.2001; Belloni et al.2006; Shaposhnikov & Titarchuk 2006; ST09; TS09; Shrader et al.2010; Munoz-Darias et al.2014).
3.3. X-ray spectral analysis
A number of spectral models was used in order to test them for all available data sets for Swift J1644+57 and Swift J2058+05. Our goal is to establish an evolution between the low hard and high soft states based on spectral modeling.
3.3.1. Swift J1644+57
The X-ray spectra of Swift J1644+57 obtained using the Suzaku/XIS observations in 2011 (the high soft state) and 2012 (the low hard state. In Fig.4we show examples of these spec-tra along with that obtained by the Swift/XRT. Two EFESuzaku
spectral diagrams related to the high soft state and the low hard state are presented in Fig.5. While the spectrum detected by RXTE and the combined Swift-RXTE spectral diagram are shown in Figs.6and7, respectively.
5 A Fortran and C-based program which calculates the ratios using
the methods described by Park et al. (2006; see http://hea-www. harvard.edu/AstroStat/BEHR/).
Fig. 1. Swift/XRT light curve of Swift J1644+57 in the 0.3–10 keV range during 2011–2012 (top panel). Here, red, blue points mark the source signal (with 2σ detection level) for PC/WT mode. Green and cyan points indicate the background level for PC/WT mode, respectively. In the bottom panel we show the hardness ratio curve (1.51–10 keV/0.3–1.5 keV) using PC mode data of Swift J1644+57.
Fig. 2.Light curve of Swift J2058+05 in the 0.3–10 keV energy range during the outburst decay (2011, May, 27–July, 11) deteted by Swift/XRT. The red points mark the brighter phase (id= 32 004) of outburst, while the blue points indicate the fainter phase (id = 32 026). In the horizontal axis we show the time scale in the MJD-55 708.9 units
Fig. 3. Hardness-intensity diagram (HID) for Swift J1644+57 using the Swift observations (2011–2012) during spectral evolution from the high state to the low state. In the vertical axis, the hardness ratio (HR) is a ratio of the source counts in the two energy bands: the hard (1.5– 10 keV) and soft (0.3–1.5 keV). HR decreases with a source brightness in the 0.3–10 keV range (horizontal axis). For clarity, we plot only one point with error bars (in the bottom right corner) to demonstrate typical uncertainties for the count rate and HR.
We investigated the Suzaku spectra for Swift J1644+57 to check the following XSPEC spectral models: powerlaw, black-body, the bulk motion Comptonization (BMC) and their possible combinations modified by an absorption model. We find that the absorbed power-law model (phabs ∗ zphabs ∗ zpowerlw) reveals a statistically-unacceptable fits with the photon indexΓpow∼ 1.9
and the reduced chi-squared>2 (S z1, see Tables1,4). A simi-lar result was also previously reported by Burrows et al. (2011) and Reis et al. (2012). Moreover, the thermal model (zbbody) gives us even worse fits. As a result we checked a combination of zbbody and zpowerlw models. In this case the model parameters are NH,z=0.354 = (1.2−1.9) × 1022cm−2; kTzbb = 0.24−0.3 keV
andΓ = 1.3−1.9 (see more detail in Table4). The best fits of the Suzaku spectra has been found using the BMC XSPEC model (Titarchuk et al. 1997), for whichΓ ranges from 1.1 to 1.8 for all observations (see Table4and Figs.4–5). In Fig.4we also show the simultaneous spectra of Swift J1644+57 obtained using the Suzakuand Swift/XRT observations.
Thus, we decided to analyze all available spectral data of SwiftJ1644+57 using the XSPEC BMC model. The BMC model uses a convolution of a seed blackbody with an upscattering Green’s function, presented in the framework of the BMC as a broken power law in which left and right wings have the spec-tral indices α+ 3 and α, respectively (see a description of the BMC Comptonization Green’s function in Titarchuk & Zannias 1998, TZ98; and compare with Sunyaev & Titarchuk 1980). The BMC model has as the main parameters, α, A (related to the il-lumination fraction f = A/(1 + A)), the seed blackbody (BB) temperature Ts, and the BB normalization which is proportional
to the seed BB luminosity and inversely proportional to d2where
dis a distance to the source (see also Titarchuk & Seifina2016a, hereafter TS16a).
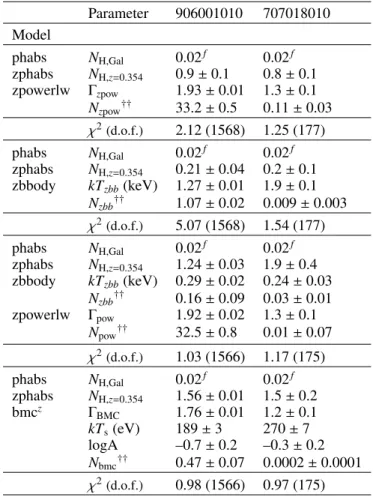
Table 4. Best-fit parameters of the Suzaku spectra of
SwiftJ1644+57 in the 0.45−10 keV range using the follow-ing four models: phabs*zphabs*powerlw, phabs*zphabs*zbbody, phabs*zphabs(zbbody+zpowerlw) and phabs*zphabs*bmc.
Parameter 906001010 707018010 Model phabs NH,Gal 0.02f 0.02f zphabs NH,z=0.354 0.9 ± 0.1 0.8 ± 0.1 zpowerlw Γzpow 1.93 ± 0.01 1.3 ± 0.1 Nzpow†† 33.2 ± 0.5 0.11 ± 0.03 χ2 (d.o.f.) 2.12 (1568) 1.25 (177) phabs NH,Gal 0.02f 0.02f zphabs NH,z=0.354 0.21 ± 0.04 0.2 ± 0.1 zbbody kTzbb(keV) 1.27 ± 0.01 1.9 ± 0.1 Nzbb†† 1.07 ± 0.02 0.009 ± 0.003 χ2(d.o.f.) 5.07 (1568) 1.54 (177) phabs NH,Gal 0.02f 0.02f zphabs NH,z=0.354 1.24 ± 0.03 1.9 ± 0.4 zbbody kTzbb(keV) 0.29 ± 0.02 0.24 ± 0.03 Nzbb†† 0.16 ± 0.09 0.03 ± 0.01 zpowerlw Γpow 1.92 ± 0.02 1.3 ± 0.1 Npow†† 32.5 ± 0.8 0.01 ± 0.07 χ2 (d.o.f.) 1.03 (1566) 1.17 (175) phabs NH,Gal 0.02f 0.02f zphabs NH,z=0.354 1.56 ± 0.01 1.5 ± 0.2 bmcz Γ BMC 1.76 ± 0.01 1.2 ± 0.1 kTs(eV) 189 ± 3 270 ± 7 logA –0.7 ± 0.2 –0.3 ± 0.2 Nbmc†† 0.47 ± 0.07 0.0002 ± 0.0001 χ2 (d.o.f.) 0.98 (1566) 0.97 (175)
Notes. Errors are given at the 90% confidence level. The normaliza-tion parameters of blackbody and BMC components are in units of Lsoft
36/d 2 10erg s
−1kpc−2, where Lsoft
36 is the soft photon luminosity in units
of 1036erg s−1, d
10is the distance to the source in units of 10 kpc, and
power-law component is in units of kTBBand kTsare the temperatures
of the blackbody and seed photon components (in keV and eV), respec-tively.ΓpowandΓBMCare the indices of the zpowerlw and bmc,
respec-tively. Hereafter superscriptzindicates that the cosmological reddening
of the spectrum was talen into ccount [E → E(1+ z)]. Redshift z was fixed to 0.354 (Levan et al.2011). NH,Galand NH,z=0.354are in units of
1022cm−2. ( f )Indicates that a parameter was fixed.
The TDE source, Swift J1644+57 is located at z = 0.354 and thus, we should take into account the cosmological reddening of the spectrum due to the redshifted energy band (E → E(1+ z)). In order to make this redding corrections we used the ener-gies XSPEC command, which extends the maximum energy over which the model is being calculated to (1+z) times the maximum energy in the response. As a result the BMCzmodel describes the
outgoing spectrum as a convolution of the input seed blackbody-like spectrum, of which normalization is NBMC and color
tem-perature is kTs, with the Comptonization Green’s function.
In addition to the Galactic absorption, NH,Gal= 2×1020cm−2
in this sky direction we also apply a multiplicative zphabs model with a column density, NH,z=0,354of 1.5 × 1022cm−2in the local
(comoving) frame at redshift of 0.354. As a result we obtained the best-fit results using the same model for the Suzaku and Swift spectral data of Swift J1644+57 in the 0.3–10 keV energy range
Table 5. Best-fit parameters of the RXTE spectra of Swift J1644+57 and Swift J2058+05.
Source Number of set α = Γ − 1 kTs(eV) log(A) Na Ecut(keV) kTe(keV) χ2red(d.o.f.)
Sw J1644 R1b... 0.76 ± 0.01 90d 0.5 ± 0.3 1.1 ± 0.1 90 ± 4 ... 0.90 (74) R2b... 0.73 ± 0.02 90d –0.26 ± 0.08 0.6 ± 0.2 100 ± 7 ... 0.95 (74) R3b... 0.78 ± 0.04 90d –0.3 ± 0.1 0.5 ± 0.1 110 ± 8 ... 0.95 (74) R1+Sz1c... 0.79 ± 0.05 370 ± 10 –0.43 ± 0.04 0.4 ± 0.1 ... 34 ± 2 1.03 (899) Sw J2058 R4b... 0.6 ± 0.1 160d 0.3 ± 0.1 3.4 ± 0.5 16 ± 4 ... 0.93 (125) R4+Sw6c... 0.45 ± 0.06 210 ± 30 –0.43 ± 0.04 3.8 ± 0.3 ... 4.0 ± 0.8 1.02 (1094)
Notes. Errors are given at the 90% confidence level.(a) The normalization parameters of the BMC and COMPTB components are in units of
Lsoft 36/d
2 10erg s
−1kpc−2, where Lsoft
36 is the soft photon luminosity in units of 10
36erg s−1, d
10is the distance to the source in units of 10 kpc. NH,Gal,
the Galactic column density for the neutral absorber, was fixed to 2×1020cm−2(for Sw J1644+57) and 6.5×1020cm−2(for Sw J2058+05; Kalberla
et al.2005) and NH,z=0.354/NH,z=1.1853, the column density for the neutral absorber in the local frame at redshift z= 0.354/z = 1.1853, was fixed to
1.5 × 1022cm−2(for Sw J1644+57; Saxton et al.2012) and 2.6 × 1021cm−2(for Sw J2058+05; Cenko et al.2012), respectively; kT
sis the seed
photon temperature, kTeis the electron temperature, and Ecutis the cutoff energy.(b) Spectrum was fitted by the phabs*zphabs*bmcz*zhighect
model;(c)spectrum was fitted by the phabs*zphabs*CompTBzmodel;(d)indicates that a parameter was fixed.
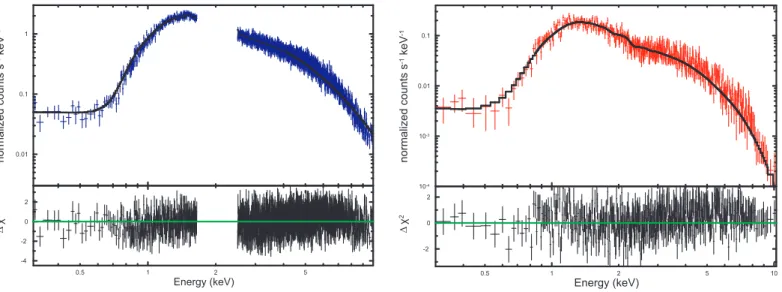
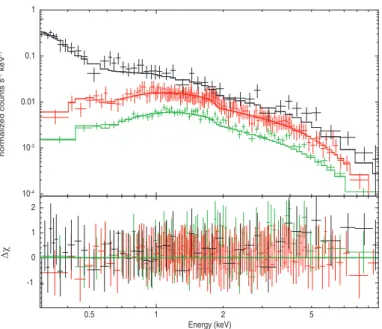
Fig. 4. Suzaku/XIS spectra (blue) and Swift/XRT (red) of Swift J1644+57 at the decay phase (both on 2011 April 6, MJD = 55 657) in normalized counts fitted using the phabs*zphabs*bmczmodel with α= 0.63 ± 0.01, log(A) = −0.72 ± 0.2, kT
s = 240 ± 5 eV for the Suzaku spectrum, S z1
(χ2
red= 0.98 for 1566 d.o.f.) and with α = 0.77 ± 0.04, log(A) = −1.62 ± 0.09, kTs= 200 ± 20 eV (χ2red= 1.04 for 659 d.o.f.) for the Swift spectrum.
The spectral models are shown by black hystograms.
throughout all (high soft and low hard) states. However, to fit the RXTE spectral data of Swift J1644+57 in a wide energy range we have to apply a multiplicative component zhighect to the BMC model in order to correctly reproduce the high energy part of the source spectrum (see Table5and Fig.6). For the cross-check, we combined Swift and RXTE spectra both obtained on March 31, 2011 and apply the Comptonization COMPTB model (see Fig. 7) which is the XSPEC model6, see Farinelli et al. (2008), for the direct determination of the high energy cutoff of the spectrum, Ecutwhich is related to the plasma temperature kTe
for the thermal Comptonization (Ecut ∼ 2kTe). The fit
parame-ters of these models are shown in Table5.
Using the same model, we made the spectral analysis of Suzaku, Swift and RXTE observations and found that Swift J1644+57 was in the three spectral states (the low hard, intermediate and soft states). The best-fit Γ are presented in Tables 4, 5 (see also Figs. 4, 5). Evolution of the source be-tween the low state and high state is accompanied by a mono-tonic increase of the normalization parameter, NBMC from 0.5 6 http://heasarc.gsfc.nasa.gov/docs/software/lheasoft/
xanadu/xspec/models/comptb.html
to 300 × L33/d210 erg/s/kpc
2 which correlates with an increase
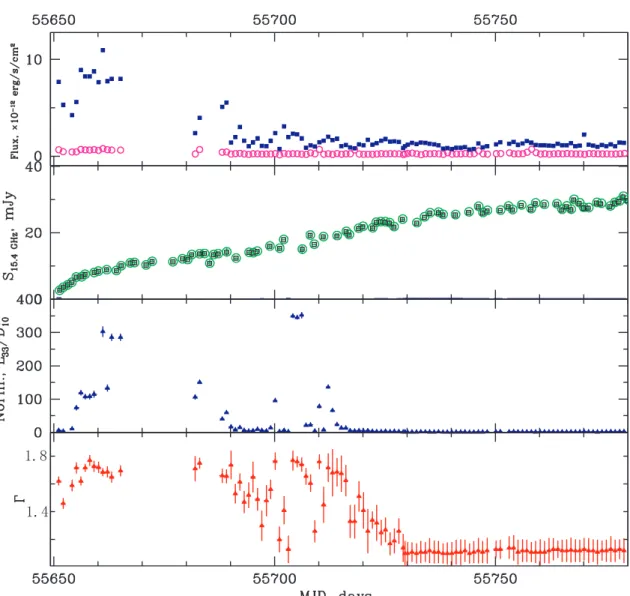
of Γ from 1.1 to 1.8 (see Fig. 8). It is also interesting that this source demonstrates monotonical growth of the radio flux density (15.4 GHz) along with the drop of X-ray brightness (see second panel from the top in Fig. 9).
The rapid decline during 2011–2012 outburst decay is not seen in the radio implying that X-ray and radio emission at least have different origins at later times. In fact, Zauderer et al. (2013) interpreted the sudden drop in X-ray emission as evidence for a change in accretion regime. Specifically, Zauderer et al. related turning off the jet production, with the X-ray fainter stage. They also argued that the continued radio emission emananting from the forward shock related to the jet.
3.3.2. Swift J2058+05
For Swift J2058+05 we also investigated the Swift and RXTE spectra and checked the XSPEC spectral models which were powerlaw, blackbody, the BMC, and their possible combinations modified by an absorption model and redshift correction.
Fig. 5. Two EFE spectral diagrams during the high soft (purple) and
low hard (blue) spectral states of Swift J1644+57. Data taken from Suzakuobservations, 906001010 (Sz1, high soft and 707018010 (Sz2, low hard.
Fig. 6.RXTE (3–100) keV spectrum of Swift J1644+57. The observa-tion taken on 2011 March 30 (MJD= 55 650.0, ID = 96 242-01-01-00) was fitted using CompTB model with α= 0.86±0.03, kTe= 46±3 keV,
log(A)= −0.5 ± 0.2, kTs = 0.3 keV (fixed) with the intrinsic column
density of NH,z=0.354 = 1.5 × 1022cm−2(at redshift z= 0.354) and the
Galactic absorption NH,Gal= 2 × 1020cm−2 (χ2red= 0.97 for 120 d.o.f.).
The high energy cut-off is clearly seen at Ecut= 80 keV.
We show examples of the Swift/XRT spectra in EFE and
normalized count units (see Figs.10,11). In particular, Fig.10 shows the best-fit spectrum during the intermediate-low hard state (IS-LHS) decay transition in EFE units (top panel) and
∆χ (bottom panel). Figure11demonstrates the spectral evolu-tion using three representative Swift/XRT spectra in normalized count units (top panel) with∆χ (bottom panel) for the LHS, the IS and the high soft state (HSS).
We also found, as that for Swift J1644+57, the ab-sorbed power-law model (phabs ∗ zphabs ∗ zpowerlw) re-veals a statistically-unacceptable fits (see Table 6 for id = 00032004001). A similar result was also previously reported
Fig. 7. Combined Swift/XRT and RXTE/PCA+HEXTE spectrum at the peak outburst phase (on 2011 March 31) in EF(E) units fitted using phabs*CompTBmodel (with α= 0.79±0.05, kTe= 34±2 keV, log(A) =
−0.43 ± 0.04, kTs = 370 ± 10 eV (χ2red = 1.03 for 889 d.o.f.), see also
Table 5.
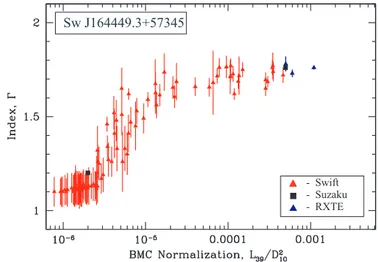
Fig. 8. Photon index,Γ plotted versus BMC normalization (which is proportional to ˙M) for the TDE source, Swift J1644+57 using Swift (red triangles), Suzaku (black squares) and RXTE (blue triangles) data (see Tables4and5).
byCenko et al.(2012) andPasham et al.(2015). Moreover, the thermal model (zbbody) gives us even worse fits.
We then checked a combination of zbbody and zpowerlw models. In this case the model parameters are NH,z=1.185 =
(1.9−2.3) × 1021cm−2; kT
zbb = 1.2−5.7 keV and Γ = 1.3−1.9
(see more details in Table 6). However, the best fits of the Swift spectra has been found using the BMC XSPEC model (Titarchuk et al. 1997), for which Γ also ranges from 1.2 to 1.8 for all observations similar to that for Swift J1644+57 (see Fig.8). Thus, we decided to analyze all available spectral data of Swift J2058+05 using the XSPEC BMC model.
The TDE source, Swift J2058+05 is located at z = 1.185 and thus, we should also take into account the cosmological reddening of the spectrum due to the redshifted energy band (E → E(1+ z)), see details in Sect. 3.3.1. We used the BMCz model to describe the outgoing spectrum.
In addition to the Galactic absorption, NH,Gal = 6.5 ×
1020cm−2 in this sky direction we also apply a
multiplica-tive zphabs model with a column density, NH,z=1.185 of 2.5 ×
obtained the best-fit results using the same model for the Swift and RXTE spectral data of Swift J2058 in the 0.3–10 keV and 2– 30 keV energy ranges, respectively, throughout all spectral states (HSS, IS and LHS). However, to fit the RXTE spectral data of Swift J2058+05 in a wide energy range we should also apply (as for the case of Swift J1644+57) a multiplicative component zhighect to the BMC model in order to correctly reproduce the high energy part of the source spectrum (see Table5(lower part) and Fig.7, related to the case of Swift J1644+57). For the cross-check, as we did for the Swift J1644+57 data, we combined Swift and RXTE spectra, both obtained at the end of May, 2011, and apply the COMPTB model for the determination of Ecutwhich
is Ecut ∼ 2kTe. The fit parameters of these models are shown in
Table5(lower part).
4. Discussion
We carried out a detailed analysis of the Swift J1644+57 spec-tra observed during outburst decay (2011–2012) and revealed that Swift J1644+57 shows a spectral evolution similar to that seen in Galactic BHs. Specifically, based on Swift, RXTE and Suzakuobservations we establish for the Swift J1644+57 spectra Γ correlates with the BMC normalization, NBMC (which is
pro-portional to ˙M) and finally saturates at high values of ˙M (see Fig.8). The index,Γ, monotonically grows from 1.1 to 1.7 with
˙
Mand then saturates atΓsat∼ 1.8 for high values of NBMC.
Previ-ously, Titarchuk & Zannias (1998) developed the semi-analytical theory of X-ray spectral formation in the converging flow into a BH. They argued that the spectral index of the emergent X-ray spectum saturated at high values of the mass accretion rate (higher than the Eddingtion one). Later analyzing the RXTE data for many BH candidate sources ST09,Titarchuk & Seifina (2009), Seifina & Titarchuk (2010), and STS14 demonstrated that this index saturation effect is observed in many Galac-tic BHs (see e.g., GRS 1915+105 Titarchuk & Seifina 2009, GX 339–4, GRO J1655–40, 4U 1543–47, H 1743–322, Cyg X– 1, XTE J1550–564 (ST09) SS 433 Titarchuk & Seifina 2009). Previously, this scaling method was effectively applied to esti-mate BH masses of extragalactic black holes (TS16a; Titarchuk & Seifina 2016b, hereafter TS16b; Sobolewska & Papadakis 2009; Giacche et al. 2014; Titarchuk & Seifina 2017, here-after TS17). Recently the scaling method was successfully im-plemented to estimate BH masses of two ultraluminous X-ray sources, ESO 243–49 HLX–1 (TS16a) and M101 ULX–1 (TS16b). These findings suggest that BH masses are of the or-der of 104solar masses in these objects.
The levels of the saturation index are different and presum-ably depend on the plasma temperature of the converging flow (see Monte Carlo simulations by Laurent & Titarchuk 1999, 2011). For Swift J1644+57 we establish that the photon index saturates at the relatively low level, Γsat around 1.7–1.8 (see
Fig.8). This lowΓsat level can be related to the high electron
temperature of irradiating plasma kTe∼ 40 keV, which also is in
agreement with the high cutoff energy Ecut∼ 80 keV detected in
the source spectra observed by RXTE (see Figs.6,7).
This relatively lowΓsatand consequently, the high Tevalue
are consistent with each other. It is probable that a large frac-tion of the mass accrefrac-tion flow goes out of the disk in the subKeplerian manner. That leads to the strong upscattering of the disk photons in the Compton cloud (transition layer) lo-cated between the Keplerian accretion disk and the particle last stable orbit (∼3Rsch). The geometry of the illumination of the
Compton cloud by the soft (disk) photons is shown in TS16a. We note that Very Large Array and Very Long Baseline Array
Table 6. Best-fit parameters of the Swift spectra of
Swift J2058+05 in the 0.3−10 keV range using the follow-ing four models: phabs*zphabs*powerlw,phabs*zphabs*zbbody, phabs*zphabs(zbbody+zpowerlw) and phabs*zphabs*bmc.
Parameter 00032004001 00032026004 Model phabs NH,Gal 0.65f 0.65f zphabs NH,z=1.185 3.7 ± 0.8 3.0 ± 0.1 zpowerlw Γzpow 1.69 ± 0.08 1.3 ± 0.1 Nzpow†† 35.1 ± 0.9 0.41 ± 0.06 χ2(d.o.f.) 3.2 (967) 1.27 (967) phabs NH,Gal 0.65f 0.65f zphabs NH,z=1.185 0.2 ± 0.3 0.6 ± 0.1 zbbody kTzbb(keV) 3.89 ± 0.08 1.6 ± 0.1 Nzbb†† 3.7 ± 0.1 0.007 ± 0.001 χ2(d.o.f.) 5.07 (967) 1.54 (967) phabs NH,Gal 0.65f 0.65f zphabs NH,z=1.185 1.9 ± 0.2 2.3 ± 0.5 zbbody kTzbb(keV) 5.7 ± 0.6 1.2 ± 0.3 Nzbb†† 13.6 ± 0.2 0.3 ± 0.1 zpowerlw Γpow 1.92 ± 0.02 1.3 ± 0.1 Npow†† 210 ± 10 15 ± 9 χ2(d.o.f.) 1.03 (969) 1.17 (969) phabs NH,Gal 0.65f 0.65f zphabs NH,z=1.185 2.6 ± 0.1 2.5 ± 0.2 bmcz Γ BMC 1.78 ± 0.03 1.5 ± 0.2 kTs(eV) 300 ± 10 270 ± 7 log A 0.3 ± 0.1 1.25 ± 0.6 Nbmc†† 3.1 ± 0.1 0.09 ± 0.01 χ2(d.o.f.) 1.04 (969) 0.89 (969)
Notes. Errors are given at the 90% confidence level.(††) The
normal-ization parameters of the blackbody and BMC components are in units of Lsoft
35/d 2 10 erg s
−1kpc−2, where Lsoft
35 is the soft photon luminosity in
units of 1035erg s−1, d
10is the distance to the source in units of 10 kpc,
and power-law component is in units of keV−1cm−2s−1at 1 keV. kT BB
and kTs are the temperatures of the blackbody and seed photon
com-ponents (in keV and eV), respectively.ΓpowandΓBMCare the indices
of the zpowerlw and bmc, respectively. Hereafter superscriptzindicates
that the cosmological reddening of the spectrum was taken into account (E → E(1+z)). Redshift z was fixed to 1.185 (Cenko et al. 2012). NH,Gal
and NH,z=1.185are in units of 1021cm−2. ( f )Indicates that a parameter was
fixed.
radio observations of this X-ray source point to possible outflow (Zauderer et al.2011, see also Fig. 9). Using the index- ˙M cor-relation found in Swift J1644+57 we can estimate a BH mass in this source applying scaling of this correlation with those de-tected in particular GBH sources.
4.1. Black hole mass estimates
ST09 (see Sect. 3.2 there) elaborated the scaling method in detail and derived formulae for the BH determination. ST09 (see their Eqs. (4) and (6) ) showed that the disk (soft photon) luminosity is proportional to a dimensionless BH mass and a mass accretion rate in terms of the solar mass and the critical mass accretion rate, respectively. Moreover, the normalization of the soft pho-tons in the Comptonization BMC model, NBMCis proportional to
Fig. 9. For Swift J1644+57, from top to bottom: evolutions of the model flux in the soft band 0.3–1.5 keV, blue squares, and the hard band 1.5–10 keV, pink circles (Swift/XRT bands); the flux density S15.4 GHz(green points) at 15.4 GHz (AMI Large Array, Berber et al. 2012), the BMC
normalization and the photon index,Γ during the 2011 flare decay set (S1, S2).
Table 7. Parameterizations for the target sources, Swift J1644+57 and Swift J2058+05, and reference sources.
Reference source A B D xtr β GRO J1655–40 1.98 ± 0.02 0.44 ± 0.02 1.0 0.06 ± 0.02 1.88 ± 0.25 GX 339–4 RISE 2004 2.24 ± 0.01 0.51 ± 0.02 1.0 0.039 ± 0.002 3.5 4U 1543–37 DECAY 2002 2.15 ± 0.06 0.63 ± 0.07 1.0 0.049 ± 0.001 0.6 ± 0.1 Cyg X–1 2.11 ± 0.06 0.59 ± 0.08 1.0 0.076 ± 0.003 0.8 ± 0.1 Target source A B D xtr[×10−6] β SwiftJ1644+57 1.84 ± 0.09 0.46 ± 0.08 1.0 6.59 ± 0.09 1.78 ± 0.08 SwiftJ2058+05 1.84 ± 0.09 0.46 ± 0.08 1.0 0.25 ± 0.08 1.78 ± 0.08
(where d is the distance to a particular source). Hence, one can estimate a BH mass using this relation. The ratio of these nor-malizations for target and reference sources in the same spectral state is presented by Eq. (7) in ST09.
4.1.1. Swift J1644+57
To estimate the BH mass, MBH of Swift J1644+57, we chose
the galactic BHs, GRO J1655–40, Cyg X–1, 4U 1543–47 and GX 339–4 (see ST09) as the reference sources for which the
BH masses and distances were well established now (see Ta-bles7,8). We note that the BH masses of these BHs were also estimated using dynamical methods.
For a BH mass estimate we used NBMC of the reference
sources and the index versus NBMCcorrelations for the reference
sources, GRO J1655–40, Cyg X–1, 4U 1543–47 and GX 339–4, with that of the target source Swift J1644+57 (see Fig.12). The value of the index saturation for the Swift J1644+57, Γsw
sat∼ 1.78,
is close toΓgrosat ∼ 1.98 of GRO J1655–40 as well asΓcygsat ∼ 2.11, Γ4u
sat ∼ 2.15 and Γ gx
Dc
Fig. 10. Best-fit Swift/XRT spectrum in EFE units during of the
intermediate-low hard state transition (top panel) with ∆χ (bottom panel) for Swift J2058+05.
Dc
Fig. 11.Three representative Swift/XRT spectra in normalized counts units (top panel) with∆χ (bottom panel) for the LHS (green), IS (red) and HSS (black) spectral states of Swift J2058+05.
GX 339–4, respectively. While such a low index saturation level has never been detected in any Galactic or extragalactic BH source (see i.e., ST09 and TS17), the slopes ofΓ – NBMC
cor-relation are the same for both the target and reference sources (see Fig.12). Hence, it allows us to perform a reliable scaling of this reference source correlation with that of Swift J1644+57. The scaling procedure was made in a similar way to that in TS17; TS16a, b and ST09 where the authors applied an analyt-ical approximation of theΓ(Nbmc) correlation, determined by a
function
F (x)= A − (D · B) ln{exp[(1.0 − (x/xtr)β)/D]+ 1} (1)
with x= Nbmc.
Fitting of the observed correlation by this function F (x) pro-vides us a number of the best-fit parameters A, B, D, xtr, and β
More detailed description of these parameters is given in TS16a.
One should rely on the same shape of theΓ − Nbmc
correla-tions for the target source and those for the reference sources in order to make the BH mass determination for the target source using the scaling method (ST09). A BH mass, Mt of
SwiftJ1644+57 (target source) can be estimated by shifting the reference source correlation along Nbmc-axis to that of the target
source (see Fig.12)
Mt= Mr Nt Nr dt dr !2 fG, (2)
where the subscripts “t” and “r” correspond to the “target” and “reference” sources, respectively and a geometric factor, fG = (cos θ)r/(cos θ)t, the inclination angles θr, θtand dr, dtare
distances to the reference and target sources, respectively (see ST09), values Mtand Mrare in solar masses.
Figure12shows theΓ − Nbmccorrelation for Swift J1644+57
using Swift, Suzaku, and RXTE spectra (see also Tables 4, 5) along with the correlation for the GBHs, GRO 1655–40, GX 339–4, Cyg X–1, and 4U 1543–47.
We use values of Mr, dr, dt, and cos(i) from Table 8 and
then calculate the lowest limit of the mass, Mt using the best
fit value of Nt taken them at the beginning of the index
satura-tion (see Fig.12) and measured in units of L39/d102 erg s−1kpc−2
(see Table7for values of the parameters of function F (Nt) see
Eq. (1)). To determine the distance to Swift J1644+57 we used the formula (for z < 1)
dsw= zswc/H0, (3)
where the redshift zsw= 0.354 for Swift J1644+57 (see Wright
2006), H0 = 70.8 ± 1.6 km s−1 Mpc−1 is the Hubble constant
and c is the speed of light. Finally, we obtained that Msw ≥
7.8 × 10⁶ M
(Msw = Mt) assuming dsw ∼ 1.5 Gpc. Thus, we
obtained a lower limit to the mass due the unknown inclination. We present all these results in Table8.
The obtained BH mass estimate is in agreement with a “fun-damental plane” estimate, Msw ∼ 3 × 10⁶ M (see Miller &
Gultekin2011). In addition, using minimum timescales and the variability method, Liang & Liu (2003) obtained an estimate of a BH mass in the interval, Msw∼ 107−109M , which is consistent
with our BH mass estimates using the scaling technique. We derived the bolometric luminosity based on the normal-ization of the BMC model in the range of 1043–1045 erg/s
(as-suming isotropic radiation). The relatively high isotropic bolo-metric luminosity of Swift J1644+57 in the first weeks after the initial outburst is the main argument for a tidal disruption event as an origin of this phenomenon because the host galaxy was not known as an AGN before the flare. The peak bolometric lu-minosity is in agreement with the derived BH mass using our scaling technique. We note that our peak bolometric luminos-ity Lpeakbol for Swift J1644+57 is less than previous estimates of Lpeakbol obtained by different authors (see for example, Komossa 2015; Saxton et al. 2012; Mangano et al.2016). In particular, Komossa (2015) reported that Lpeakbol ∼ 1049 erg/s, which can
point to either a larger BH mass (MBH > 109 M ) or to
super-critical accretion regime (with ˙M > ˙MEdd). However, for MBH
in the 5 × 10⁶−107 M
range, the disk is expected to have a
bolometric disk luminosity in the (0.5−1) × 1045 erg/s range which is less than the critical one, LEdd. Therefore, an
appli-cation of the Comptonization model (BMC) to the spectra of SwiftJ1644+57 and our scaling method give us the most reli-able BH mass estimate.
Fig. 12.Scaling of the correlation of the photon index,Γ versus the BMC normalization rate (which is proportional to mass accretion rate, ˙M) for Swift J1644+57 (with red/black/bright blue points from Swift/Suzaku/RXTE data) and Swift J2058+05 (with violet diamonds/circle from Swift/RXTE data), and that for GRO J1655–40 (with pink squares, ST09), GX 339–4 (with blue squares, ST09), Cyg X–1 (with black circles, ST09) and 4U 1543–47 (with green squares, ST09) as a function of BMC normalization.
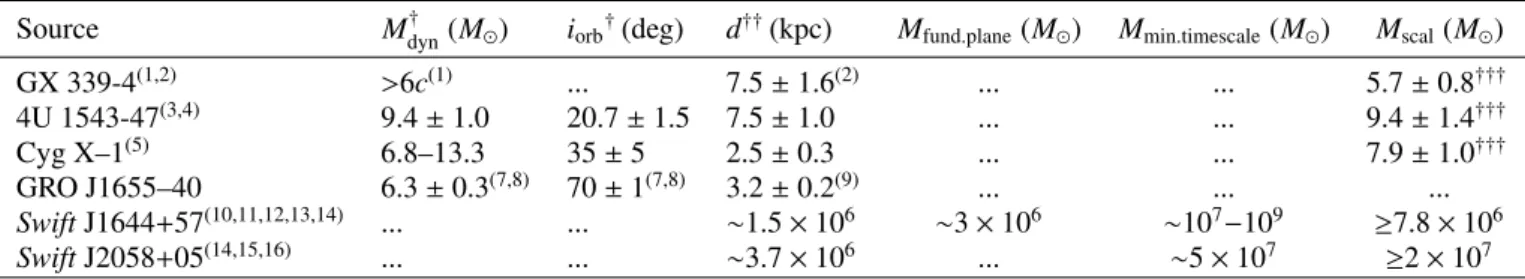
Table 8. Esimates of a BH mass and a distance value for the target sources, Swift J1644+57 and Swift J2058+05, and those for reference sources.
Source M†dyn(M ) iorb†(deg) d††(kpc) Mfund.plane(M ) Mmin.timescale(M ) Mscal(M )
GX 339-4(1,2) >6c(1) ... 7.5 ± 1.6(2) ... ... 5.7 ± 0.8††† 4U 1543-47(3,4) 9.4 ± 1.0 20.7 ± 1.5 7.5 ± 1.0 ... ... 9.4 ± 1.4††† Cyg X–1(5) 6.8–13.3 35 ± 5 2.5 ± 0.3 ... ... 7.9 ± 1.0††† GRO J1655–40 6.3 ± 0.3(7,8) 70 ± 1(7,8) 3.2 ± 0.2(9) ... ... ... SwiftJ1644+57(10,11,12,13,14) ... ... ∼1.5 × 10⁶ ∼3 × 10⁶ ∼107−109 ≥7.8 × 10⁶ SwiftJ2058+05(14,15,16) ... ... ∼3.7 × 10⁶ ... ∼5 × 10⁷ ≥2 × 10⁷
Notes.(†)Dynamically determined BH mass and system inclination angle;(††)Source distance found in the literature. For Swift J2058+0516 the
distance is estimated using the redshift z with taking into account the cosmological effects for z > 1 (see Wright20061).(†††)Scaling value found
by ST09.
References. (1) Munoz-Darias et al. (2008); (2) Hynes et al. (2004); (3) Orosz (2003); (4) Park et al. (2004); (5) Herrero et al. (1995); (6) Ninkov et al. (1998); (7) Green et al. (2001); (8) Hjellming & Rupen (1995); (9) Jonker & Nelemans (2004); (10) Miller & Gultekin (2011); (11) Bloom et al. (2011); (12) Burrows et al. (2011); (13) Levan et al. (2011); (14) Komossa (2015); (15) Cenko et al. (2012); (16) Pasham et al. (2015).
Indeed, the inferred luminosity is close to the Eddington limit for a 107 solar masses BH, L
Edd = 4πcGMBH/σT ∼
1.4 × 1045 erg/s. The relatively high electron temperatures,
kTe∼ 34 keV (see Table 5) are obtained using CompTB model
and the RXTE data for Swift J1644+57 spectra (see Sect. 3.4 and Figs.6,7). For such a high Tethe effective scattering
cross-section, hσi is less than the Thomson one, σT(see, for example
Titarchuk et al. 2014) and consequently, the critical luminosity is higher than the Eddington one. But the temperature-corrected critical luminosity in the case of Swift J1644+57 is higher than LEddof 1.4 × 1045 erg/s and thus, the observed luminosity from
this TDE source is actually a few times less than the critical one. 4.1.2. Swift J2058+05
To estimate a BH mass of Swift J2058+05, we chose the galactic BH, GRO J1655–40 (see ST09), Cyg X–1, GX 339–4, 4U 1543– 47 and the TDE source, Swift J1644+57 (see Sect. 4.1.1) as the
1 http://www.astro.ucla.edu/~wright/CosmoCalc.html
reference sources for which the BH masses and distances were established now (see Tables7,8).
For a BH mass estimate we used NBMC of the reference
sources and the index versus NBMC correlations for the
above-mentioned reference sources, with that of the target source, SwiftJ2058+05 (see Fig.12). The value of the index saturation for the Swift J2058+05, Γsw2sat ∼ 1.76, is close toΓsw1sat ∼ 1.78 for SwiftJ1644+57, as well as to Γgrosat ∼ 1.98 for GRO J1655–40, as well asΓcygsat ∼ 2.11,Γ4usat∼ 2.15 andΓgxsat ∼ 2.24 of Cyg X–1, 4U 1543–47 and GX 339–4, respectively. While such low index saturation levels (in Swift J2058+05 and Swift J1644+57) have never been found in any Galactic or extragalactic BH source (see ST09 and Sect.4.1.1).
The slopes ofΓ – NBMC correlation are the same for all the
target and reference sources (see Fig.12). Therefore, it allows us to perform a reliable scaling of these reference source correlation with that of Swift J2058+05. The scaling procedure was made in a similar way as Sect. 4.1.2 and in TS17, TS16a, Titarchuk & Seifina (2016b, hereafter TS16b) and ST09 where the authors
applied an analytical approximation of the Γ(Nbmc) correlation
(see Eq. (1)).
A BH mass, Mtof Swift J2058+05 (target source) can be
es-timated using by the same method as that for Swift J1644+57. We shift the reference source correlations along Nbmc-axis to
that of the target source (see Fig. 12 and Eq. (2)). Figure 12 shows theΓ − Nbmccorrelation for Swift J2058+05 using Swift,
and RXTE (see also Tables5,6along with the correlation for the GRO 1655–40 and Swift J1644+57 using Swift, Suzaku, and RXTE spectra. We use values of Mr, dr, dt, and cos(i) from
Table8and then calculate the lowest limit of the mass, Mt
us-ing the best fit value of Nt taken at the beginning of the index
saturation (see Fig.12).
To determine the distance to Swift J2058+05 we use the for-mula (for z > 1) d2058≈ 2c H0 " 1 − √1 z2058 # , (4)
where the redshift z2058 = 1.185 for Swift J2058+05 (Wright
2006). Thus, we obtain that M2058 ≥ 2 × 10⁷ M (Msw2 = Mt)
assuming dsw2∼ 3.7 Gpc. Thus, we estimated a lower limit of the
BH mass due to the unknown inclination. We present all these results in Table8.
The obtained BH mass estimate is in agreement with the mass limits derived based on the X-ray turnoff (104 M
≤
MBH ≤ 2 × 10⁶ M , Pasham et al.2015) as well as using the
method of estimate of a BH mass upper limit applying the X-ray variability timescale, 5 × 10⁷M (see Pasham et al.2015).
Fur-thermore, Pasham et al. (2015) assumed that the TDE source optical flux is dominated by the host galaxy and they con-strained the BH mass of the central SMBH using the well-known bulge luminosity as a function of BH mass relations (e.g., Lauer et al.2007). As a result they inferred the SMBH mass of about MBH ∼ 3 × 10⁷ M , which is consistent with our BH mass
esti-mates using the scaling technique.
We derived the bolometric luminosity, based on the normal-ization of the BMC model, in the range of 1044–1045 erg/s (as-suming isotropic radiation). The relatively high isotropic bolo-metric luminosity of Swift J2058+05 in the first weeks after the initial outburst is the main argument for a TDE as an ori-gin of this phenomenon because the host galaxy was not known as an AGN before the flare. In particular, Pasham et al. (2015; see the top panel in their Fig. 1) and Komossa (2015) specu-lated that Lpeakbol ∼ 3 × 1047 erg/s, and they estimated that the BH mass, MBH > 107 M which is similar to our scaling
tech-nique estimate (our inferred luminosity at the maximum for Swift J2058+05 is close to the Eddington limit for a 107 solar
masses BH, see Sect. 4.1.1).
The relatively low electron temperatures, kTe ∼ 4–10 keV
(see also Table 5; lower part) are obtained using CompTB model and the RXTE data for Swift J2058+05 spectra (see Sect. 3.2.2) For such a low Te the effective scattering
cross-section, hσi is about of the Thomson one, σT (see, for example
Titarchuk et al. 2014) and consequently, the critical luminosity is close the Eddington one.
4.2. Comparison of spectral and timing characteristics of TDE sources Swift J2058+05 and Swift J1644+57 Because of the many similarities between Swift J2058+08 and SwiftJ1644+57,Cenko et al.(2012) suggested a similar outburst mechanism, consistent with multi-wavelength follow-up obser-vations (Pasham et al.2015). Below, we present a comparison of
these sources in terms of spectral and timing properties to further reveal the similarities and the differences between TDE sources SwiftJ2058+05 and Swift J1644+57.
4.2.1. Saturation levels of the photon index
The TDE sources Swift J2058+05 and Swift J1644+57 demon-strate a similar behavior of the photon index versus mass ac-cretion rate (or our BMC normalization). The saturations of the photon index occurs at the same saturation levelΓsat ∼ 1.8 for
both of these sources.
4.2.2. Difference of the electron temperature ranges in Swift J2058+05 and Swift J1644+57
A comparison of the best-fit spectral parameters for these two TDE sources shows that the ranges of seed (disk) temperatures are similar for both of these objects, namely, kTs= 100–400 eV
(see Tables 4, 6). On the other hand, values of the electron tem-perature kTe are quite different. These values, kTe vary in a
wide range up to kTe = 35 keV for Swift J1644+57, while for
SwiftJ2058+05 kTethey are between 4 keV and 10 keV. The
rea-son for this difference of temperature ranges is not so obvious but we can suggest that the soft (disk) photon emission is stronger in SwiftJ2058+05 than that in the case of Swift J1644+57 and thus, kTeare lower in Swift J2058+05 than that in Swift J1644+57.
4.2.3. Similarity of timing characteristics during decay phases in Swift J2058+05 and Swift J1644+57 Similarly to Swift J1644+57, the lightcurve of Swift J2058+05 shows an abrupt drop during 250–300 days (see, e.g., Cenko et al. 2012; Pasham et al. 2015) while secular decline is de-scribed by different decay rates. More specifically, the decline in flux of Swift J1644+57 is consistent with the t−1.5−1.67 (Bloom
et al. 2011; Levan et al. 2011; Mangano et al. 2016), while that for Swift J2058+05 is consistent with t−2.2 (Cenko et al.
2012). The reason for this difference for flux decline rates is not clear up to now but it can be associated with different out-flow plasma conditions in these two sources. The count rate in SwiftJ2058+05 decreases by a factor of 150 (see Fig.2) which is comparable with that in Swift J1644+57, a factor of ∼100 de-cline, (see Levan & Tanvir 2012; Sbarufatti et al.2012; Zauderer et al.2013).
Notably, in both of these sources, the X-ray dimming oc-curs on a similar timescale after disruption. In the case of Swift J1644+57, Zauderer et al. (2013) argued that this sud-den decrease in the flux is caused by the drop of an accretion flow from a super-Eddington to a sub-Eddington rates. Using nu-merical simulations by Evans & Kochanek (1989) and De Colle et al. (2012) one can support this scenario. We note that apply-ing the abrupt flux change, Pasham et al. (2015) constrained the black hole mass MBHin the range of 104 M to 2 × 10⁶ M in
SwiftJ2058+05.
4.2.4. Comparison of spectral evolution as a function of the normalization for Swift J2058+05 and Swift J1644+57
We can also compare spectral parameter evolution for SwiftJ2058+05 and Swift J1644+57 using the BMC normaliza-tion. We note that the distances to these sources are different (see Table 8). Specifically, for Swift J2058+05 the distance is about
3.7 Gpc, whereas for Swift J1644+57 it is 1.5 Gpc. In Fig.12, we show correlations of BMC normalization, presumably pro-portional to mass accretion rate, and the photon indexΓ for these two TDE sources. Swift J1644+57 demonstrates a wider range of BMC normalization with a longer saturation part (by a factor of two higher than that for Swift J2058+05), while kTsare almost
the same for both sources (100–400 eV).
5. Conclusions
A stellar tidal disruption event (TDE) presents a new chance to estimate the mass of accreting supermassive black holes. The flare events occur after disruption of a star’s orbit at about ten of Schwarzschild radii from the central supermassive BH. A large amount of gas is suddenly injected close to a BH event horizon, as this stellar debris gets accreted (Giannios & Metzger 2011; van Velzen et al. 2011).
We find the transition from the high to low states observed in Swift J1644+57 and Swift J2058+05 during decay outburst phase using the set of Swift, Suzaku, and RXTE observations. We reveal a validity of the fits of the observed spectra using the BMC model for all observations, independently of the spectral state of the source.
We investigated the X-ray outburst properties of TDEs dur-ing the outbursts usdur-ing of hardness-intensity diagrams and the index-normalization (or ˙M) correlation, which were similar to those in Galactic BHs. In particular, we find that Swift J1644+57 approximately follows theΓ− ˙Mcorrelation previously obtained for the Galactic BHs, GRO J1655–40, GX 339–4, Cyg X–1 and 4U 1543–47 (see Fig.12). The photon index of Swift J1644+57 spectrum is in the range of Γ = 1.1–1.8. We also find that SwiftJ2058+05 approximately follows the Γ− ˙Mcorrelation ob-tained for the Galactic BH, GRO J1655–40, and Swift J1644+57. The photon index of the Swift J2058+05 spectra is in the range ofΓ = 1.2−1.8.
We used the observed index-mass accretion rate correla-tion to estimate MBH in Swift J1644+57 and Swift 2058+05.
This scaling method was successfully implemented to find BH masses of Galactic (e.g., ST09, STS14) and extragalactic black holes (TS16a,b; Sobolewska & Papadakis 2009; Giacche et al. 2014; TS17). We find that the compact objects, Swift J1644+57 and Swift J2058+05 are likely to be supermassive BHs with MBH≥ 7 × 10⁷ M and ≥2 × 10⁷M , correspondingly.
Acknowledgements. This research was done using the data supplied by the UK SwiftScience Data Centre at the University of Leicester. We appreciate Cristiano Guidorzi who raised a fair question on the origin of the TDE sources. Partic-ularly, we also acknowledge extensive discussion and critical points by Sergio Campana on the paper content, Pascal Chardonnet for useful discussions and comments and Partick Aurenche for editing of the paper. Finally, we recognize the thorough analysis of the paper by an anonymous referee.
References
Aliu, E., Arlen, T., Aune, T., et al. 2011,ApJ, 738, L30
Aleksic, J., Antonelli, L. A., Antoranz, P., et al. 2013,A&A, 552, A112 Belloni, T., & Motta, S. E. 2016, Astrophysics of Black Holes (Berlin
Heidelberg: Springer-Verlag),Astrophys. Space Sci. Lib., 440, 61 Belloni, T., Parolin, I., Del Santo, M., et al. 2006,MNRAS, 367, 1113 Bennert V. N., Auger M. W., Treu T., Woo J.-H., & Malkan M. A. 2011,ApJ,
726, 59
Berger, E., Zauderer, A., Pooley, G. G., et al. 2012,ApJ, 748, 36 Bloom J. S., Giannios, D., Metzger, B. D., et al. 2011,Science, 333, 203 Burrows, D. N., Kennea, J. A., Ghisellini, G., et al. 2011,Nature, 476, 421 Castro-Tirado, A. J., Gómez, J. L., Agudo, I., et al. 2013,EPJ Web Conf., 61,
01003
Cendes, Y., Wijers, R. A. M. J., Swinbank, J. D., et al. 2014, ArXiv e-prints
[arXiv:1412.3986]
Cenko, S. B., Krimm, H. A., Horesh, A., et al. 2012,ApJ, 753, 77
De Colle, F., Guillochon, J., Naiman, J., & Ramirez-Ruiz, E. 2012,ApJ, 760, 103
Evans, C. R., & Kochanek, C. S. 1989,ApJ, 346, L13
Evans, P. A., Beardmore, A. P., Page, K. L., et al. 2007,A&A, 469, 379 Evans, P. A., Beardmore, A. P., Page, K. L., et al. 2009,MNRAS, 397, 1177 Farinelli, R., Titarchuk, L., Paizis, A., & Frontera, F. 2008,ApJ, 680, 602(F08) Giacche, S., Gili, R., & Titarchuk, L. 2014,A&A, 562, A44
Giannios, D., & Metzger, B. D. 2011,MNRAS, 416, 2102
González-Rodriguez, A., Castro-Tirado, A. J., Guerrero, M. A., & Castellón, A. 2014, in Rev. Mex. Astron. Astrofis. (Serie de Conferencias), 45, 73 Graham, A. W. 2012,ApJ, 746, 113
Greene, J., Bailyn, C. D., & Orosz, J. A. 2001,ApJ, 554, 1290
Herrero, A., Kudritzki, R. P., Gabler, R., Vilchez, J. M., & Gabler, A. 1995, A&A, 297, 556
Hjellming, R. M., & Rupen, M. P. 1995,Nature, 375, 464
Homan, J., Wijnands, R., van der Klis, M., et al. 2001,ApJS, 132, 377 Jahnke, K., & Maccio, A. V. 2011,ApJ, 734, 92
Jonker, P. G., & Nelemans, G. 2004,MNRAS, 354, 355
Kalberla, P. M. W., Burton, W. B., Hartmann, D., et al. 2005,A&A, 440, 775 Kennea, J. A., Romano, P., Krimm, H. A., et al. 2011,ATel, 3250, 1 Komossa, S. 2015,J. High Energy Astrophys., 7, 148
Krimm, H. A., Tomsick, J. A., Markwardt, C. B., et al. 2011,ApJ, 735, 104 Lauer, T. R., Faber, S. M., Richstone, D., et al. 2007,ApJ, 662, 808 Laurent, P., & Titarchuk, L. 1999,ApJ, 511, 289(LT99)
Laurent, P., & Titarchuk, L. 2011,ApJ, 727, L34
Levan, A. J., Tanvir, N. R., Cenko, S. B., et al. 2011,Science, 333, 199 Liang, E. W., & Liu, H. T. 2003,MNRAS, 340, 632
Mangano, V., Burrows, D. N., Sbarufatti, B., & Cannizzo, J. K. 2016,ApJ, 817, 103
Migliari, S., & Fender, R. P. 2006,MNRAS, 366, 79 Miller, J. M., & Gultekin, K. 2011,ApJ, 738, L13
Munoz-Darias, T., Casares, J., & Martnez-Pais, I. G. 2008,MNRAS, 385, 2205 Munoz-Darias, T., Fender, R. P., Motta, S. E., & Belloni, T. M. 2014,MNRAS,
443, 3270
Ninkov, Z., Walker, G. A. H., & Yang, S. 1987,ApJ, 321, 425 Park, S. Q., Miller, J. M., McClintock, J. E., et al. 2004,ApJ, 610, 378 Park, T., Kashyap, V. L., Siemiginowska, A., et al. 2006,ApJ, 652, 610 Pasham, D. R., Cenko, S. B., Levan, A. J., et al. 2015,ApJ, 805, 68 Rees, M. J. 1988,Nature, 333, 523
Reis, R. C., Miller, J. M., Reynolds, M. T., et al. 2012,Science, 337, 949 Saxton, C. J., Soria, R., Wu, K., & Kuin, N. P. M. 2012,MNRAS, 422, 1652 Sbarufatti, B., Burrows, D. N., Gehrels, N., & Kennea, J. A. 2012,ATel, 4398, 1 Seifina, E., & Titarchuk, L. 2010,ApJ, 722, 586
Shaposhnikov, N., & Titarchuk, L. 2006,ApJ, 643, 1098(ST06) Shaposhnikov, N., & Titarchuk, L. 2009,ApJ, 699, 453(ST09) Shrader, C. R., Titarchuk, L., & Shaposhnikov, N. 2010,ApJ, 718, 488 Silk, J., & Rees, M. J. 1998,A&A, 331, L1
Sobolewska, M. A., & Papadakis, I. E. 2009,MNRAS, 399, 1997 Titarchuk, L., & Seifina, E. 2009,ApJ, 706, 1463
Titarchuk, L., & Seifina, E. 2016a,A&A, 595, A101(TS16a) Titarchuk, L., & Seifina, E. 2016b,A&A, 585, A94(TS16b) Titarchuk, L., & Seifina, E. 2017,A&A, 602, A113 Titarchuk, L., & Zannias, T. 1998,ApJ, 499, 315(TZ98)
Titarchuk, L., Mastichiadis, A., & Kylafis, N. D. 1997,ApJ, 487, 834 Titarchuk, L. Seifina, E., & Shrader, C. 2014,ApJ, 789, 98
Usui, R., & Kawai, N. 2015,Proc. Int. Symp. Nanoscience and Quantum Physics 2012, JPS Conf. Peoc., 4, 01003
van Velzen, S., K¨ording, E., & Falcke, H. 2011,MNRAS, 417, L51
Wiersema, K., van der Horst, A. J., Levan, A. J., et al. 2012,MNRAS, 421, 1942 Wright, E. L. 2006,PASP, 118, 1711
Zauderer, B. A., Berger, E., Soderberg, A. M., et al. 2011,Nature, 476, 425 Zauderer, B. A., Berger, E., Margutti, R., et al. 2013,ApJ, 767, 152