Introduction
In the last fifty years, global aquaculture production has greatly increased, reaching in 2016, 80 millions of tones, with an increas-ing number of products for direct human consumption, represent-ing 47% of the total, and 53% if not human food uses are excluded *Corresponding author: Mauro Lenzi, Lagoon Ecology and Aquaculture Labo-ratory, World Wide Fund, Orbetello, Italy, Tel: 39 3331090723; E-mail: lealab1@ gmail.com
Citation: Lenzi M, Gennaro P, Franchi E, Marsili L (2019) Assessment of Fish-Farms Wastewaters Synergistic Impact on a Mediterranean Non-Tidal Lagoon. J Aquac Fisheries 3: 021.
Received: July 21, 2019; Accepted: July 26, 2019; Published: August 02, 2019 Copyright: © 2019 Lenzi M, et al. This is an open-access article distributed un-der the terms of the Creative Commons Attribution License, which permits unre-stricted use, distribution, and reproduction in any medium, provided the original author and source are credited.
(e.g. fishmeal and fish oil) [1]. 89% of this production takes place in Asia. In Europe and North America, aquaculture development was rapid between the 1980’s and 1990’s, but then slowed down, proba-bly due to regulatory restrictions and market competition factors [2]. Although the percentage increases in annual production growth are lower than five years ago, in countries where production is high, these percentage increases mean a strong increase in terms of tones of prod-uct. Aquaculture is certainly destined to continue its growth and to largely replace fishing of the wild product, which can no longer meet the demands of the world population which greatly increased during the last fifty years.
During the period 1995 to 2015, production of farmed aquatic species reliant on feeds increased more than fourfold, from 12 to 51 million tonnes, and today, 66% of total global aquaculture production (excluding aquatic plants) is produced using exogenous feed, mostly commercially manufactured. In fact, in the same period, production of industrial aquaculture feeds increased sixfold, from 8 to 48 mil-lion tonnes. However, the proportion of fish from capture fisheries being reduced to fishmeal and fish oil has been declining in recent decades, and it is projected that a growing share of fishmeal and fish oil production will be obtained from fish processing co-products, such as fish carcasses. Furthermore, the dietary inclusion rates of fishmeal and fish oil in aquaculture feeds have also been falling, increasingly replaced by crops, especially oilseeds [1,3]. Much research is being directed into novel aquaculture feedstuffs, including seaweed and in-sect sources, but it is likely to be some years before these become widely available and affordable [4,5]. Despite the efforts to make aquaculture more sustainable, energetically more advantageous and environmentally friendly solutions will have to be studied and found necessary [6].
Moreover, the impact of aquaculture, in its different forms, on the host environment must be seriously considered. The coastal areas, also due to the contribution of aquaculture, have been subjected to a growing eutrophication with dramatic variations in the benthic com-munities, with the death of fish and enormous microalgal and mac-roalgal developments [7-10]. In marine finfish aquaculture, according to [11], for recently formulated feeds, 69 kg of Nitrogen (N) and 10 kg of Phosphorus (P) are released into the environment per tonne of fish produced. The same researchers also estimated that future im-provements in feed production will lead in 2050 to a reduction in the Nitrogen (N) and Phosphorus (P) releases to 55 kg and 7 kg per ton of fish produced, respectively.
It is thus necessary to evaluate the impact of this practice on nat-ural ecosystems and how the latter react to stress. A more in-depth knowledge of this issue would allow better intervention to mitigate of the consequences more effectively.
In this study, we examined the impact of wastewater from two sea bass and sea bream land-based farms, which are released into a non-tidal coastal lagoon.
Lagoon environments, despite being environments of shallow wa-ters and poor water exchange compared to the nearby sea, have, in
Aquaculture & Fisheries
Review Article
Mauro Lenzi1*, Paola Gennaro2, Enrica Franchi3 and Letizia
Marsili3
1Lagoon Ecology and Aquaculture Laboratory, World Wide Fund, Orbetello, Italy
2ISPRA Italian Institute for Environmental Protection and Research, Leghorn, Italy
3Department of Physical Sciences, Earth and Environment, University of Siena, Siena, Italy
Assessment of Fish-Farms
Wastewaters Synergistic Impact
on a Mediterranean Non-Tidal
Lagoon
Abstract
The impact of wastewater from two fish farms affecting a coastal lagoon has been assessed for water quality, sediments and macroal-gae. Based on a previous study, three sampling areas of 135 hect-ares each were identified at increasing distance from the discharges and six monitoring surveys were carried out between May 2017 and November 2018. The results indicated macroalgal assemblages as the most suitable variables for assessing the impact of wastewater, since they showed a different species dominance in the three areas. No clear result emerged from sediments parameters due to the tex-ture variability, while water quality was significantly different only for nitrates and orthophosphates in one of the three areas. Probably due to the specific lagoon morphology and eutrophication manage-ment methods adopted, only one of the surveyed areas was clearly affected by the wastewater impact.
Keywords: Eutrophication; Fish-farm impact; Labile organic matter;
their community as a whole, a high resilience and a great capacity to integrate stress factors. However, since they are already perturbed environments, the stress produced by anthropic pressure, in our case the wastewater from the two fish-farms, in not easily distinguishable from the natural structural stress. This peculiarity is called estuarine quality paradox [12,13].
The aim of this study is to highlight a possible impact gradient of the wastewater of the two fish farms on the various compartments of the lagoon ecosystem, highlighting the best indicator variables of this type of impact. In the working hypothesis, the effects of this impact should decrease as the distance from the sources of waste release in-creases.
Materials and Methods
The study area and the fish-farms
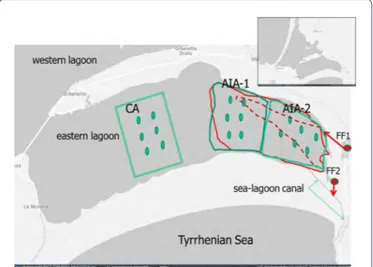
The examined area was the eastern basin of the Orbetello lagoon (Figure 1). The Orbetello lagoon is a shallow, eutrophic coastal wa-ter body of about 25.25 km2 in the southern Tuscan coast of Italy
(42°25’-42°29’ N, 11°10’-11°17’ E). Three artificial canals, 0.5-3 km long and 10-15 m wide, two in the western and one in the eastern ba-sin, connect the lagoon with the sea (Figure 1). Because they are small shallow canals, water turnover is poor and depends mainly on wind force and direction, as the Tyrrhenian tide range is narrow. The lagoon salinity ranges from 28 to 45 (practical salinity scale), depending on rainfall and evaporation.
The environment is eutrophic due to fish-farm wastewaters, inter-mittent streams containing agricultural run-off and civil effluent, and historical input stored in sediment [14]. Due to high nutrient avail-ability, morphology and low-water-turnover, this lagoon is subject to severe macroalgal proliferation, which can cause dystrophic crises with die-offs.
Owing to the low water renewal, sea water is pumped into the lagoon, between June and August, to promote water turnover, with
input by two western pumping stations, at the mouth of the two we-stern channels, and output by the eawe-stern canal. This input creates a continuous one-way flow of about 13.000 L s-1, with a weak speed of
1.0-1.5 cm s-1. Although this water mass is relatively high, it follows
short routes and does not allow sufficient water turnover in large part of the stagnating areas of the two basins, in shadow of this flow. Therefore, in the summer months, in the eastern basin, the pumped waters coming from the western basin flow out towards the sea, with a very low flow velocity that can be hindered by a strong wind and rising of the marine front, which determine a consequent increase in the level of lagoon waters [15].
Two land based fish-farms discharge the wastewater in the ea-sternmost part of the eastern basin, one (FF1) near the sea-lagoon channel, the other (FF2) in the middle of the same channel (Figure 1). Therefore during the pumping period it is probable that the FF1 wastewater is carried out by the outflow towards the sea and cannot extend much beyond the discharge area, while the FF2 wastewater flows mainly towards the sea, except for the periods in which a wind of contrast raise the sea front and let the waters enter from the sea, raising the lagoon level. In the remaining nine months, according to a study that used the CORMIX hydrodynamic model [16], the FF1 discharge mixes more and is removed towards the more central areas of the east basin, while the FF2 discharge follows the tidal flow, en-tering the lagoon at high tide. According to this study, the influx of wastewater extended towards the innermost areas of the east basin, along an extended brush about 1.8 km (Figure 1).
The two fish-farms breed sea-bass (Dicentrarchus labrax L.) e sea-bream (Sparus aurata L.), using water with salinity varying be-tween 15 and 30, obtained by pumping from wells on brackish aqui-fers, which, due to a geothermal anomaly, are at constant temperature of 18-20°C.
FF1 consists of about 42 ground tanks covered in PVC of 400-600 m3 for a total of 22.400 m3 and a stream of outgoing waters of 560 L
s-1, FF2 consists of 45 ground tanks covered in PVC with dimensions
and volumes similar to the previous ones, for an outgoing flow of 420 L s-1.
Overall, fish production is 700-800 tonnes a-1. Both fish farms are
equipped with a system of small basins and sewage settling channels, for an extension of about 2 ha each, in which detritivorous fish (mug-ilids) are placed and where microalgae and macroalgae develop.
The experimental design
To identify the lagoon area subject to the impact of fish farm wastewater (area for impact assessment, AIA), the study by Franchi, et al., [16] was used. We hypothesized a possible extension of the influence of wastewater on the entire area between the two lagoon coasts that include the extension of the brush of influence established by the CORMIX model. Considering about 2 km this plume, the area of interest was about 270 hectares (Figure 1). Within AIA, two areas of 135 hectares each have been identified, AIA-1 and AIA-2, the sec-ond closer to the sources of impact. A third area of the same extension and more than 1 km away from the nearest margin of AIA-1, was selected as a control (CA) (Figure 1).
Three different compartments of the lagoon ecosystem have been considered: Water, sediment and macroalgae. The characterization of
Figure 1: The Orbetello lagoon (Tuscany coast, Italy) and its eastern basin. Green
squares, CA, AIA-1 and AIA-2 areas for sampling of water, sediment and macroalgal variables; green points, stations for water and sediment sampling. Red points and ar-rows, fish farms FF1 and FF2, and effluents of wastewaters; red line, area that has been hypothesized in this study to be affected by the wastewater; red dotted line, hydrody-namics wastewater propagation estimated by CORMIX model (Franchi et al., 2009).
the three compartments took place in May 2017, in condition of in-coming tide, aiming to highlight the wastewater dispersion towards the eastern lagoon centre. According to the results of May 2017, only macroalgae and sediment has been the subject of subsequent 5 cam-paigns: November 2017 and February, May, September, and Novem-ber 2018.
Sampling and Analytical Determinations
Water column
In each of the 3 selected eastern lagoon areas (AIA-1, AIA-2 and CA), 6 sampling and measurement points were identified, arranged along two parallel transects (Figure 1). In May 2017, using a mul-ti-parameter probe, Temperature (T, °C), pH, Salinity (S, psu), Dis-solved Oxygen (DO, mg L-1) and Nephelometric Turbidity (NTU)
were measured in duplicate in each point. Water samples were then taken in duplicate in the same points and at the exit of the two fish farm wastewaters (FF1, FF2). Water samples were stored in a li-ght-free and refrigerated environment, and then transported to the laboratory in a few hours for analytical determinations. Samples were filtered at 0.45 µm and the following analytical determinations were conducted: Ammonium nitrogen (N-NH4+), nitrous Nitrogen
(N-NO2), nitric Nitrogen (N-NO3), Total Dissolved Nitrogen (TDN),
Total Dissolved Phosphorus (TDP) and Soluble Reactive Phosphorus (SRP). The analyses were conducted according to APAT IRSA-CNR [17]. Dissolved Inorganic Nitrogen (DIN=N-NH4++N-NO2+N-NO3),
Dissolved Organic Nitrogen (DON=TDN-DIN), Dissolved Organic Phosphorus (DOP=TDP-SRP) and the atomic ratio DIN:SRP were then computed.
Sediment
To determine sedimentary content of organic Carbon (C), Nitro-gen (N) and Phosphorus (P), in the same water sampling points (Fig-ure 1), sediment samples were taken in May 2017, with a horizontal core drill, able to collect in the surface layer of the first 3-4 cm, using a 60 mL syringe. The sediment samples were transferred from the syringe into the polyethylene containers of the same volume and re-frigerated and subsequently frozen pending for analysis. The samples were dried to constant weight at 75°C, and then subjected to analyt-ical determinations. N and C were determined using an elementary analyser (CHN Thermoquest, model 1110), P according to Aspila, et al., [18]. Using the percentages of the three estimated macronutrients, the molar ratios C:N, C:P, N:P were subsequently calculated. To determine the amount of organic matter present in the lagoon sediments as a labile fraction (LOM), sediment samples were col-lected in the same points, using the previously described method, in November 2017 and February, May, September and November 2018. The determination was carried out as combustion at 250°C in a muffle after reaching the constant dry weight (75°C) [19].
In February 2018, 3 samples were collected per area using the ho-rizontal sampler, in order to define the texture of the first 3-4 cm of the sediments, in the sand, silt and clay components.
In November 2018, the detrital fraction >1 mm (cd) dried at 75°C, essentially consisting of shell debris, was considered for all sediment samples and was calculated as a percentage of the total of the sam-ple according to the following equation: cd% = fraction>1mm*100: (fraction<1mm+fraction>1mm).
Macroalgae
In May and November 2017 and in February, May, September and November 2018, in each of the 3 areas, the number of macroalgal species present and the overall biomass were determined.
The Total Coverage (CT) of the substrate by the algal mats was estimated through Sentinel-2 satellite images obtained from the Land-Viewer site (EOS DATA ANALYTICS, USGS/NASA), and calculated through the Fiji-Image software. In the field, immediately following that of the available satellite image, the Biomass (b) was determined by collecting the plant material contained in a 60*60 cm panel lowered to 6 points per area, distributed according to the satel-lite images.
The material collected inside the box was drained for a few minu-tes and weighed in field with a portable electronic scale with a sen-sitivity of ±0.5 g. The data obtained were transformed to the surface unit of 1 m2 (transformation factor 2.778) and expressed as kg wet
weight m-2. For the determination of Standing Crops (SC), the algal
mass present in a given lagoon surface at the time of detection, the following equation was applied: SC=b*CT*1000-1, where: SC is the
standing crop expressed in Tonnes Wet Weight (Tww); b, the biomass expressed in kgww m-2; CT, estimated total coverage with Fiji software
in m2; 1000-1, the factor for bringing the final value to tones.
On the basis of described samplings, the specific Dominance (d) per point-station and the percentage of opportunistic species (% os) on the total species observed were determined.
In May 2017, samples of the most widespread species, common to the selected areas, were collected in each of the three areas, to de-termine C, N, P content. These samples were washed with sea water to remove debris and other impurities, transferred into plastic bags, stored in the dark, refrigerated and transported to the laboratory in few hours. The material was then quickly washed with fresh water, dried with tissue paper, dried at 40°C in a dryer with ventilation, and then further cleaned of impurities and small animals. The sample was stored in polyethylene containers in a dry place, up to the la-boratory determinations. The analysis was carried out employing the same methods as described above for the sediment on samples dried to constant weight of 75°C. The molar ratios C:N:P and C:N were subsequently calculated.
Statistical Analysis
Chemical-physical variables and nutrient components in the water and sediment sand, calcareous shell debris (cd) and nutrient contents were analyzed by one-way ANOVA with area (CA, AIA-1, AIA-2, 3 levels) as fixed factor. Nutrient content of macroalgal thalli was ana-lyzed by the Student’s t-test in order to detect significant differences between the source (AIA-2) and Control (Ca) Areas.
LOM and biomass data were processed by two-way ANOVA to detect significant differences between the month (Nov17-Nov18, 5 levels for LOM; May17-Nov18, 6 levels for biomass) and area (CA, AIA-1, AIA-2; 3 levels) fixed and orthogonal factors.
Cochran’s C-test was used before each analysis to check for ho-mogeneity of variance [20], and datasets were transformed where necessary. The Student Newman Keuls (SNK) test was used for a
A regression analysis was performed in order to evaluate possible correlation between cd and LOM content in the sediment, with Oct-18 data-set (6 records per area). The degree of correlation between cd content of each studied area and the LOM one was calculated and reported as the squared correlation coefficient (determination coeffi-cient, R2).
All the statistical analysis was performed with the Statistica 10.0 software, and the critical value in all tests was P=0.05.
Results
Water column
In table 1, the means (± SD) of the chemical-physical variables (T, pH, S, DO, NTU) are reported for each area, for May 2017. In table 2, nutrients (N-NH4+, N-NO2, N-NO3, DIN, DON, TDN, SRP, DOP,
TDP; expressed in µM) and atomic ratio DIN:SRP means (±SD) are reported for each lagoon area and for the two fish farm wastewaters as a reference for nutrient sources.
The ANOVA analysis showed a significant effect of the area factor on the variables T, S, DO and NTU (P=0.0023, P<0.0001, P=0.0030, P=0.0012, respectively). The post hoc SNK showed significantly hi-gher T values towards the sources (AIA-2), compared to the other two areas (CA=AIA-1), while the S values were significantly lower in AIA-2 (P<0.01). DO was significantly lower in CA than the other two areas (P<0.01) (AIA-1=AIA-2); for NTU, each area was significantly different from the other, with higher values in AIA-2 (P<0.01) and lower in AIA-1 (P<0.05).
For nutrients, ANOVA showed a significant effect of the area only for N-NO3, SRP and DIN:SRP (P=0.0072, P=0.0122, P=0.0289,
respectively). With the post hoc SNK, N-NO3 values resulted
signi-ficantly lower in CA than in AIA-1 (P<0.05) and AIA-2 (P<0.01), while the two AIA areas were similar. The SRP values in CA and AIA-1 were significantly lower than in AIA-2 (P<0.01, P<0.05, re-spectively), while the values of CA and those of AIA-1 were similar. The values of DIN:SRP were significantly higher in CA than in AIA-2 (P<0.05).
Sediment
Table 3 shows the means (±SD) of the percentages of sand, silt and clay on sediment samples dried at constant weight at 75°C collected in February 2018, and the percentages of carbonate concretions (cd) obtained from samples collected in November 2018. The amount of sand in sediment was significantly different in all three areas exami-ned (P<0.01), with the highest values in AIA-2 and lower values in AIA-1. The quantities of cd were significantly higher in the two AIA areas than in the control area (P<0.05), with the highest values in AIA-2.
Table 4 shows the means (±SD) of C, N, P content and the relative molar ratios C:N, C:P and N:P for the May-17 sampling. ANOVA showed a significant effect of the area factor only on the variables C:P and N:P (P=0.0003 e P<0.0001, respectively). With the post hoc SNK, the estimated values in AIA-2 for these two variables were significantly lower (P<0.01) than those found in the other two areas (CA=AIA-1).
The percentages (±SD) of Labile Organic Matter (LOM) in sed-iment are shown in table 5, for the period from November 2017 to November 2018. ANOVA showed a significant effect of the area fac-tor (P<0.0001), and the post hoc SNK showed lower values in AIA-2 (P<0.01) compared to the other two areas.
sand silt clay cd
% % % %
CA 79.80±0.50 14.60±0.10 5.60±0.40 10.57±5.26 AdI-1 78.65±0.45 14.30±0.20 7.05±0.25 17.44±11.19 AdI-2 84.40±0.50 9.45±0.85 6.15±0.35 30.75±15.81
Table 3: Percentages of sand (>63 µm), silt (63-4 µm) and clay (<4 µm) present in
the sediments (on driedmatter to constant weight) collected in February 2018 in the control area, CA, and in the two areas of interest, AdI-1 e AdI-2. Percentage of shell debris (cd) present in the sediments of the three areas collected in November 2018.
CA AIA-1 AIA-2 T 22.32±0.13 23.03±0.34 23,92±0.95 pH 9.15±0.22 9.19±0.05 9,06±0.17 S 37.00±0.82 34.75±0.99 26,17±4.14 DO 6,27±1.00 8.42±1.06 9,20±1.41 NTU 1.58±0.43 0.98±0.28 2,88±1.10 CA AIA-1 AIA-2 FF1 FF2 N-NH4 35.63±18,01 27.52±22.53 11.86±13.34 142.61±14.54 103.68±3.46 N-NO2 0.27±0.45 0.07±0.00 1.15±1.55 20.61±0.11 8.46±0.12 N-NO3 40.38±1.32 45.45±3.57 48.06±4.28 127.60±0.96 50.18±0.18 DIN 76.29±19.25 73.05±21.06 61.07±15.93 290.82±15.61 162.32±3.39 TDN 848.40±186.97 766.25±399.08 685.88±175.86 344.36±12.79 654.39±2.75 DON 772.12±190.91 693.20±407.22 624.81±172.02 53.54±2.82 492.07±0.64 TDP 0.35±0.26 0.60±0.53 0.80±0.34 8.58±1.11 6.08±0.37 SRP 0.07±0.08 0.15±0.13 0.42±0.27 7.45±0.77 5.04±0.02 DOP 0.23±0.20 0.45±0.57 0.38±0.10 1.12±0.34 1.04±0.39 DIN/SRP 2103±1067 1399±1272 285±302 39±2 32±1
Table 1: Means±SD of temperature (T, °C), pH, Salinity (S, psu), Dissolved Oxygen,
in mg L-1 (DO), redox (Eh; mV) and Nephelometric Turbidity Unit (NTU) conduct-ed in the plots CA, AIA-1, AIA-2 (6 measures per plot), in May 2017.
Table 2: Determination in µM of ammonium Nitrogen (N-NH4+), nitrous Nitrogen
(N-NO2), nitric Nitrogen (N-NO3), Dissolved Inorganic Nitrogen (DIN), Total Dissolved
Nitrogen (TDN), Dissolved Organic Nitrogen (DON), Total Dissolved Phosphorus (TDP), Soluble Reactive Phosphorus (SRP), Dissolved Organic Phosphorus (DOP), and DIN:SRP atomic ratio estimated in the water samples collected in the CA, AIA-1, AIA-2 areas and in the FF1 and FF2 fish-farms wastewater, in May 2017.
CA AIA-1 AIA-2 %C 4.40±2.57 6.48±0.28 5.10±2.69 %N 0.52±0.32 0.73±0.04 0.52±0.32 %P 0.04±0.02 0.06±0.01 0,09±0.05 C:N 10.87±2.90 10.34±0.65 14.60±3.22 C:P 287.18±62.53 280.22±23.14 163.48±31.82 N:P 27.15±2.99 27.14±1.94 12.23±3.62
Table 4: Carbon (C), Nitrogen (N) and Phosphorus (P) content, in percentage (%),
on sedimentary matter of the three study areas (CA, AIA-1, AIA-2), collected in May 2017 and dried to constant weight at 75°C, and related C:N, C:P, N:P atomic ratios.
As shown in figure 2, an inverse correlation between LOM and Carbonate Debris (cd) content was found. Although the degree of correlation was R2=0.3437, the regression was significant (F=10.34;
P=0.0054), indicating a significant loss of LOM at the increasing cd content in the sediment.
Seaweed
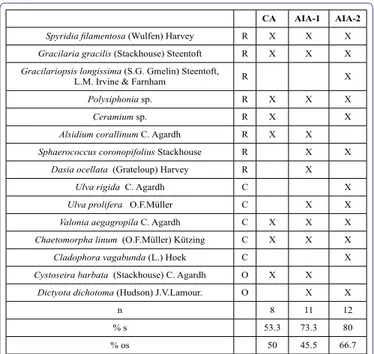
Table 6 shows the floristic list of the observed species and the number of opportunistic species present in each area, during the whole survey. The total number of macroalgal species increases from CA (n=8) to AIA-2 (n=12) as well as the number of opportunistic spe-cies. The latter were 50% and 45% of the species present in CA and in AIA-1, respectively, and 67% of those in AIA-2.
In table 7, the average (±SD) of the biomass (b, kg wet weight m-2), the corresponding Standing Crop (SC, in Tww), the total
cover-age in hectares compared to the overall surface of each area (CT, es-timated using Fiji software) and the dominant species (d) are reported for each area and for each survey. The time course of SC for the three areas is shown in figure 3.
17-Nov 18-Feb 18-Jun 18-Sep 18-Nov
LOM CA 9.36±3.19 11.63±3.08 11.57±1.36 9.50±1.21 10.50±3.46 AIA-1 11.94±3.93 10.31±1.95 12.80±4.72 12.70±5.15 10.64±4.17 AIA-2 7.56±0.73 8.21±0.53 8.82±1.87 7.72±0.51 7.26±2.23
Table 5: Labile Organic Matter (LOM) % content on sedimentary matter, dried to
constant weight at 75°C, of the three study areas (CA, AIA-1, AIA-2), collected during the 6 sampling trials, between November 2017 and November 2018.
Figure 2: Regression analysis performed in order to evaluate possible correlation
between calcareous shell debris (cd%) and Labile Organic Matter (LOM%) content in the sediment, with November 2018 data-set (6 records per area, 18 in total).
y = -0,1402x + 12,785 R² = 0,3437 5 7 9 11 13 15 17 19 0 10 20 30 40 50 LOM cd CA AIA-1 AIA-2
Spyridia filamentosa (Wulfen) Harvey R X X X
Gracilaria gracilis (Stackhouse) Steentoft R X X X
Gracilariopsis longissima (S.G. Gmelin) Steentoft,
L.M. Irvine & Farnham R X
Polysiphonia sp. R X X X
Ceramium sp. R X X
Alsidium corallinum C. Agardh R X X
Sphaerococcus coronopifolius Stackhouse R X X
Dasia ocellata (Grateloup) Harvey R X
Ulva rigida C. Agardh C X
Ulva prolifera O.F.Müller C X X
Valonia aegagropila C. Agardh C X X X
Chaetomorpha linum (O.F.Müller) Kützing C X X X
Cladophora vagabunda (L.) Hoek C X
Cystoseira barbata (Stackhouse) C. Agardh O X X
Dictyota dichotoma (Hudson) J.V.Lamour. O X X
n 8 11 12 % s 53.3 73.3 80 % os 50 45.5 66.7 CA AIA-1 AIA-2 17-May b 1,04±0,86 0,93±0.62 3,15±1,85 CT 0.58 0.68 0.82 SC 808 848 3468 d s, G>V S, G, E G>E, CH 17-Nov b 2,25±1,56 1,44±1.61 0.86±0.62 CT 0.68 0.57 0.66 SC 2617 1104 768 d a, V a, G, S S, a, CH 18-Feb b 0,60±0,88 0,41±0,32 0,37±0,39 CT 0.4 0.55 0.51 SC 322 306 257 d a, V G, S G 18-May b 1.89±0.69 3,14±1,02 4,51±2,53 CT 0.49 0.51 0.77 SC 1021 2331 3098 d a>S S>G, Cb G>>S 18-Sep b 2.31±1.23 2.25±1.61 0.94±0.36 CT 0.4 0.55 0.51 SC 1245 1672 647 d A S S, G 18-Nov b 0.67±0.25 3.06±1.99 0.88±0.16 CT 0.26 0.65 0.77 SC 234 2688 913 d a>CH>V S>a>G G, CH
Table 6: Floristic list of macroalgae observed in the 3 areas (CA, AIA-1, AIA-2) of
the eastern basin of the Orbetello lagoon, between May 2017 and November 2018. R, Rhodophyceae; C, Chlorophyceae; O, Ocrophyceae; n, number of species; X, presence of species; X in bold, opportunistic species; % s, percentage of species observed; % os, percentage of opportunistic species in each group.
Table 7: Macroalgal Biomass (b) in kg m-2, Standing Crop (SC) in tonnes wet weight
and dominant macroalgae (d) in the three areas of about 135 ha (CA, AIA-1, AIA-2), estimated in May and November 2017, and in February, May, September and November 2018. CH, Chaetomorpha linum; E, Ulva prolifera; S, Sphaerococcus coronopifolius; G, Gracilariaceae; s, Spyridia filamentosa; V, Valonia aegagropila; a, Alsidium corallinum.
Figure 3: Seaweed standing crop in Tonnes Wet Weight (TWW), between May 2017
As shown in table 7 and figure 3, in spring macroalgal biomass progressively increased from the CA control area to the AIA-2 area, where the biomass values were clearly higher than the other two areas. Two-way ANOVA showed a significant effect of the in-teraction between the factors month and area. In fact, the post-hoc SNK showed significant changes in biomass in May 2017 (CA=A-IA-1≠AIA-2, P<0.05) and in May 2018 (CA≠A(CA=A-IA-1≠AIA-2, P<0.01) due to the important algal developments in AIA-2, and in November 2018 for higher biomass values in CA and 1, compared to AIA-2 (P<0.05), while for the other 3 months the differences in biomass were not significant.
The pattern of biomass observed in the 3 areas, in the various sam-pling months, indicates that there were no significant biomass varia-tions for CA, while AIA-1 showed significant changes between Fe-bruary 2018 and May 2018 and November 2018 (P<0.05); AIA-2, on the other hand, confirmed a significant variation in the biomass betwe-en the two spring months and the remaining months (May-17≠N-ov-17, Feb-18, Set-18, Nov-18, P<0.05; May-18≠N(May-17≠N-ov-17, Feb-18, Set-18, Nov-18, P<0.01; the other months did not show significant differences between them).
The dominant vegetation was constituted by Gracilariopsis
lon-gissima>>Chaetomorpha linum>Ulva prolifera in AIA-2.
Elsewhe-re, a winter carpet of low thickness prevailed, consisting mainly of a mixture of Gracilaria gracilis and Spyridia filamentosa, alternating, in the other seasons, a higher biomass with high dominance of
Alsi-dium corallinum in CA, and Sphaerococcus coronopifolius in AIA-1
(Table 7).
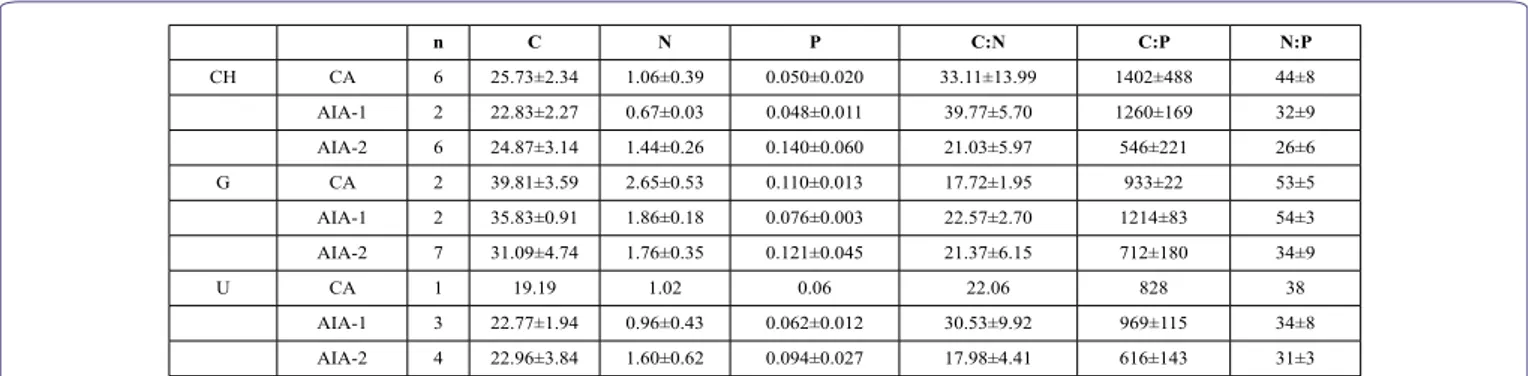
In table 8, number of analysed samples (n), means (±SD) of C, N, P content in dried matter of C. linum, U. prolifera and Gracilaria spp., and the relative molar ratios C:N:P are reported, for each area in the May 2017 survey.
The sample numbers allowed only for C. linum a macronutrients content comparison by Student T-test, between the areas CA and AIA-2. There were no significant differences for the carbon (P=0.6329) and nitrogen (P=0.0917) content, while a significantly higher pho-sphorus content was found in AIA-2, compared to CA (P=0.0108). C. linum and Gracilaria sp. showed similar C:N:P ratios in CA and in AIA-1, while lower values were found in AIA-2. The same result was found, though less markedly, for U. prolifera. Lowest C:N ratio were found in AIA-2 for C. linum and U. prolifera. Values of the
N:P ratio around 30, indicating P-limitation [21,22], were observed in CA for C. linum, more markedly in CA and AIA-1 for Gracilaria sp. and slightly in CA for U. prolifera.
Carbon content remained substantially stable for the various spe-cies with the variation of the area, and Gracilaria sp. had the highest content. N values were discordant, higher in AIA-2 for C. linum and
U. prolifera, but lower for the nitrophilous Gracilaria sp., while for
the first two the lowest values were estimated in AIA-1. P was marke-dly higher in all samples collected in AIA-2.
Discussion
Water
The results of the water analyses showed a wide variability not only between the three areas, but also between the various sampling points within the same area. This suggests the not homogeneity of wa-ter masses, subjected to local phenomena. On the other hand, hewa-tero- hetero-geneous data sets are typical of transitional waters and the assessment of environmental quality is often carried out considering wide ranges of variation [23].
Some significant variations, however, are highlighted for salinity and temperature. The two fish farm wastewaters lower the salinity (si-gnificant changes in AIA-2 compared to the other two areas), despite the proximity of a marine mouth, thereby contributing to countering summer evaporation and mitigating the temperature, counteracting excessive lowering in winter and raising in summer. This result, on the one hand highlights the poor marine turnover in the 9 months in which there is the natural flow of the tides, on the other it suggests that the mitigation of salinity conditions could affect macro and microal-gal growth, favoring it even in extreme seasons.
The fact that DO was found to be significantly lower in CA than in AIA areas in May 2017, could be the consequence of the significant increase in the presence of plant biomass in AIA-2, but, as in the case of NTU, which resulted significantly among all areas, many possible factors might have affected this result.
A gradient was detected for N-NO3 and SRP, with significant
in-crease towards AIA-2, especially for the last variable. The inin-crease in P in AIA-2, closer to the fish farms discharge, is the cause of the si-gnificant reduction in the DIN:SRP molar ratio in that area compared to the other two.
n C N P C:N C:P N:P CH CA 6 25.73±2.34 1.06±0.39 0.050±0.020 33.11±13.99 1402±488 44±8 AIA-1 2 22.83±2.27 0.67±0.03 0.048±0.011 39.77±5.70 1260±169 32±9 AIA-2 6 24.87±3.14 1.44±0.26 0.140±0.060 21.03±5.97 546±221 26±6 G CA 2 39.81±3.59 2.65±0.53 0.110±0.013 17.72±1.95 933±22 53±5 AIA-1 2 35.83±0.91 1.86±0.18 0.076±0.003 22.57±2.70 1214±83 54±3 AIA-2 7 31.09±4.74 1.76±0.35 0.121±0.045 21.37±6.15 712±180 34±9 U CA 1 19.19 1.02 0.06 22.06 828 38 AIA-1 3 22.77±1.94 0.96±0.43 0.062±0.012 30.53±9.92 969±115 34±8 AIA-2 4 22.96±3.84 1.60±0.62 0.094±0.027 17.98±4.41 616±143 31±3
Table 8: Carbon (C), Nitrogen (N), Phosphorus (P) percentage content on macroalgal thalli dried to constant weight at 75°C, and related atomic ratio (C:N:P; C:N), of Cha-etomorpha linum (CH), Gracilariaceae not determined (G) and Ulva prolifera (U), collected in CA, AIA-1, AIA-2 areas, in May 2017. n, number of records.
As can be seen from table 2, N-NH4+, N-NOx and DON conveyed
with fish-farms wastewater were 42%, 37% and 16% for FF1, and 16%, 9% and 75% for FF2, respectively. These decidedly different percentages between the two fish-farms, although they breed the same species at the same densities, could be due to the different conforma-tion of the settling basins and canals and to their dynamics, so it is possible that uptake or release processes and decomposition of plant masses take place at different times and quantities. Among the inorga-nic chemical species, N-NH4+ is normally dominant in fish-farm
wa-stewater, since it is the major excretion product of nitrogen from fish [24], however, in the three areas it showed large fluctuations in data sets and the averages are paradoxically decreasing towards the sour-ce. On the contrary, the oxidized form prevailed in the area closest to the wastewater. This could be due to an intense nitrification favored by the high DO values produced by macroalgae, moreover, the same macroalgae that in AIA-2 are present with Gracilaria-Gracilariopsis dominance, could have subtracted particularly ammonium at spring temperatures [25].
Giordani, et al. [26], have hypothesized that the environmental quality value for the variable DIN is inversely proportional to the va-lue of the variable itself. DIN vava-lues greater than 100 µM, correspond to the lowest quality (score=0), while values of DIN=0 µM to the highest quality (100). The same Authors suggested the best quality (100) is found at SRP=0 µM and the worst (0) at values >6 µM. Viar-oli, et al. [23] suggested that, for transition environments, the optimal condition for good productivity is in the range from 0 to 20 µM of DIN, although other Authors considered 20 µM the critical threshold for the coastal lagoons for this variable [27,28]. Therefore, the con-centrations of DIN in water found in the present study indicate scarce environmental quality in all three areas examined, including the con-trol area. In fact, the average values of DIN ranged from 61 to 76 µM, while SRP values were lower than 1 µM.
DIN abundance in all the examined areas resulted in very high values of the DIN:SRP atomic ratio, which progressively decreases moving closer to the source. This indicates P-limitation in all the three areas [21,22], including AIA-2, the nearest to the nutrient input of fish farm wastewaters, while only for the wastewater of the two fish farms DIN:SRP reached the lowest values (39 for FF1 and 32 for FF2). However, it is clear that high values of the DIN:SRP ratio in AIA-1 and AIA-2, do not express a real limitation of P, but a relative deficiency of P, an imbalance of abundance, since N concentrations were decidedly greater than P, which is not lacking.
DON, in all the areas, and DOP, to a lesser extent, were the most abundant components of dissolved nitrogen and phosphorus in the water column, varying between 87% and 91% of TDN and between 46% and 79% of TDP. High values of DON and DOP have been re-ported in other studies of this lagoon [29-31], and are probably a cha-racteristic of eutrophic environments with algal blooms, due to the release of cellular exudates and the presence of macromolecules that come from cell lysis, from the decomposition of plant masses and from bacterial extracellular enzymatic activities, in an environment that has a relatively modest water mass and abundant primary pro-duction. Different DON content in fish farms wastewater could be due to processes occurring in the settling basins.
Sediment
Nutrient concentrations in sediments showed a wide variability between the various sampling points within the same area, and between
the three areas, as in the case of the water column. The wide varia-bility does not allow to detect any nutrient gradient, not even for P, although C:P and N:P were significantly lower in AIA-2.
A significant difference was found for LOM between all the three areas, with unexpected higher values in CA and AIA-1 than in AIA-2. Higher values of LOM in areas more distant from the nutrient source, and the variability of nutrient data are probably due to the granulo-metric differences of the sediments of the sampling areas (Table 3). In fact, there is a significant inverse correlation between organic matter and Calcareous Detritus (cd) produced by shells (Figure 2), whose relative deficiency was probably the cause of the highest LOM va-lues in CA and AIA-1. Sediments with sandy dominance and high quantities of coarse shelled debris retain the organic components to a lesser extent and favor interstitial oxygen penetration enhancing ni-trification/denitrification processes [32]. This was the case of AIA-2, the area with the lowest LOM content, while the highest LOM values in AIA-1 and in CA were probably due to a relative lower content of sand. Sand was lower in AIA-1 than in CA, but the first had higher values of shell debris. These results did not allow identifying the fish farms input as a source of LOM that seems mainly due to the lagoon intrinsic dynamics.
Phosphorus in sediments is present as insoluble orthophosphate adsorbed by other mineral components [33,34]. It is probable the high variability in P accumulation, that was found within a same area and among the three areas, could be also attributable to the variable gra-nulometry of the sediment.
N:P molar ratio in CA and AIA-1 sediments was similar to the average value of 30 estimated by Atkinson and Smith [21] in thalli of different macroalgal species, which would suggest that it derives di-rectly from the decay of masses macroalgal, as substantially confirm the molar ratios N:P in the algal thalli, a little more P-limited (Table 8). In AIA-2, the values were decidedly lower than 30, indicating, although without statistical support, a lower relative presence of N, which reflects the N:P values of the thalli, but where this value is due to a greater accumulation of P.
Seaweed
Macroalgae have provided clearer information than water and se-diment variables. The algal biomass, in fact, showed an evident si-gnificant spring increase in AIA-2 of at least 4 times higher than in CA and AIA-1 (Table 7). Occasional high developments were also estimated in these latter areas, in CA in Nov-17, in AIA-1 in Nov-18. The high-density spring masses in AIA-2 have caused the summer decay of the macroalgae and, therefore, have determined the presence of a significant biomass reduction in the other seasons, with a slow recovery due also to increase of turbidity of the waters due to con-sequent microphitic developments. The development of biomass in AIA-2 was local and not produced by accumulations of vegetation carried by the wind, since the nitrophilous rodophycea Gracilariopsis
longissima, the dominant species in AIA-2, has been observed only
in this area; also the nitrophilous chlorophycea Ulva prolifera, that, even if present in AIA-1 and observed in an CA, was abundant only in AIA-2. That these macroalgal developments are to be considered endogenous, and therefore to exclude wind transports of vegetable masses, is also confirmed by Lenzi, et al. [35], according to which the 270 hectares of AIA were substantially sheltered from strong winds able to affect the bottom layer and transport the masses.
In this lagoon basin, two marine species are commonly found,
Alsidium corallinum e Sphaerococcus coronopifolius, which seem to
well tolerate the eutrophic conditions, degenerating to a large extent during the hot season, but developing shortly afterwards. Although thalli may occasionally be found everywhere, they have two distinct areas in which development is dominant: A. corallinum, in CA and widens a little towards the westernmost part of the eastern basin; S.
coronopifolius, essentially in AIA-1. Therefore, the three areas of this
study are characterized by dominance of different three algal species. However, the presence of the sea-lagoon communication channel in AIA-2 further could confuse the picture because typically marine spe-cies can be found in AIA-2 and AIA-1 occasionally conveyed with the waters of the incoming tide, as is undoubtedly the case of the Rhodophyta Dasia ocellata observed in AIA-1 in May 2018. This horizontal distribution certainly cannot be random, also be-cause it is stable over time, as we have observed over the years (un-published data). Many factors may have affected this distribution: nutrients, salinity, sediment grain size, LOM accumulation, light ra-diation, hydrodynamism. Certainly, the nutrient intakes of fish farms may have contributed, as in part the N and P accumulations in thalli suggest, however the high nutritional availability can constitute a li-mit for many marine algal species, for which the optimal conditions are normally oligotrophy or mesotrophy, and they cannot tolerate lagoon eutrophy or hypertrophy due to continuous external nutrient inputs. Therefore, a relative nutritional abundance could be one of the factors that prevent the development of A. corallinum and S.
cor-onopifolius in AIA-2. However, these two species could be further
confined to their respective areas of dominance by salinity values. In fact, in CA there is salinity values similar to those of the near sea and quite stable, and in AIA-1 the values are a little lower and equally sta-ble; it is in AIA-2 that the salinity values are the lowest, with greater variability than the other two areas, which is also accompanied by a greater thermal rise (Table 1). This combination of factors, to which the fish-farm wastewaters contribute to a great extent, could favor the G. longissima competition in AIA-2 but cause its summer decay, while the other two species find more favorable conditions in the oth-er areas and result to survive to summoth-er criticality.
C. linum physiologically tends to P-limitation, so as soon as phos-phorus becomes available it accumulates this nutrient and then uses it when needed [36], therefore this behavior would explain its relative abundance in AIA-2, compared to the other two areas, although less competitive than G. longissima. Although the records were relatively few, both G. longissima and U. prolifera showed the highest value of P among all the samples analysed in AIA-2, highlighting a predispo-sition to eutrophication of these species.
Conclusion
In a non-tidal lagoon, water column and sediment can present lar-ge variations of environmental variables, both chemical-physical and nutritional, in a very complex dynamic, influenced by many factors: The wind thrust on the lagoon water masses; the tides, however weak; the sea front (sea level that lowers or rises following the wind di-rection, favoring the outflow of the lagoon waters towards the sea, or preventing it); the stratification of water masses with different thermal and salt characteristics; the sediment resuspension by wind and hu-man activities; the natural predisposition to eutrophication; sedimen-tary texture; bioturbation by the infauna and fish schools. All these
factors produce a complex picture and can hinder the source of impact whose environmental impact is to be established.
In the case under examination, the heterogeneous data sets did not allow, for all the considered variables, a clear assessment of the en-vironmental impact of the two fish-farm wastewaters in the area for impact assessment. For the dissolved nutrients in the water column, only N-NO3 and SRP were significantly higher, and DIN:SRP atomic
ratio significantly lower, in the area closest to wastewaters discharges, compared to control area. For the sediments, among all the variables, only C:P and N:P showed significant values in AIA-2 to support a nutrient impact. By contrast, LOM had significantly lower values in AIA-2, contrary to expectations. It was clear that the presence of de-trital organic matter is strongly influenced by sedimentary texture, which sees in AIA-2 greater presence of sand and limestone detritus and shell >1 mm, which favor both oxidation and removal.
Macroalgae, on the other hand, provided clearer information than water and sediments, both in terms of biomass, higher in the area closest to wastewaters discharges than in the other two areas, and in terms of the number of opportunistic species, more present in AIA-2. A different horizontal stratification of macroalgal species was highli-ghted in this study, with the dominance of G. longissima in AIA-2, S.
coronopifolius in AIA-1 and A. corallinum in CA, although for these
last two species it was not possible to establish if and to what extent their location depends on the influence of fish-farm wastewater. In a previous study concerning the influence of wastewater from urban treatment plant in the western basin of the same lagoon, a clearer horizontal stratification of nitrophilous and P demanding species was observed near the nutrient input.
Also for the tissue content of the C. linum thalli, it was possible to highlight a significant difference due to the higher levels of P in the thalli collected in AIA-2 compared to those collected in CA, and also the few records of the other two algal species have shown the same behavior; this suggests macroalgae can better highlight the contribu-tions of P, compared to sediment variables, due to the differences in texture. Eventually, the incidence of fish farm wastewaters on mac-roalgae seemed to occur predominantly in AIA-2 area.
However, even for submerged vegetation there can be numerous factors that can confuse, mask or amplify the extent of the impact. For example, even in other areas of the same lagoon, the wind can bring the pleustophytic algal masses away from the area of influence and accumulate in different areas; therefore it is necessary to take these factors into account.
This study suggests that the variables that can better and more quickly highlight a eutrophic anthropogenic impact in an already eu-trophic, low-turnover and shallow water environment, such as lago-ons or estuaries, are those related to macroalgal vegetation. The water and sediment variables require many sampling points, relatively long times and a complex study plan, with a strong uncertainty on the final result. On the contrary, the picture provided by the qualitative-quan-titative distribution of macroalgae and their content in tissue macro-nutrients can quickly provide a reliable assessment of the extent of anthropogenic impact.
Acknowledgment
The authors thanks to the fish-farms Il Vigneto Company and It-tima Nuova Company for the collaboration and information, and the Orbetello Pesca Lagunare Company for the availability of the boats.
References
1. FAO (2018) The State of World Fisheries and Aquaculture 2018. FAO, Rome, Italy.
2. Bostock J, McAndrew B, Richards R, Jauncey K, Telfer T, et al. (2010) Aquaculture: Global status and trends. Philos Trans R Soc Lond B Biol Sci 365: 2897-2912.
3. Tacon AGJ, Hasan MR, Metian M (2011) Demand and supply of feed in-gredients for farmed fish and crustaceans. FAO, Rome, Italy.
4. FAO (2012) The State of World Fisheries and Aquaculture 2012. FAO, Rome, Italy.
5. Troell M, Naylor RL, Metian M, Beveridge M, Tyedmers PH, et al. (2014) Does aquaculture add resilience to the global food system? Proc Natl Acad Sci U S A 111: 13257–13263.
6. Lenzi M (2013) The future of aquaculture. Journal of Aquaculture Re-search & Development 4: 106.
7. Hauxwell J, Valiela I (2004) Effects of nutrient loading on shallow sea-grass-dominated coastal systems: Patterns and processes. In: Nielsen SL, Banta GT, Pedersen MF (Eds). Estuarine Nutrient Cycling: The Influence of Primary Producers Pg no: 59-92.
8. Charlier RH, Morand P, Finkl CW, Thys A (2006) Green tides on the Brit-tany coasts. Environmental Research Engineering and Management 3: 52-59.
9. Liu D, Keesing JK, Xing Q, Shi P (2009) World’s largest macroalgal bloom caused by expansion of seaweed aquaculture in China. Mar Pollut Bull 58: 888-895.
10. Liu F, Pang S, Chopin T, Gao S, Shan T, et al. (2013) Understanding the recurrent large-scale green tide in the Yellow Sea: Temporal and spatial correlations between multiple geographical, aquacultural and biological factors. Mar Environ Res 83: 38-47.
11. Bouwman AF, Beusen, Overbeek AHW, Bureau CC, Pawlowski DP, et al. (2013) Hindcasts and future projections of global inland and coastal nitro-gen and phosphorus loads due to finfish aquaculture. Reviews in Fisheries Science 21: 112-156.
12. Dauvin JC (2007) Paradox of estuarine quality: Benthic indicators and indices, consensus or debate for the future. Mar Pollut Bull 55: 271-281. 13. Elliott M, Quintino V (2007) The estuarine quality paradox, environmental
homeostasis and the difficulty of detecting anthropogenic stress in natural-ly stressed areas. Mar Pollut Bul 54: 640-645.
14. Lenzi M, Palmieri R, Porrello S (2003) Restoration of the eutrophic Orbe-tello lagoon (Tyrrhenian Sea, Italy): Water quality management. Mar Pollut Bull 46: 1540-1548.
15. Aminti PL, Cappietti L, Tecchi MG, Venturini A (2003) Hydrodynamics of lagoons, a case study: The Orbetello lagoon. MEDCOAST03 - Sixth Inter-national Conference on the Mediterranean Coastal Environment, Florence, Italy.
16. Franchi E, Ferrara G, Birardi F, Volterrani M, Mocenni C (2009) Qua-litàglobaledeiprodottiittici di acquacoltura. Valutazionedeirefluiittici in relazionedegliobiettivi di qualitàdellanuovadirettivaeuropea in materia di tuteladelleacque e le relazioni con la qualità del prodotto finale. 248 pp. 17. APAT, IRSA-CNR (2003) MetodiAnalitici per le Acque. ISBN
88-448-0083-7, 1: 1153.
18. Aspila KI, Agemiam H, Chau ASY(1976) A semiautomatic method for the determination of inorganic, organic and total phosphate in sediments. Analyst 101: 187-197.
19. Loh PS (2005) An Assessment of the Contribution of Terrestrial Organic Matter to Total Organic Matter in Sediments in Scottish Sea Lochs. UHI Millenium Institute 350.
20. Underwood AJ (1997) Experiments in ecology. Their logical design and interpretation using analysis of variance. Cambridge University Press, Cambridge, UK 12: 410-411.
21. Atkinson MJ, Smith SV (1983) C:N:P ratios of benthic marine plants. Lim-nology and Oceanography 28: 568-574.
22. Wheeler PA, Bjornsater BR (1992) Seasonal fluctuations in tissue nitro-gen, phosphorus, and n:p for five macroalgal species common to the Pacif-ic Northwest coast. Journal of Phycology 28: 1-6.
23. Viaroli P, Bartoli M, Giordani G, Naldi M, Orfanidis S, et al. (2008) Com-munity shifts, alternative stable states, biogeochemical controls and feed-backs in eutrophic coastal lagoons: A brief overview. Aquatic Conserva-tion 18: 105-117.
24. Handy RD, Poxton MG (1993) Nitrogen pollution in mariculture: Toxicity and excretion of nitrogenous compounds by marine fish. In Reviews in Fish Biology and Fisheries 3: 205-241.
25. Smit AJ (2002) Nitrogen Uptake by Gracilariagracilis (Rhodophyta): Ad-aptations to a Temporally Variable Nitrogen Environment. Botanica Ma-rina 45: 196-209
26. Giordani G, Zaldivar JM, Viaroli P (2009) Simple tools for assessing wa-ter quality and trophic status in transitional wawa-ter ecosystems. Ecological Indicators 9: 82-991.
27. Souchu P, Ximenes MC, Lauret M, Vaquer A, Dutriex E (2000) Mise a` jour d’indicateurs du niveau d’eutrophisation des milieux lagunaires médi-terranéens, Ifremer-Creocean-Université´ Montpellier II, 412.
28. EPA Environmental protection Agency (2005) National Coastal Condition, Report II. Report of US. Environmental Protection Agency, 286. 29. http://www.xivcongresso.societaitalianaecologia.org/articles/.
30. Lenzi M, Finoia MG, Persia E, Comandi S, Gargiulo V, et al. (2005) Bio-geochemical effects of disturbance in shallow water sediment by macroal-gae harvesting boats. Mar Pollut Bull 50: 512-519.
31. Lenzi M, Salvaterra G, Gennaro P, Mercatali I, Persia E, et al. (2015) A new approach to macroalgal bloom control in eutrophic, shallow-water, coastal areas. J Environ Manage 150: 456-465.
32. Revsbech NP, Sorensen J, Blackburn TH, Lomholt JP (1980) Distribution of oxygen in marine sediments measured with microelectrodes. Limnolo-gy and Oceanography 25: 403-411.
33. Golterman HL (2001) Phosphate release from anoxic sediments or ‘what did Mortimer really write?’ Hydrobiologia 450: 99-106.
34. Golterman HL (1995) The role of the ironhydroxide-phosphate-sulphide system in the phosphate exchange between sediments and overlying water. Hydrobiologia 297: 43-54.
35. Lenzi M, Persiano M, Gennaro P, Rubegni F (2016) Wind mitigating ac-tion on effects of eutrophicaac-tion in coastal eutrophic water bodies. Interna-tional Journal of Marine Science and Ocean Technology 3: 14-20 36. Lavery PS, McComb AJ (1991) The nutritional eco-physiology of
Chaeto-morpha linum and Ulva rigida in Peel Inlet, Western Australia. Botanica
Submit Your Manuscript: http://www.heraldopenaccess.us/Online-Submission.php
Journal of Agronomy & Agricultural Science Journal of AIDS Clinical Research & STDs
Journal of Alcoholism, Drug Abuse & Substance Dependence Journal of Allergy Disorders & Therapy
Journal of Alternative, Complementary & Integrative Medicine Journal of Alzheimer’s & Neurodegenerative Diseases Journal of Angiology & Vascular Surgery
Journal of Animal Research & Veterinary Science Archives of Zoological Studies
Archives of Urology
Journal of Atmospheric & Earth-Sciences Journal of Aquaculture & Fisheries
Journal of Biotech Research & Biochemistry Journal of Brain & Neuroscience Research Journal of Cancer Biology & Treatment Journal of Cardiology: Study & Research Journal of Cell Biology & Cell Metabolism Journal of Clinical Dermatology & Therapy Journal of Clinical Immunology & Immunotherapy Journal of Clinical Studies & Medical Case Reports Journal of Community Medicine & Public Health Care Current Trends: Medical & Biological Engineering Journal of Cytology & Tissue Biology
Journal of Dentistry: Oral Health & Cosmesis Journal of Diabetes & Metabolic Disorders Journal of Dairy Research & Technology
Journal of Emergency Medicine Trauma & Surgical Care Journal of Environmental Science: Current Research Journal of Food Science & Nutrition
Journal of Forensic, Legal & Investigative Sciences Journal of Gastroenterology & Hepatology Research Journal of Gerontology & Geriatric Medicine
Journal of Internal Medicine & Primary Healthcare Journal of Infectious & Non Infectious Diseases Journal of Light & Laser: Current Trends Journal of Modern Chemical Sciences Journal of Medicine: Study & Research
Journal of Nanotechnology: Nanomedicine & Nanobiotechnology Journal of Neonatology & Clinical Pediatrics
Journal of Nephrology & Renal Therapy Journal of Non Invasive Vascular Investigation
Journal of Nuclear Medicine, Radiology & Radiation Therapy Journal of Obesity & Weight Loss
Journal of Orthopedic Research & Physiotherapy Journal of Otolaryngology, Head & Neck Surgery Journal of Protein Research & Bioinformatics Journal of Pathology Clinical & Medical Research
Journal of Pharmacology, Pharmaceutics & Pharmacovigilance Journal of Physical Medicine, Rehabilitation & Disabilities Journal of Plant Science: Current Research
Journal of Psychiatry, Depression & Anxiety
Journal of Pulmonary Medicine & Respiratory Research Journal of Practical & Professional Nursing
Journal of Reproductive Medicine, Gynaecology & Obstetrics Journal of Stem Cells Research, Development & Therapy Journal of Surgery: Current Trends & Innovations Journal of Toxicology: Current Research Journal of Translational Science and Research Trends in Anatomy & Physiology
Journal of Vaccines Research & Vaccination Journal of Virology & Antivirals
Archives of Surgery and Surgical Education Sports Medicine and Injury Care Journal