The limitation to maximal Oµ consumption (ýOµ,max) was classically attributed to cardiovascular Oµ transport (Rowell, 1974; Saltin, 1977; Blomqvist & Saltin, 1983; Ekblom, 1986). However, several other factors, such as muscle Oµ diffusion and mitochondrial oxidative capacity, have been considered as possibly limiting ýOµ,max, particularly during exercise with small muscle groups (Kaijser, 1970; Saltin, 1977). The controversy over ýOµ,maxlimitation was recently reopened by the introduction of models which assume that each of the multiple steps of the Oµ pathway from air to mitochondria can provide a given fraction of the overall
ýOµ,maxlimitation. On one side, Wagner (1996) stressed the relative role of peripheral (muscle Oµ diffusion) as opposed to central (cardiovascular) factors limiting ýOµ,max. On the other side, a multifactorial model of ýOµ,max limitation, based on the Oµ cascade, was proposed (di Prampero & Ferretti, 1990).
The latter model predicts that cardiovascular Oµ transport imposes some 60—70% of ýOµ,max limitation in humans working with large muscle groups in normoxia. This prediction was confirmed by a systematic study of cardio-vascular Oµ transport after autologous blood re-infusion,
The interplay of central and peripheral factors in limiting
maximal Oµ consumption in man after prolonged bed rest
Guido Ferretti*, Guglielmo Antonutto†, Christian Denis‡, Hans Hoppeler§,
Alberto E. Minetti¨, Marco V. Narici*¨ and Dominique Desplanches¶
*Departement de Physiologie, Centre Medical Universitaire, 1 rue Michel Servet,
1211 Gen`eve 4, Switzerland; †Dipartimento di Tecnologie Biomediche, Universit`a di Udine,
Italy; ‡Laboratoire de Physiologie, Groupe d’Interˆet Publique Exercice, Universite Jean
Monnet, Saint Etienne, France; §Anatomisches Institut, Universitat Bern, Bern,
Switzerland; ¨Istituto di Tecnologie Biomediche Avanzate, Consiglio Nazionale delle
Ricerche, Milano, Italy; ¶Unite Mixte de Recherche 5578, Centre National de la Recherche
Scientifique, Lyon, France
1. The effects of bed rest on the cardiovascular and muscular parameters which affect maximal Oµ consumption (ýOµ,max) were studied. The fractional limitation of ýOµ,maximposed by these parameters after bed rest was analysed.
2. The ýOµ,max, by standard procedure, and the maximal cardiac output (Qmax), by the pulse contour method, were measured during graded cyclo-ergometric exercise on seven subjects before and after a 42-day head-down tilt bed rest. Blood haemoglobin concentration ([Hb]) and arterialized blood gas analysis were determined at the highest work load.
3. Muscle fibre types, oxidative enzyme activities, and capillary and mitochondrial densities were measured on biopsy samples from the vastus lateralis muscle before and at the end of bed rest. The measure of muscle cross-sectional area (CSA) by NMR imaging at the level of biopsy site allowed computation of muscle oxidative capacity and capillary length.
4. The ýOµ,max was reduced after bed rest (−16·6%). The concomitant decreases in Qmax (−30·8%), essentially due to a change in stroke volume, and in [Hb] led to a huge decrease in Oµ delivery (−39·7%).
5. Fibre type distribution was unaffected by bed rest. The decrease in fibre area corresponded to the significant reduction in muscle CSA (−17%). The volume density of mitochondria was reduced after bed rest (−16·6%), as were the oxidative enzyme activities (−11%). The total mitochondrial volume was reduced by 28·5%. Capillary density was unchanged. Total capillary length was 22·2% lower after bed rest, due to muscle atrophy.
6. The interaction between these muscular and cardiovascular changes led to a smaller reduction in ýOµ,maxthan in cardiovascular Oµ transport. Yet the latter appears to play the greatest role in limiting ýOµ,max after bed rest (>70% of overall limitation), the remaining fraction being shared between peripheral Oµ diffusion and utilization.
which allowed application of the model (Turneret al.1993). A simulation, supported by experimental results, allowed a quantitative estimate of the increase in the fractional limitation to ýOµ,max imposed by pulmonary ventilation in hypoxia (Ferretti & di Prampero, 1995). However, to our knowledge, an overall analysis of the fractional ýOµ,max limitation after complex adaptive phenomena, which imply changes in both cardiovascular Oµ transport at maximal exercise and morphometric muscle oxidative and diffusive capacities, simultaneously determined on the same experimental subjects, is currently missing in the literature. The only exception, a study on exercise after altitude acclimatization (Cerretelli & Ferretti, 1990), was neither performed nor interpreted within the context of ýOµ,max limitation.
A unique opportunity for a global analysis of the factors which limit ýOµ,maxin normoxia came from the undertaking of a long-term head-down tilt bed rest study by the European Space Agency and by the Centre National d’Etudes Spatiales, France, in 1994. In fact bed rest leads to remarkable reductions in ýOµ,maxdue to an impairment of both cardiovascular and muscular functions (for a review see Fortney, Schneider & Greenleaf, 1996). Such functional deteriorations imply changes in several resistances to Oµ flow along the Oµ transfer system. It was thus argued that, based on these changes, the multifactorial model would allow a discrimination of the relative roles of peripheral (muscular) and central (cardiovascular) factors in determining the ýOµ,maxreduction after bed rest.
In the present study, a detailed analysis of the effects of prolonged bed rest on both the cardiovascular and muscular parameters expected to affect ýOµ,max, simultaneously assessed on a homogeneous group of subjects, is reported. The relative weight of these parameters in determining the ýOµ,max reduction after bed rest and the fraction of ýOµ,max limitation imposed by them have been analysed by means of the multifactorial model.
METHODS
Study design
After approval by the local ethical committee (Comite Consultatif de Protection des Personnes dans la Recherche Biomedicale, Toulouse I, France), the study was conducted on seven healthy young males, who had previously given their written informed consent. At the beginning of the study, they were 28 ± 1 years old, 1·76 ± 0·01 m tall and 74·0 ± 3·3 kg in weight. All experiments were carried out at the Hˆopital Purpan, Toulouse, France, except for NMR imaging, which was performed at the Hˆopital Rangueil, Toulouse.
The study consisted of three phases: (1) baseline control experiments before bed rest; (2) a 42-day head-down tilt (−6°) bed rest period without countermeasures: no deviations from the lying position were permitted, and neither exercise nor muscle contraction tests were allowed during this period; (3) final experiments after bed rest. These included exercise testing on day 4 during recovery, whereas the muscle biopsy had to be taken on day 37 of the
bed-rest period, in order to avoid interference with other concomitant protocols after bed rest. NMR imaging of the legs was thus carried out on day 37 of bed rest.
Maximal Oµ consumption
Individual ýOµ,max was determined during graded exercise on the
bicycle ergometer (Ergometrics 800-S, Ergoline, Germany). The oxygen uptake (ýOµ) at the metabolic steady state was measured at
rest and during exercises of increasing intensities. Starting from 100 and 50 W before and after bed rest, respectively, power was progressively augmented by steps of 50 W, reduced to 25 W as the expected individual maximum power was approached. The duration of each work load was 5 min. Successive work loads were separated by 5 min recovery intervals, during which time blood samples (20 ìl) were obtained from an ear lobe at 1, 3 and 5 min for determination of blood lactate concentration ([La]b) by means of an
electro-enzymatic method (ESAT 6661 Lactat, Eppendorf, Germany).
During the fifth minute of each work load, expired gas was collected into Douglas bags and subsequently analysed for gas composition and volume. A paramagnetic Oµ analyser (Oxynos 1-C, Leybold Haereus, Germany), an infrared COµ analyser (LB-2, Leybold Haereus) and a dry gas meter (Singer DTM 15, USA) were employed. Steady-state ýOµwas computed by standard expiratory
mass balance equations. COµ output (ýCOµ), expired ventilation (ýE)
and the gas exchange ratio were also calculated.
Individual ýOµ,maxwas established from the plateau attained by
the relationship between ýOµ and power above a given power. If
such a plateau was not observed, subsidiary criteria for ýOµ,max
establishment were: (1) a lack of increase in heart rate (HR) between two successive work loads (ÄHR < 5 min¢); (2) gas exchange ratio values higher than 1·1; (3) [La]bvalues higher that
10 mÒ. The HR was measured by electrocardiography (Elmed, ETM, Germany). The minimum power requiring an energy expenditure equal to ýOµ,max (w at ýOµ,max) was defined as the
mechanical power(w) at the crossing point of the line describing the ýOµvs.power relationship and the plateau defining ýOµ,max. The
overall net mechanical efficiency of exercise was calculated as the reciprocal of the slope of the relationship between ýOµand power.
Cardiovascular Oµ transport
Maximal cardiac output(Qmax) was determined during the same
procedure as for the determination of ýOµ,maxfrom HR and stroke
volume measurements (QH). The latter was measured by means of
the pressure-pulse contour method (Antonutto, Girardis, Tuniz & di Prampero, 1995). To this end, continuous monitoring of the arterial blood pressure profile was obtained by means of a Finapres device (Ohmeda, USA). The photo-plethysmographic cuff of the Finapres was applied to the middle phalanx of the middle finger of the right hand. The arterial pressure profiles were recorded on magnetic tape, digitalized by an AÏD converter and subsequently analysed by a computer (Acqknowledge® III for the MP 100 WS, Biopac Systems Inc., Goleta, CA, USA).
Calibration of the area described by the arterial blood pressure profiles at rest was performed against mean stroke volume values obtained from cardiac output determinations using the one-step COµ rebreathing method (Farhi, Nesarajah, Olszowka, Metildi & Ellis, 1976). The Ground Respiratory Monitoring System (Innovision, Odense, Denmark) equipped with a mass spectrometer (Balzers, Liechtenstein) and a personal computer was used. The rebreathing mixture contained 35% oxygen, so that alveolar—capillary gas equilibration was maintained throughout the entire rebreathing manoeuvre.
At exercise, the algorithm provided by Antonuttoet al.(1995) was used for signal calibration. This algorithm relies on the calibration of the pulse-pressure area performed at rest. Application of this algorithm to the computation of cardiac output during exercise was validated against the COµ rebreathing method for a range of cardiac output values comprised between 4 and 22 l min¢ (G. Antonutto, C. Capelli, P. E. di Prampero, M. Girardis, D. Pendergast & P. Zamparo, unpublished observations).
At rest and immediately after the end of the highest work load, an 80 ìl arterialized blood sample was obtained from the ear lobe, previously made hyperaemic by means of an ointment (Trafuril, Ciba Geigy, Switzerland), and immediately analysed (Ciba Corning 280 blood gas system, USA) for arterialized blood pH (pHa),
haemoglobin concentration [Hb] and arterialized Oµ and carbon dioxide partial pressures (Pa,O2andPa,CO2, respectively). Arterial Oµ
saturation(Sa,O2) was measured continuously by finger tip infrared
oxymetry (Pulsox-5, Minolta, Japan). Arterialized oxygen concentration (Ca,O2) at the exercise steady state was then calculated
as the product of [Hb],Sa,O2and physiological Oµ binding coefficient
of haemoglobin (1·34 ml g¢). Arterial Oµ delivery (Qa,Oµ) at
maximal exercise was calculated as the product ofQmaxtimesCa,O2.
Mixed venous Oµ concentration (C¯v,O2) was computed by the Fick
equation. TheQHwas calculated as the ratio ofQmaxto HR.
Muscle biopsies
Muscle biopsies were taken under local anaesthesia from the same location and depth on the mid portion of the vastus lateralis of the dominant thigh, 29 days before bed rest and during the 37th day of bed rest, using a Weil—Blakesley conchotome (Henriksson, 1979). Two to three centimetres separated the two sites of the repeated incisions on the same thigh. Samples were divided for histochemistry, biochemistry and electron microscopy.
Histochemical analysis
A 5 mm thick block was mounted in an embedding medium (Tissue-TEK ACT compound, Miles Inc. Diagnostics Division, Elkhart, IN, USA), frozen in isopentane, pre-cooled in liquid nitrogen, and stored at −80°C until analysis. Serial transverse sections (10 ìm) were cut on a microtome at −30°C and were stained for myosin adenosinetriphosphatase (ATPase) activity (Brooke & Kaiser, 1970). After pre-incubation at differing pH values (4·3, 4·5) in acid buffer (acetic acid, 50 mÒ) with 25 mÒ CaClµ for 4 min at 25°C, the ATPase reaction was carried out in a buffer (pH 9·4) with 18 mÒ CaClµ and 2·7 mÒ ATP at 37°C for 20 min. Based on observed differences in pH lability of the myosin ATPase activity of the isomyosins in the different fibres, muscle fibres were classified into three major types (I, IIA, and IIB) and an intermediate type (IIAB). Fibre type composition is expressed as the number of fibres of each type relative to the total number of fibres. Measurements were made on approximately 350 fibres in each section. A minimum of fifty fibres of each fibre type was used for the calculation of the fibre cross-sectional area by a computerized planimetry system coupled to a digitizer. Mean fibre area was expressed as the cumulative area divided by the number of fibres. Type IIAB mean fibre area was not computed, due to their small number. Capillaries were stained using the ATPase technique after pre-incubation at pH 4·0. Capillary density and number of capillaries per fibre were determined as described by Andersen & Henriksson (1977).
Enzyme assays
Muscle homogenates were prepared in 0·3 Ò phosphate buffer, containing 0·05% bovine serum albumin (pH 7·7). They were frozen and thawed three times to disrupt the mitochondrial
membrane. Hexokinase (HK, EC2.7.1.1), lactate dehydrogenase (LDH, EC1.1.1.27) and 3-hydroxyacyl-CoA dehydrogenase (HAD, EC1.1.1.35) were fluorimetrically determined as previously described by Lowry & Passonneau (1973). Citrate synthase (CS, EC4.1.3.7) was measured by the method of Srere (1969) using 5_5'_dithiobis(2-nitrobenzoic acid). Enzyme activities are expressed as micromoles of substrate per minute per gram of protein.
Morphometry
A fraction of the muscle tissue was processed for electron microscopy by fixing in a 6·25% solution of glutaraldehyde as previously described (Hoppeler, Mathieu, Krauer, Claassen, Armstrong & Weibel, 1981). Transverse ultrathin sections (60—90 nm) were cut with an LBK ultramicrotome from two tissue blocks randomly chosen from each muscle. For analysis of the mitochondria, lipid droplets and myofibrils, forty micrographs per muscle were taken on 35 mm film with a Philips 300 electron microscope at a final magnification of ²24000. The volume densities of interfibrillar and subsarcolemmal mitochondria, and of myofibrils were determined with a systematic sampling procedure in consecutive frames of twenty square mesh grids. The reference space was the total fibre volume. The mean total volume density of mitochondria was calculated as the sum of the mean interfibrillar and subsarcolemmal mitochondrial volume densities for each muscle. Point counting was performed with a grid C 16 (144 test points). All stereological variables were estimated according to standard procedures (Weibel, 1979).
Muscle cross-sectional area
Muscle cross-sectional area (CSA) was obtained by NMR imaging (Siemens Somatom Impact 1.5 T, Erlangen, Germany) of the right and left thighs. Ten axial scans were performed (10 mm thickness, repetition time 700 ms, echo time 17 ms) at intervals equal to 1Ï10 of femur length. For this study, only the CSA at 5Ï10 of femur length was used, as it corresponds to the level where the biopsy was taken. Each film was digitally scanned (StudioScan II, Agfa Inc.) at a resolution of 150—185 dpi, and the files obtained were processed by using NIH Image 1.52 on an Apple Duo 230 computer. Contours of the anterior muscle groups (including the sartorius muscle) were digitized semi-manually, and the CSAs were obtained by converting the results of a pixel-counting routine according to a reference ruler. The CSAs of both thighs were analysed and a mean CSA was calculated. In order to repeat scans at the same individual femur lengths, appropriate anatomical markers were used.
Muscle oxidative capacity (mitochondrial volume) was calculated by multiplying the volume density of total mitochondria by the volume of a 1 cm-thick slice of muscle of known CSA around the biopsy site. Capillary length was calculated by multiplying capillary density by the volume of the same 1 cm-thick slice of muscle, assuming a factor for capillary tortuosity of 1·25. The assumption was made that all muscles of the thigh were equally affected by bed rest: hence the structural changes observed in muscle vastus lateralis were considered representative for all thigh muscles. This procedure and this assumption were described and criticized in detail in Conley, Kayar, Rosler, Hoppeler, Weibel & Taylor (1987).
Statistical analysis
The Wilcoxon ranked test was used to test the significance of intra-group differences (before and after bed rest). The level of significance was set at P< 0·05. All data are expressed as means ±s.e.m. Linear regressions were calculated by means of the
RESULTS
Maximal oxygen consumption
Submaximal oxygen consumption (ýOµ)was linearly related to mechanical power in all subjects. At any submaximal power, ýOµwas the same before and after the bed rest period. Overall net mechanical efficiency of submaximal exercise was 0·262.
The metabolic and respiratory data obtained at maximal exercise before and after the bed rest are summarized in Table 1. Absolute ýOµ,maxand ýCOµ,max were greatly reduced after bed rest (−16·6%, P < 0·01 and −14·1%, P < 0·01, respectively) but were attained at the same [La]b, gas exchange ratio and ýEas in the control condition. Since body mass was unaffected by bed rest, the same changes were observed for specific ýOµ,max(−15·2%, P< 0·01). Accordingly, the w at ýOµ,max was greatly diminished after bed rest (−18·7%, P < 0·01).
Cardiovascular oxygen transport
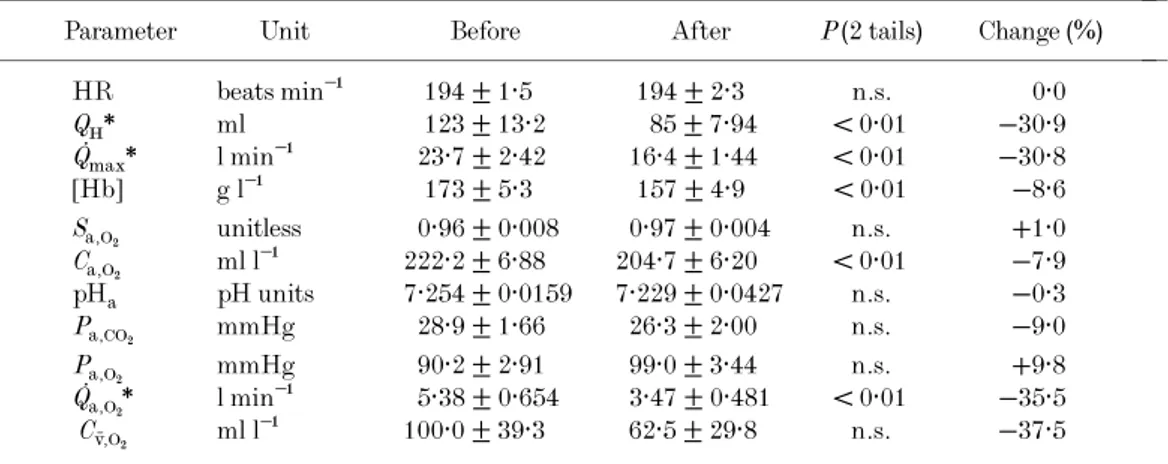
The cardiovascular and blood gas data are reported in Table 2. The maximal HR was the same before and after bed rest. Thus, the remarkable reduction in Qmax(−30·8%) was the result of a dramatic decrease inQH. The [Hb] was also significantly reduced after bed rest (−8·6%). Since
Sa,Oµwas unchanged, a reduction inCa,Oµobviously followed. These changes resulted in a huge decrease in Qa,Oµ at maximal exercise (−35·5%). The decrease (although not significant) in C¯v,O2 after bed rest was an inevitable
con-sequence of the greater decrease in Qmax than in ýOµ,max. After bed rest, the same pHaandPa,COµvalues at maximal exercise as in the control condition were found.
Muscle structure and function
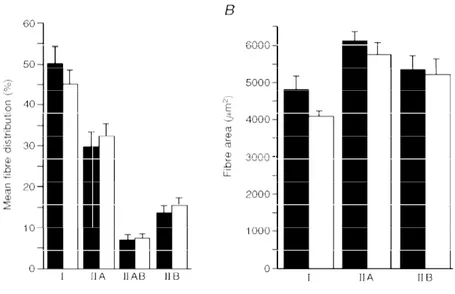
The effects of bed rest on the percentage distribution and cross-sectional areas of fibres are shown in Fig. 1A and B,
respectively. Fibre type distribution remained unchanged after bed rest. Fibre cross-sectional areas were reduced after ––––––––––––––––––––––––––––––––––––––––––––––
––––––––––––––––––––––––––––––––––––––––––––––
Table 1. Maximal oxygen consumption and related parameters before and after bed rest
––––––––––––––––––––––––––––––––––––––––––––––
Parameter Unit Before After P(2 tails) Change (%)
–––––––––––––––––––––––––––––––––––––––––––––– Body mass kg 74·0 ± 3·25 72·7 ± 3·17 n.s. −1·7 ýOµ,max l min¢ 2·83 ± 0·204 2·36 ± 0·129 <0·01 −16·6 ýOµ,max ml min¢ kg¢ 38·90 ± 3·719 32·98 ± 2·581 <0·01 −15·2 wat ýOµ,max W 229 ± 17·8 186 ± 11·3 <0·01 −18·7 [La]b mÒ 12·0 ± 0·57 11·2 ± 0·68 n.s. −6·7 ýCOµ,max l min¢ 3·49 ± 0·227 3·00 ± 0·163 <0·01 −14·1 ýE,BTPS l min¢ 113·8 ± 9·11 108·0 ± 6·80 n.s. −5·1
Gas exchange ratio unitless 1·24 ± 0·019 1·27 ± 0·023 n.s. +2·4 –––––––––––––––––––––––––––––––––––––––––––––– ýOµ,max, maximum oxygen consumption;w, mechanical power; [La]b, blood lactate concentration; ýCOµ,max,
maximum COµ output; ýE,BTPS, pulmonary ventilation at body temperature and pressure, when saturated
with water vapour. Data are given as means ±s.e.m.
–––––––––––––––––––––––––––––––––––––––––––––– ––––––––––––––––––––––––––––––––––––––––––––––
–––––––––––––––––––––––––––––––––––––––––––––– ––––––––––––––––––––––––––––––––––––––––––––––
Table 2. Cardiovascular and haematological variables at maximal exercise before and after bed rest
––––––––––––––––––––––––––––––––––––––––––––––
Parameter Unit Before After P(2 tails) Change (%)
–––––––––––––––––––––––––––––––––––––––––––––– HR beats min¢ 194 ± 1·5 194 ± 2·3 n.s. 0·0 QH* ml 123 ± 13·2 85 ± 7·94 < 0·01 −30·9 Qmax* l min¢ 23·7 ± 2·42 16·4 ± 1·44 < 0·01 −30·8 [Hb] g l¢ 173 ± 5·3 157 ± 4·9 < 0·01 −8·6 Sa,Oµ unitless 0·96 ± 0·008 0·97 ± 0·004 n.s. +1·0 Ca,Oµ ml l¢ 222·2 ± 6·88 204·7 ± 6·20 < 0·01 −7·9 pHa pH units 7·254 ± 0·0159 7·229 ± 0·0427 n.s. −0·3 Pa,COµ mmHg 28·9 ± 1·66 26·3 ± 2·00 n.s. −9·0 Pa,Oµ mmHg 90·2 ± 2·91 99·0 ± 3·44 n.s. +9·8 Qa,Oµ* l min¢ 5·38 ± 0·654 3·47 ± 0·481 < 0·01 −35·5 C¯v,Oµ ml l¢ 100·0 ± 39·3 62·5 ± 29·8 n.s. −37·5 –––––––––––––––––––––––––––––––––––––––––––––– HR, heart rate;QH, stroke volume of the heart;Qmax, maximal cardiac output; [Hb], blood haemoglobin
concentration;Sa,Oµ, arterial oxygen saturation;Ca,Oµ, arterialized oxygen concentration; pHa, arterialized
blood pH;Pa,COµ, arterialized carbon dioxide partial pressure;Pa,Oµ, arterialized oxygen partial pressure;
Qa,Oµ, oxygen delivery at maximal exercise;C¯v,Oµ, mixed venous oxygen concentration. *Values for which
n= 5.
–––––––––––––––––––––––––––––––––––––––––––––– ––––––––––––––––––––––––––––––––––––––––––––––
bed rest (4779 ± 396 vs. 4083 ± 152, 6091 ± 244 vs.
5768 ± 311, and 5199 ± 443vs.4292 ± 210 ìm2for type I, type IIA, and type IIB fibres, respectively). This reduction (−15 and −17% for type I and IIB fibres, respectively) did not reach statistical significance(P = 0·06).
Neither capillary per fibre ratio (2·58 ± 0·04vs.2·50 ± 0·06) nor capillary density (504 ± 28 vs. 461 ± 27 mm−2) was significantly affected by bed rest. The stereological variables are presented in Table 3. No change occurred in the volume density of lipids and myofibrils. In contrast, the volume density of interfibrillar and total mitochondria was decreased by 17%. Muscle enzyme activities are also reported in
Table 3. Exposure to bed rest induced a significant decrease (−11%) in 3-hydroxyacyl-CoA dehydrogenase activity. The change in citrate synthase activity (−9%) was not significant. The activities of lactate dehydrogenase and hexokinase remained unchanged compared with the control values.
Muscle cross-sectional area
The mean CSA of the extensor muscle groups at mid-femur before and after bed rest was 87·3 ± 12·1 cm2and 75·6 ± 8·8 cm2, with a decrease of −13·4% (P< 0·005). The muscle oxidative capacity of the 1 cm-thick slice of thigh musculature around the biopsy site was 4·5 ± 1·1 and 3·2 ± 0·6 cm3 before and after bed rest, respectively, the
Figure 1. Muscle fibre types before and after bed rest
A, fibre type distribution;B, fibre type cross-sectional area. Data before(4)and after (5)bed rest for
muscle fibre types.
–––––––––––––––––––––––––––––––––––––––––––––– ––––––––––––––––––––––––––––––––––––––––––––––
Table 3. Muscle morphometry and muscle enzyme activities, as from muscle vastus lateralis biopsy specimens, before and after bed rest
–––––––––––––––––––––––––––––––––––––––––––––– Morphometry
–––––––––– Before After
–––––––––––––––––––––––––––––––––––––––––––––– Volume density of interfibrillar mitochondria (%) 4·59 ± 0·29 3·80 ± 0·23* Volume density of subsarcolemmal mitochondria (%) 0·54 ± 0·09 0·48 ± 0·11 Volume density of total mitochondria (%) 5·13 ± 0·36 4·28 ± 0·31* Volume density of intracellular lipid droplets (%) 0·77 ± 0·08 0·70 ± 0·10 Volume density of myofibrils (%) 75·8 ± 1·6 77·1 ± 1·0 ––––––––––––––––––––––––––––––––––––––––––––––
Muscle enzymes ––––––––––Before After
–––––––––––––––––––––––––––––––––––––––––––––– Hexokinase (ìmol min¢ (g protein−1) 3·1 ± 0·1 3·5 ± 0·3 Lactate dehydrogenase (ìmol min¢ (g protein−1) 762 ± 123 750 ± 151 3-Hydroxyacyl-CoA-dehydrogenase (ìmol min¢ (g protein−1)) 26·1 ± 2·8 23·2 ± 2·4* Citrate synthase (ìmol min¢ (g protein−1)) 46·5 ± 7·1 42·2 ± 5·9 ––––––––––––––––––––––––––––––––––––––––––––––
*Statistically significantly different(P< 0·05).
–––––––––––––––––––––––––––––––––––––––––––––– ––––––––––––––––––––––––––––––––––––––––––––––
decrease amounting to 28·5%(P< 0·01). The total capillary length in the same slice of thigh muscles was 44·2 ± 3·5 and 34·4 ± 0·9 km before and after bed rest, respectively, the latter value being 22·2% lower than the former(P < 0·05).
DISCUSSION
The ýOµ,maxdecrease observed in this study is in the upper range of changes reported in previous studies (for a review see Fortney et al. 1996). The fact that after bed rest the ýOµ,max and the mechanical power decreased by the same amount suggests that the decrease in ýOµ,max occurred within the active muscle mass. This allows application of the multifactorial model of ýOµ,maxlimitation in the interpretation of the numerous adaptive phenomena at the cardiovascular and muscular levels, which contributed to the decrease in ýOµ,maxafter bed rest. These phenomena are first analysed separately, and then considered in a global context, in an attempt to estimate their relative role in limiting ýOµ,max after bed rest.
Cardiovascular oxygen transport
The decrease inQmaxafter bed rest, which is greater than reported in previous studies with shorter bed rest duration, seems entirely due to a decrease inQH, while HR remained unchanged (Fig. 2). This is in agreement with previous studies (Saltin, Blomqvist, Mitchell, Johnson, Wildenthal & Chapman, 1968; Sullivanet al. 1985). The decrease inQH may, at least in part, be a consequence of a reduced blood volume resulting from a drop of both red cell and plasma volume. The former seems reflected by the lower [Hb] after bed rest; the latter was obviously not measured at maximal
exercise, but at rest, in the course of the same bed rest study on the same subjects, others found it to decrease by 9·3% after bed rest (Johansen et al. 1997). The decrease in QH, associated with a drop in mean arterial blood pressure, is indicative of a reduced capacity by the heart to produce mechanical work at maximal exercise. This is consistent with a reduction in cardiac size observed after prolonged bed rest (Saltinet al.1968).
The observed reduction in Ca,Oµ is probably due to the decreased [Hb]. This is a common finding after bed rest, resulting from the loss of red cell mass, the origin of which is still controversial (Fortney et al. 1996). The combined changes in Qmaxand inCa,Oµindicate a dramatic decrease in
Qa,Oµ, which appears to be a major determinant of the reduction in ýOµ,max, as discussed below.
Muscle ultrastructure and enzyme activities
The stereological analysis showed a large decrease in the volume density of mitochondria (−17%), but no change in the myofibrillar volume density. These results are opposite to those observed on animals subjected to hindlimb suspension, showing an invariant or increased volume density of mitochondria associated with a preferential loss of contractile myofibrillar proteins (Desplanches, Favier, Sempore & Hoppeler, 1991). After bed rest, the decrease in mitochondrial volume density was not accompanied by changes in muscle capillarity. These results also are in contrast with earlier observations in unloaded rats, which show an increased capillary density, implying a reduction in diffusion distances and a more efficient oxygen and substrate delivery to muscle fibres (Desplancheset al.1991).
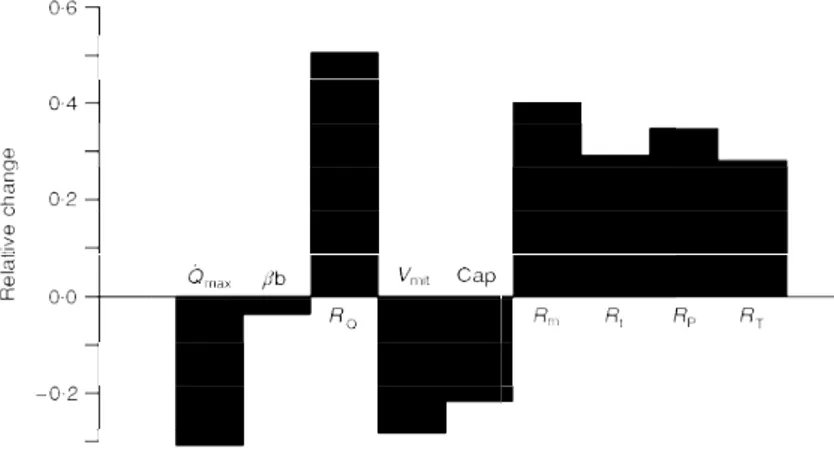
Figure 2. The determinants of maximal oxygen consumption after bed rest
Qmax, maximal cardiac output; âb, blood oxygen transport coefficient; RQ, cardiovascular resistance to
oxygen flow; Vmit, muscle oxidative capacity; Cap, capillary length; Rm, mitochondrial resistance to
oxygen flow;Rt, tissue diffusive resistance to oxygen flow;RP, lumped peripheral resistance to oxygen flow
(Rt+Rm); RT, total resistance to oxygen flow. Data are given relative to the values before bed rest,
assumingRt=Rm. The predicted maximal oxygen consumption (ýOµ,max) is 2·225 l min¢ forRtandRmin
series and 2·226 l min¢ forRt andRm in parallel. These are calculated by means of the multifactorial
model, from the value before bed rest and the changes in resistance shown in this figure. The measured ýOµ,maxfrom this study is 2·36 ± 0·129 l min¢.
This cannot be postulated for the present study. Assuming that no interstitial oedema occurred, as discussed below, the finding of a reduction in total muscle CSA and muscle fibre CSA with no changes in capillary density and in capillaryÏfibre ratio suggests that a net loss of muscle capillaries (i.e. of total capillary length or surface available for exchange processes) occurred during bed rest.
The changes in volume density of mitochondria are consistent with the changes observed in biochemical markers of the oxidative metabolism such as CS (−9%) and HAD (−11%) activities. The results for CS are qualitatively similar to previous reports in humans after bed rest and lower limb unloading (Hikida, Gollnick, Dudley, Convertino & Buchanan, 1989; Berg, Dudley, Hather & Tesch, 1993). With respect to the glycolytic potential, HK and LDH activities were unchanged, consistent with the results of a 30 day bed rest study (Hikidaet al.1989).
Muscle fibre types and cross-sectional areas
The fibre-type populations of the vastus lateralis muscle are similar to those of a healthy young non-athletic population (see Gollnick, Armstrong, Saubert, Piehl & Saltin, 1972, Howald, 1982), determined using the same technique. The percentage of type IIAB fibres observed in the present study appears to be less than is usually reported for human skeletal muscle from the analysis of myosin heavy chain expression in single muscle fibre (Larsson & Moss, 1993; Sant’Ana Pereira, Wessels, Nijtmans, Moorman & Sargeant, 1995). This discrepancy may be the consequence of the different technique used in these studies: in fact in the present study some type IIAB fibres may have been classified as type IIB fibres, because co-expression of type IIA and type IIB myosin heavy chains can go undetected with the histochemical technique.
After thirty-seven days of bed rest, the histochemical analysis revealed no change in the percentage type distribution of fibres, consistent with earlier reports using another human model of unilateral lower limb unloading during twenty-eight or fourty-two days (Hather, Adams, Tesch & Dudley, 1992; Berg et al. 1993). These results disagree with previous animal studies, which led to a reduced motor activity and mechanical unloading via hindlimb unweighting (Thomason & Booth, 1990). In rats, it was demonstrated that in slow-twitch postural muscles, such as the soleus, a shift towards faster contractile properties occurred after unweighting, whereas little change was found in fast-twitch muscles (McDonald & Fitts, 1995). In fact, atrophied soleus muscles were characterized by changes in the myosin isoform distribution (an increase in fast heavy chain isoforms) and by the expression of a new myosin heavy chain IID (Takahashi, Wada & Katsuda, 1991). The changes in cross-sectional area of both type I and IIB fibres were just above the limits of statistical significance, because one subject did not show muscle atrophy at all. The
possibility of sampling error implicit in fibre type distribution based on a single sample site cannot be excluded (Lexell & Taylor, 1989). Yet the apparent decline in fibre CSA is in good agreement with the results from a previous 30-day bed rest study (Hikidaet al.1989).
The present CSA reduction of the quadriceps muscle compares well with the 11·9 and 12% decrease after 5 and 6 weeks of unilateral limb suspension, respectively (Hather
et al. 1992; Ploutz-Snyder, Tesch, Crittenden & Dudley, 1995). Similarly, a 12% decrease in the quadriceps CSA was reported after 1 month bed rest (Berry, Berry & Manelfe, 1993). The present data thus agree with the observed reduction in type I and IIB fibre cross-sectional areas. This being the case, fibre type atrophy would appear as the main determinant of muscle atrophy, without being masked by the occurrence of interstitial oedema, as observed in animal studies (Kandarian, Boushel & Schulte, 1991).
The observed reduction in muscle CSA, and thus in muscle mass, implies a greater decrease in muscle oxidative capacity (−28·5%) than in volume density of muscle mitochondria (−16·6%). Such a decrease is comparable only to that observed on extreme altitude climbers following altitude acclimatization (Hoppeleret al.1990).
ý
Oµ,maxlimitation after bed rest
On the model employedThe present analysis of the factors which limit ýOµ,maxafter bed rest, is carried out in the context of the multifactorial model of ýOµ,max limitation, which is described in detail elsewhere (di Prampero & Ferretti, 1990). We thus re-consider only the general principles utilized in this case. The model is an application of the Oµ conductance equation to maximal exercise. The flow of Oµ from ambient air to mitochondria is considered to be driven by Oµ pressure gradients against numerous resistances in series. Five resistances(R)or conductances(G =1ÏR)of physiological interest are identified, related to: (i) alveolar ventilation (Gv or Rv); (ii) alveolar—capillary Oµ transfer (GL or RL); (iii) cardiovascular Oµ transport (GQ orRQ); (iv) tissue Oµ transfer (GtorRt); and (v) tissue Oµ utilization (GmorRm). The two last peripheral resistances can be considered either in series (RP=Rt+Rm) or in parallel (GP=Gt+Gm). Since the fractional limitation of ýOµ,maxin normoxia imposed by Gv and GL seems negligible (di Prampero & Ferretti, 1990; Ferretti & di Prampero, 1995), the present analysis focuses onGQ, GtandGmonly. Of these, GQis equal to the product of Qmax and the Oµ transfer coefficient of blood, which corresponds to the mean slope of the Oµ equilibrium curve ((Ca,Oµ−C¯v,Oµ)(Pa,Oµ−P¯v,Oµ)−1). In the computation of
GQ, P¯v,Oµwas estimated from C¯v,O2by means of the oxygen
status algorithm (Siggaard-Andersen & Siggaard-Andersen, 1990). Gt andGmare considered to vary proportionally to the changes in muscle capillary length and muscle oxidative capacity, respectively (Weibel, Taylor & Hoppeler, 1992).
The approach
Since the overall Oµ pressure gradient is unchanged, the decrease in ýOµ,max after bed rest results only from an increase in the overall resistance to Oµ flow. This is a consequence of: (i) the dramatic impairment of Oµ delivery, as indicated by the decrease in bothQmaxand [Hb] (Table 2), with consequent increase in RQ; (ii) the marked drop in muscle oxidative capacity, with consequent increase inRm; and (iii) the decrease in muscle capillary length, suggesting a greater Rt. The effects of bed rest on ýOµ,max have been predicted from the calculated relative changes inRQ,Rtand
Rm after bed rest, and compared with the measured ones. The results of this analysis are summarized in Fig. 2. The fractional limitation of ýOµ,max after bed rest is shown in Fig. 3. It appears thatRQ, the contribution of which to the change in total resistance is predominant, plays the greatest role in limiting ýOµ,max also after bed rest (> 70%). The
mean measured ýOµ,max value is not significantly different from the predicted one.
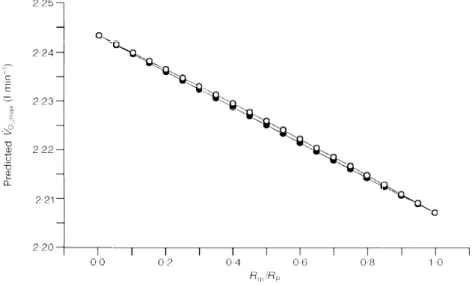
Since the proportion to whichRtandRmcombine to giveRP cannot be determined, the changes inRtandRmreported in Fig. 2 were calculated postulatingRt=Rmbefore bed rest (di Prampero & Ferretti, 1990). This postulate is tested in Fig. 4, in which the effects on the predicted ýOµ,maxafter bed rest of various combinations ofRmandRtvalues leading to theRPvalue before bed rest are analysed. Figure 4 suggests that: (i) the differences in predicted ýOµ,max are very small from one extreme (Rt=RP) to the other (Rm=RP); (ii) it makes no difference to assumeRtandRmare in series or in parallel; and (iii) the closest prediction to the actually measured ýOµ,max is obtained when Rt=RP, despite the possibility that bed rest had greater effects onRmthan on
Rt. This suggests that the peripheral resistance to Oµ flow
Figure 4. Theoretical analysis of the effects of the peripheral resistance to oxygen flow on maximal oxygen consumption
Predicted maximal oxygen consumption (ýOµ,max) values are plotted as a function of theoretical ratios of
mitochondrial (Rm) to lumped peripheral (RP) resistance to oxygen flow. Two conditions are hypothesized:
diffusive resistance(Rt) and mitochondrial resistance (Rm) in series (0) orRmandRtin parallel (1).
Figure 3. Factors limiting maximal oxygen consumption after bed rest
Fractional limitation to maximal oxygen consumption imposed by cardiovascular oxygen transport (FQ), peripheral oxygen diffusion (Ft)
may be essentially due to diffusive resistances rather than mitochondrial resistances.
Factors limiting maximal oxygen consumption after bed rest
The results of Figs 2 and 3 suggest that the model used in this study is a fairly good predictor of the changes in ýOµ,max ensuing from complex adaptive phenomena, such as long-term bed rest. The slightly, although not significantly, lower prediction may be attributed to the neglect of the small role which lung resistances play in limiting ýOµ,maxin normoxia. In fact, taking these resistances into account would have reduced the effects of changes inRQandRPon ýOµ,max, with predicted ýOµ,maxvalues closer to the measured ones.
Figures 2 and 3 show that the ýOµ,maxobserved after bed rest results from the new equilibrium attained by the various limiting steps, each with its size and its fractional limiting role. If cardiovascular Oµ transport was the only factor limiting ýOµ,max, as proposed in the past (Rowell, 1974; Saltin, 1977; Blomqvist & Saltin, 1983; Ekblom, 1986), the resulting changes in ýOµ,max would have had to be proportional to the changes inGQ or inQa,Oµ. This is not so: although this analysis supports the contention that cardiovascular Oµ transport is the main determinant of ýOµ,max during normoxic exercise with big muscle groups, the decrease in ýOµ,max after bed rest was much smaller than that in Qa,Oµ. In fact phenomena occurring at other (muscle) levels along the Oµ transfer system also contribute significantly to limit ýOµ,max.
Conclusions
Prolonged bed rest induced a significant decrease in: (i) max-imal cardiac output and haemoglobin concentration, with consequent reduction in Oµ delivery; (ii) muscle oxidative capacity and oxidative enzyme activities; and (iii) muscle capillary length, limiting the surface available for peripheral Oµ diffusion. The final result was a smaller reduction in ýOµ,maxthan in cardiovascular Oµ transport. These findings are indicative of an equilibrium between central and peripheral determinants of ýOµ,max limitation, even though cardiovascular Oµ transport still appears as the major factor limiting ýOµ,max after bed rest (> 70% of the overall limitation). At the muscle level, greatest importance may be attributed to Oµ diffusion. Yet an overall analysis of muscle biopsy data reveals specific effects of thigh muscle unloading on indices related to aerobic metabolism.
Andersen, P. & Henriksson, J. (1977). Capillary supply of the quadriceps femoris muscle of man: adaptive response to exercise.
Journal of Physiology 270, 677—690.
Antonutto, G., Girardis, M., Tuniz, D. & di Prampero, P. E. (1995). Noninvasive assessment of cardiac output from arterial pressure profiles during exercise. European Journal of Applied Physiology71, 18—24.
Berg, H. E., Dudley, G. A., Hather, B. & Tesch, P. A. (1993). Work capacity and metabolic and morphologic characteristics of the human quadriceps muscle in response to unloading. Clinical Physiology13, 337—347.
Berry, P., Berry, I. & Manelfe, C. (1993). Magnetic resonance imaging evaluation of lower limb muscles during bed rest: a microgravity simulation model.Aviation, Space and Environmental Medicine64, 212—218.
Blomqvist, C. G. & Saltin, B. (1983). Cardiovascular adaptations to physical training.Annual Review of Physiology 45, 169—189. Brooke, M. H. & Kaiser, K. K. (1970). Muscle fiber types: how
many and what kind?Archives of Neurology 23, 369—379.
Cerretelli, P. & Ferretti, G. (1990). Muscular exercise at high altitude. International Journal of Sports Medicine 11, suppl. 1, S1—34.
Conley, K. E, Kayar, S. R., Rosler, K., Hoppeler, H., Weibel, E. R. & Taylor, C. R. (1987). Adaptive variation in the mammalian respiratory system in relation to energetic demand: IV. Capillaries and their relationship to oxidative capacity.Respiration Physiology
69, 47—64.
Desplanches, D., Favier, R., Sempore, B. & Hoppeler, H. (1991). Whole body and muscle respiratory capacity with dobutamine and hindlimb suspension. Journal of Applied Physiology 71, 2419—2424.
di Prampero, P. E. & Ferretti, G.(1990). Factors limiting maximal oxygen consumption in humans. Respiration Physiology 80, 113—128.
Ekblom, B. (1986). Factors determining maximal aerobic power.Acta
Physiologica Scandinavica,suppl. 556, 15—19.
Farhi, L. E., Nesarajah, M. S., Olszowka, A. J., Metildi, L. A. & Ellis, A. K. (1976). Cardiac output determination by a simple one step rebreathing technique.Respiration Physiology 28, 141—159. Ferretti, G. & di Prampero, P. E. (1995). Factors limiting maximal
Oµ consumption: effects of acute changes in ventilation.Respiration Physiology99, 259—271.
Fortney, S. M., Schneider, V. S. & Greenleaf, J. E. (1996). The physiology of bed rest. InHandbook of Physiology. Environmental Physiology, ed. Fregly, M. J. & Blatteis, C. M., pp. 889—939. Oxford University Press, New York.
Gollnick, P. D., Armstrong, R. B., Saubert, C. W., Piehl, K. & Saltin, B. (1972). Enzyme activity and fibre composition in skeletal muscle of untrained and trained men. Journal of Applied Physiology33, 312—319.
Hather, B. M., Adams, G. R., Tesch, P. A. & Dudley, G. A. (1992). Skeletal muscle responses to lower limb suspension in humans.
Journal of Applied Physiology 72, 1493—1498.
Henriksson, K. G. (1979). Semi-open muscle biopsy technique. A simple outpatient procedure. Acta Neurologica Scandinavica 59, 317—323.
Hikida, R. S., Gollnick, P. D., Dudley, G. A., Convertino, V. A. & Buchanan, P. (1989). Structural and metabolic characteristics of human skeletal muscle following 30 days of simulated microgravity.
Aviation Space and Environmental Medicine60, 664—670.
Hoppeler, H., Kleinert, E., Schlegel, C., Claassen, H., Howald, H., Kayar, S. R. & Cerretelli, P. (1990). Muscular exercise at high altitude. II. Morphological adaptations of human skeletal muscle to chronic hypoxia.International Journal of Sports Medicine11, suppl. 1, S3—9.
Hoppeler, H., Mathieu, O., Krauer, R., Claassen, H., Armstrong, R. B. & Weibel, E. R. (1981). Design of the mammalian respiratory system. VI. Distribution of mitochondria and capillaries in various muscles. Respiration Physiology 44, 87—111.
Howald, H. (1982). Training-induced morphological and functional changes in skeletal muscle.International Journal of Sports Medicine
3, 1—12.
Johansen, L. B., Gharib, C., Allevard, A. M., Sigaudo, D., Christensen, N. J., Videbaek, R., Hammerum, M., Drummer, C. & Norsk, P. (1997). Haematocrit, plasma volume and noradrenaline in humans during simulated weightlessness for 42 days. Clinical Physiology(in the Press).
Kaijser, L. (1970). Limiting factors for aerobic muscle performance.
Acta Physiologica Scandinavica,suppl. 346, 1—96.
Kandarian, S. C., Boushel, R. C. & Schulte, L. M. (1991). Elevated interstitial fluid volume in rat soleus muscles by hindlimb unweighting.Journal of Applied Physiology 71, 910—914.
Larsson, L. & Moss, R. L. (1993). Maximum velocity of shortening in relation to myosin isoform composition in single fibres from human skeletal muscle.Journal of Physiology 472, 595—614.
Lexell, J. & Taylor C. C. (1989). Variability in muscle fibre areas in whole human quadriceps muscle: how to reduce sampling errors in biopsy techniques.Clinical Physiology9, 333—343.
Lowry, O. H. & Passonneau, J. V. (1973). A Flexible System of Enzymatic Analysis. Academic Press, New York.
McDonald, K. S. & Fitts, R. H. (1995). Effect of hindlimb unloading on rat soleus fiber force, stiffness and calcium sensitivity.Journal of Applied Physiology 79, 1796—1802.
Ploutz-Snyder, L. L., Tesch, P. A., Crittenden, D. J. & Dudley, G. A. (1995). Effect of unweighting on skeletal muscle use during exercise.Journal of Applied Physiology 79, 168—175.
Rowell, L. B. (1974). Human cardiovascular adjustments to exercise and thermal stress.Physiological Reviews54, 75—159.
Saltin, B. (1977). The interplay between peripheral and central factors in the adaptive response to exercise and training.Annals of the New York Academy of Sciences 301, 224—231.
Saltin, B., Blomqvist, C. G., Mitchell, J. H., Johnson, R. L., Wildenthal, K. & Chapman, C. B. (1968). Response to exercise after bed rest and after training.Circulation38, suppl. 7, 1—78. Sant’Ana Pereira, J. A. A., Wessels, A., Nijtmans, L., Moorman,
A. F. M. & Sargeant, A. J. (1995). New method for the accurate characterization of single human skeletal muscle fibres demonstrates a relation between mATPase and MyHC expression in pure and hybrid fibre types.Journal of Muscle Research and Cell Motility16,
21—34.
Siggaard-Andersen, O. & Siggaard-Andersen, M. (1990). The oxygen status algorithm: a computer programme for calculating and displaying pH and blood gas data.Scandinavian Journal of Clinical Laboratory Investigation, suppl. 203, 29—45.
Srere, P. A. (1969). Citrate synthase. Methods in Enzymology 13, 3—5.
Sullivan, M. J., Binkley, P. F., Unverferth, D. V., Ren, J. H., Boudoulas, H., Bashore, T. M., Merola, A. J. & Leier, C. V. (1985). Prevention of bedrest-induced physical deconditioning by daily dobutamine infusions. Journal of Clinical Investigation 76, 1632—1642.
Takahashi, H., Wada, M. & Katsuda, S. (1991). Expressions of myosin heavy chain IId isoform in rat soleus muscle during hindlimb suspension.Acta Physiologica Scandinavica 143, 131—132. Thomason, D. B. & Booth, F. W. (1990). Atrophy of the soleus muscle by hindlimb unweighting.Journal of Applied Physiology 68, 1—12. Turner, D. L., Hoppeler, H., Noti, C., Gurtner, H. P., Gerber,
H., Schena, F., Kayser, B. & Ferretti, G.(1993). Limitations to ýOµ,maxin humans after blood retransfusion.Respiration Physiology
92, 329—341.
Wagner, P. D. (1996). Determinants of maximal oxygen transport and utilization.Annual Review of Physiology58, 21—50.
Weibel, E. R. (1979).Stereological Methods.Academic Press, London. Weibel, E. R., Taylor, C. R. & Hoppeler, H. (1992). Variations in function and design: testing symmorphosis in the respiratory system.Respiration Physiology 87, 325—348.
Acknowledgements
This study was part of the Head Down Tilt (HDT) 94 Bed Rest project of the European Space Agency (ESA), which was jointly organized by the ESA and by the Centre National d’Etudes Spatiales (CNES), Toulouse, France. The subjects’ selection, the logistic support for the experiments, the scientific co-ordination among groups and the medical follow-up of the subjects during the bed rest period were warranted by the Institut de Medecine et Physiologie Spatiales, Toulouse, France. Particularly, we acknowledge the collaboration of Alain Maillet, Guillaume Weerts and Joel Le Kernau. We would also like to thank Dr Robert Aziza from Department of Radiology, Hˆopital Rangueil, Toulouse, for having performed NMR scanning, and the German Institute of Aerospace Medicine, Koln, Germany, for having provided the Ground Respiratory Monitoring System. We are grateful to Helgard Claassen(Bern), Marie-Hel`ene Mayet (Lyon) and Christian Moia(Gen`eve) for technical aid. Financial support to this study was provided by the ESA, the CNES (grant no. 94Ï0395), the Swiss Federal School of Sport Sciences, and the Italian Space Agency.
Author’s email address
G. Ferretti: [email protected]