BBA - Molecular Cell Research 1868 (2021) 118913
Available online 25 November 2020 0167-4889/© 2020 Published by Elsevier B.V.
NCOA4-mediated ferritinophagy promotes ferroptosis induced by erastin,
but not by RSL3 in HeLa cells
Magdalena Gryzik, Michela Asperti, Andrea Denardo, Paolo Arosio, Maura Poli
*Department of Molecular and Translational Medicine, University of Brescia, Viale Europa 11, 25123 Brescia, Italy
A R T I C L E I N F O Keywords: Ferroptosis Ferritin Iron Ferritinophagy NCOA4 A B S T R A C T
Ferroptosis is a regulated cell death characterized by a lethal accumulation of lipid peroxides due to an increase of intracellular iron and a decrease of antioxidant capacity. The reduction of antioxidant activity is obtained by using chemical agents, such as erastin and RSL3, the first one inhibiting the transmembrane cystine-glutamate antiporter causing a cysteine and glutathione depletion and the second one inactivating directly the gluta-thione peroxidase 4 (GPX4) respectively. The role of iron and its related proteins in supporting the formation of lipid peroxides, is not completely understood hence to try to shed light on it we generated HeLa clones with altered ferritinophagy, the ferritin degradation process, by knocking-out or overexpressing Nuclear Receptor Coactivator 4 (NCOA4), the ferritin autophagic cargo-receptor. NCOA4 deficiency abolished ferritinophagy increasing ferritin level and making the cells more resistant to erastin, but unexpectedly more sensitive to RSL3. Interestingly, we found that erastin promoted ferritinophagy in HeLa cells expressing NCOA4, increasing the free iron, lipid peroxidation and the sensitivity to ferroptosis. In contrast, RSL3 did not modulate ferritinophagy, while NCOA4 overexpression delayed RSL3-induced cell death suggesting that RSL3 mechanism of action is independent of ferritin degradation process. Therefore, the ferritin-iron release in the execution of ferroptosis seems to depend on the inducing compound, its target and downstream pathway of cell death activation.
1. Introduction
The intracellular level of iron is tightly regulated by controlling its uptake, storage and efflux in order to ensure its adequate levels for fundamental biological processes and, at the same time, to protect the cells from its toxicity due to its involvement in reactive oxygen species (ROS) generation through Fenton chemistry [1]. Recently, a new form of iron-dependent cell death was identified and named ferroptosis [2], with morphological, biochemical and genetic features distinct from those of necroptosis, apoptosis and autophagy, but characterized by an overwhelming accumulation of the harmful lipid peroxides due to the disrupted cellular antioxidant mechanisms (mainly the GSH/GPX4 axis) and an increased intracellular free iron [3,4]. Free iron is considered to contribute to the lipid peroxidation and cell death not only by attacking polyunsaturated fatty acid (PUFA) residues in lipid bilayers in a non- enzymatic manner [5] but also in the enzymatic process supporting the activity of lipoxygenases (LOXs), the iron-enzymes responsible for the lipid peroxides synthesis through the dioxygenation of free and esterified PUFAs [6].
The function of GPX4 together with the upstream activity of system XC− (a cystine/glutamate antiporter) and the consequent production of GSH (the GPX4 cofactor), is to reduce complex hydroperoxides, including phospholipid hydroperoxides and cholesterol hydroperoxides, to the non-toxic lipid alcohols, interrupting the lipid peroxidation chain reaction. Thus, the system XC−/GSH/GPX4 axis is the principal target to induce the process of ferroptosis [2,7,8] which, in fact, has been mainly studied by using chemical compounds that alter the redox status of the cell and the system XC−/GSH/GPX4 axis. The first and most used mole-cule is erastin that inhibits system XC−, leading to cysteine depletion in the cells, reduction of glutathione (GSH) level required for the lipid repair function of GPX4 enzyme with the consequent accumulation of lipid peroxides and death by ferroptosis [9]. The second well-studied ferroptosis inducer is RSL3 (RAS-selective lethal 3) that inhibits directly the activity of GPX4. It acts by alkylating the nucleophilic active-site of selenocysteine of GPX4, which interacts with the reduced form of the adaptor protein 14-3-3ε, causing the loss of lipid repair and
the accumulation of lethal lipid peroxides and cell death by ferroptosis without affecting GSH and system XC− [10].
* Corresponding author.
E-mail addresses: [email protected], [email protected] (M. Poli).
Contents lists available at ScienceDirect
BBA - Molecular Cell Research
journal homepage: www.elsevier.com/locate/bbamcrhttps://doi.org/10.1016/j.bbamcr.2020.118913
In this context, ferritin shell (composed by H and L subunits), with its iron-storage capacity, could be a major iron-related protein involved in ferroptosis preventing ROS generation in the Fenton reaction and pro-tecting cells from an oxidative stress [11]. Moreover ferritinophagy, the autophagic process leading to the degradation of ferritin and ferritin- iron release, can increase free iron availability sensitizing the cells to ferroptosis. Ferritinophagy is regulated by cellular iron level itself [12,13], specifically, under conditions of iron deficiency NCOA4 binds ferritin and delivers it to the autophagosome, where after lysosomal degradation of ferritin, iron is released and exported to the cytosol increasing Labile Iron Pool (LIP). In iron-rich conditions, ferritinophagy occurs with lower frequency, since NCOA4 is targeted for proteasomal degradation [14]. The systemic NCOA4 depletion in mouse model led to ferritin accumulation in tissues and aberrant erythropoiesis with anemia [15]. Recent studies indicated that NCOA4-mediated ferritinophagy is crucial for iron mobilization during erythroid cells development [16,17]. Moreover, NCOA4 is involved in cell division by regulating microtubule activity during mitosis [18] and controls DNA replication origin activation [19]. Interestingly, increase of NCOA4-mediated fer-ritinophagy was found to promote ferroptosis by extensive ferritin iron release that maintains elevated intracellular iron level, which in turn catalyzes the Fenton reaction, leading to the ROS accumulation [20]. Several studies confirmed that NCOA4-mediated degradation of ferritin contributes to the erastin-induced ferroptosis in mouse primary pul-monary fibroblasts [21], mouse embryonic fibroblasts [20], human fibrosarcoma HT-1080 [20,22] and human pancreatic cancer PANC1 [22].
Although it is known that iron contributes to the ferroptotic cell death, the role of ferritin and NCOA4 in triggering or sustaining lipid peroxidation in combination with the two main ferroptosis inducers is still not completely clear. Therefore, we generated cell clones with knocked-out or overexpressed NCOA4 to better characterize the involvement of NCOA4 and ferritin degradation in ferroptosis induced by erastin and RSL3. The results demonstrated that ferritinophagy contributes to the erastin-triggered ferroptosis, while RSL3 triggers it with a ferritinophagy-independent process.
2. Materials and methods 2.1. Chemicals
The chemicals used were: iron chelator DFO (Desferoxamine, S0080A, Novartis), FAC (Ferric Ammonium Citrate, F5879, Sigma- Aldrich), ascorbic acid (A4034, Sigma-Aldrich, Saint Louis, MO) all dissolved in water; Calcein-AM (Calcein-acetoxymethyl ester, C-3100, Molecular Probes), erastin (S7242, Selleckchem), RSL3 (S8155, Sell-eckchem; SML2234, Sigma), Sorafenib (S7397, Selleckchem), ML162 (SML2561, Sigma) ferrostatin-1 (SML0583, Sigma), necrosulfonamide (S8251, Selleckchem), Z-VAD-FMK (S7023, Selleckchem) all dissolved in DMSO; C11-BODIPY™ 581/591 probe (D3861, Thermo Scientific). 2.2. Cell culture
The human HeLa cell line (from IZSLER, Brescia Italy) and generated clones were cultured in Dulbecco’s Modified Eagle’s Medium (DMEM, Gibco from Life technologies) supplemented with 8% endotoxin-free fetal bovine serum (Sigma-Aldrich), 0.04 mg/mL gentamicin (Gibco), 2 mM L-glutamine (Gibco), and 1 mM sodium pyruvate (Carlo Erba).
The human hepatocellular carcinoma HA22T/VGH cell line (pro-vided by Dr. A. Salvi and Prof. G. De Petro, University of Brescia, Italy) was maintained in RPMI-1640 (EuroClone, Milan, IT) supplemented with 10% endotoxin-free fetal bovine serum, fungizone (Gibco, Life Technologies, Carlsbad, CA), 10 U/0.1 mg/mL Penicillin-Streptomycin (Sigma Aldrich, Saint Louis, MO), 2 mM L-glutamine, 1 mM sodium pyruvate.
All cell lines were maintained at 37 ◦C in a humidified atmosphere
with 5% CO2.
2.3. Stable cell transfection with pCMV/mNCOA4
HeLa cells were transfected with pCMV/mNCOA4 (MR209544, Origene) or empty vector and transfection was carried out with Lip-ofectamin3000 Reagent (L3000-001, Invitrogen), according to the manufacturer’s instructions. After 48 h the complete culture medium was supplemented with 1 mg/mL of G418 (Euroclone) for the selection of positive clones. Antibiotic-resistant clones were visible approximately after 2 weeks and they were picked up and cultured. The clones were analyzed for the expression of mNCOA4 in qRT-PCR (Section 2.6.) and we selected a representative clone. The concentration of antibiotic was decreased by half (0.5 mg/mL of G418) in order to maintain the stable clone. The presence of empty vector was verified by PCR (Section 2.5.). HA22T/VGH cells were transfected as described above. After 48 h the complete culture medium was supplemented with 0.5 mg/mL of G418 for two weeks of the selection. The cell pool was analyzed for the expression of mNCOA4 in qRT-PCR (Section 2.6.).
2.4. CRISPR-mediated genome editing
CRISPR/Cas9-mediated genome editing was used to generate clonal NCOA4 knockout HeLa cell lines. The gRNA sequence (previously used by Mancias et al., 2015 [14]) was cloned into pX330 vector (pX330-U6- Chimeric_BB-CBh-hSpCas9 was a gift from Feng Zhang, Addgene plasmid #42230; http://n2t.net/addgene:42230; RRID:Addg-ene_42,230) for simultaneous gRNA and Cas9 expression. Cells were transfected with pX330/NCOA4 along with empty pTK vector harboring hygromycin resistance using Lipofectamin3000 Reagent (Invitrogen), according to the manufacturer’s instructions. After 48 h the complete culture medium was supplemented with 300 μg/mL of hygromycin
(Sigma) for the selection of positive clones. Antibiotic-resistant clones were visible approximately after 2 weeks and they were picked up and cultured. Clonal colonies were screened for mutation by High Resolution Melting analysis (HRM) and for NCOA4 expression by western blot. Genomic alterations were confirmed by Sanger DNA sequencing. 2.5. DNA extraction, high resolution melting and sequencing
Total cell DNA was isolated with The Wizard Genomic DNA Purifi-cation Kit (Promega), according to the manufacturer’s instruction. High resolution melting (HRM) analysis was performed using 10 ng of DNA, primers for 5′-GCCAGACCATCACCACA-3′ and rev 5′- GTCATTGCCTTTGGTGC-3′, and PowerUp SYBR Green Master Mix (Life Technologies), according to the manufacturer’s instructions. Positive samples with modified melting curve comparing to wild-type were chosen for sequencing. Polymerase chain reaction (PCR) was performed using 150 ng DNA, dNTPs, primers used for HRM, Phusion High-Fidelity DNA polymerase (Thermo Scientific). The product of PCR was verified in 2% agarose gel with ethidium bromide and processed by enzymatic removal of primers and nucleotides using EuroSAP PCR Enzymatic Clean-up Kit (Euroclone), according to the manufacturer’s instructions. Sequencing was performed with Sanger method by BMR Genomics and analyzed in software ChromasLite v2.1.
PCR to verify cell transfection with empty vector was performed as above using Xtra Taq polymerase (GeneSpin Srl) and primers for 5′- TAATACGACTCACTATAG-3′ and rev 5′-TAGAAGGCACAGTCGAGG-3′. The product of PCR was verified in 1% agarose gel with ethidium bromide.
2.6. RNA preparation and quantitative qRT-PCR
Total cell RNA was recovered with TRI Reagent (Sigma-Aldrich) according to the manufacturer’s instruction. Reverse transcription was performed using 1 μg RNA, oligodT, and Improm Reverse Transcriptase
(Promega). Samples were used for quantitative reverse transcription polymerase chain reaction (qRT-PCR) assay, using PowerUp SYBR Green Master Mix (Life Technologies), according to the manufacturer’s in-structions. The primers used are listed in the Table 1.
2.7. Immunoblotting
Protein extracts were prepared using lysis buffer (200 mM Tris-HCl at pH 8, 100 mM NaCl, 1 mM EDTA, 0.5% NP-40, 10% glycerol, 1 mM sodium fluoride, 1 mM sodium orthovanadate; Complete Protease Inhibitor Cocktail, Sigma) and proteins were quantified by MicroBCA Protein Assay Kit (Thermo Scientific). 20–60 μg of proteins were
sepa-rated by 10–15% SDS-PAGE and transferred to Hybond-P Membrane (GE). The primary antibodies used for immunoblotting assay were: β-Actin (TA811000, Origene), GAPDH (sc-47724, Santa Cruz Biotech-nology), Tubulin (T5168, Sigma), Ferritin (F5012, Sigma; 4393S, Cell Signaling), NCOA4 (generous gift from Prof. Francesca Carlomagno, Universit`a degli Studi di Napoli Federico II, Italy), NRF2 (sc-365,949, Santa Cruz Biotechnology), HO-1 (sc-136960, Santa Cruz Biotech-nology), GPX4 (sc-166,570, Santa Cruz BiotechBiotech-nology), FSP1 (sc- 377120, Santa Cruz Biotechnology), LOX5 (sc-136,195, Santa Cruz Biotechnology), LC3B (TA301543, Origene), Caspase-3 (9661, Cell Signaling). After incubation with horseradish peroxidase-conjugated secondary antibodies (HRP-conjugated anti-mouse no. sc-516,102, Santa Cruz Biotechnology, Dallas, TX; anti-rabbit no. A120-101P, Bethyl Laboratories), membranes were developed with SuperSignal West Pico Chemiluminescent Substrate (Thermo Scientific-Pierce) and visualized with LI-COR (Odyssey) or on CL-XPosure Film (Thermo Sci-entific). Band intensity was quantified by densitometry analysis using ImageJ software.
2.8. Calcein-AM assay
The cellular LIP was measured as described elsewhere, with minor modification [23]. Briefly, HeLa cells (3 × 10⁴) were seeded on 96-well plates. The cells were incubated with 0.25 μM Calcein-AM in MEM with
1 mg/mL BSA for 30 min at 37 ◦C. After washing with 1× phosphate- buffered saline (PBS), 100 μL of 1× Hank’s Balanced Salt Solution
(HBSS) was added to the cells and the fluorescence was monitored at an excitation of 488 nm and an emission of 517 nm using EnSight Multi-mode plate reader (Perkin Elmer). The data were expressed as per-centage over the not-treated cells. The quenching of Calcein-AM is inversely proportional to the concentration of intracellular iron. 2.9. Prussian blue staining
To increase the percentage of ferritins in the protein extracts, we exploited the thermostability of these proteins. The protein samples of 200 μg were warmed at 70 ◦C for 10 min. Samples were centrifuged at 13000 rpm for 10 min and the supernatant protein was loaded on 8% non-denaturating gel. Gel was run for 3 h at 160 V. After electrophoresis,
the gel was washed with water and then incubated in a Prussian blue solution (2% ferrocyanide, 2% HCl) for 1 h at RT. To enhance the signal, the gel was incubated in a solution containing 0.025% DAB (3,3′ -Dia-minobenzidine, Sigma) and 0.05% H2O2 in 1× TBS for 15–30 min at RT. The reaction was blocked with tap water.
2.10. GPX4 activity
The GPX4 activity was measured as previously reported [24]. Cell pellets from one 75 cm2 flask were lysed on ice in 0.3 mL of lysis buffer (0.1 M KH2PO4/K2HPO4, 0.15 M KCl, 0.05% (w/v) CHAPS, pH 7, 1 × 10⁻³ M 2-mercaptoethanol, protease inhibitors cocktail) by sonication (in 3.175 mm diameter probe three cycles of 5 s, at intervals of 10 s, at frequency of 20 kHz and 40% of amplitude). Then samples were centrifuged at 17000 g for 20 min and 0.2–0.4 mg of proteins from su-pernatant were used for the assay. Samples were incubated for 5 min at RT in 1 mL of 0.1 M KH2PO4/K2HPO4, pH 7.8 containing 5 × 10⁻³ M EDTA, 5 × 10⁻³ M GSH, 0.1% (v/v) Triton X-100, 0.16 × 10⁻³ M NADPH and 180 IU/mL Glutathione Reductase (GR). After recording the baseline for 20–30 s, GPX4 enzymatic activity was triggered by adding 0.025 × 10⁻³ M phosphatidylcholine hydroperoxide (PCOOH) and quantified as the decrease of absorbance at 340 nm due to NADPH oxidation by GR. GPX4 activity was expressed as nmoles/min/mg of protein extract.
2.11. Ferroptosis induction
The cells were seeded on 96-well plates and treated with 0-1-2.5-5- 7.5 μM erastin or 0-12.5-5-7.5 μM RSL3 for 8-24-48h for dose-response
curves; treated with 0-1-2.5-5-7.5-10-15 μM sorafenib for 48 h or 0-1-
2.5-5-7.5 μM ML162 for 8 h; co-treated with 7.5 μM erastin or 5 μM RSL3
and 10 μM ferrostatin-1 or 5 μM necrosulfonamide or 10 μM Z-VAD-FMK
for 24 h; co-treated with 5 μM erastin or 5 μM RSL3 and 500 μM FAC (in
the presence of 100 μM Ascorbic Acid). Cell viability was measured by
MTT assay. For ELISA and western blot, the cells were seeded on 12-well plates and treated with 1 μM erastin or 0.5 μM RSL3 in serum-free
me-dium for 4-8-24-48 h and processed for protein extraction. 2.12. Cell viability assay (MTT assay)
The cells were incubated in 0.5 mg/mL MTT (3-[4,5-dimethyl-2- thiazolyl]-2,5-diphenyl-2H-tetrazolium bromide, M5655, Sigma) in cell medium for 3.5 h at 37 ◦C. The insoluble formazan was dissolved in DMSO (Sigma) and the absorbance was measured at 540 nm using a MultiskanEx plate reader (Thermo).
2.13. Lipid ROS assay
The cells were seeded on glass coverslips, treated with 1 μM erastin
or 0.5 μM RSL3 for 24 h followed by 30 min incubation with C11-
BODIPY™ 581/591 probe. After three washes with 1× phosphate- Table 1
Primers used for human cell lines.
Forward Reverse
HsHprt1 5′-TGCTTTCCTTGGTCAGGCAG-3′ 5′-AAGCTTGCGACCTTGACCAT-3′
HsNCOA4 5′-CTTTGGGCCGTAGGTTAGTG-3′ 5′-GTTCTCTATTACTGGAGCTGCC-3′
pCMV/mNCOA4 5′-TCCTCAAGTATTGGGCCTTTC-3′ 5′-GTACATAAGGAGCCTGAAGAC-3′
HsGPX4 5′-GCCATCAAGTGGAACTTCACC-3′ 5′-CTTCTCTATCACCAGGGGCTC-3′
HsNRF2 5′-CACATCCAGTCAGAAACCAGTGG-3′ 5′-GGAATGTCTGCGCCAAAAGCTG-3′
HsNQO1 5′-CCTGCCATTCTGAAAGGCTGGT-3′ 5′-GTGGTGATGGAAAGCACTGCCT-3
HsTxnR1 5′-GGTCCAACCTTGAAGGCTTA-3′ 5′-CATATTGGGCTGCCTCCTTA-3′
HsHO-1 5′-GCTGTAGGGCTTTATGCCATGT-3′ 5′-GGCTCCTTCCTCCTTTCCAGAG-3′
HsLOX5 5′-CCGGCACTGACGACTACAT-3′ 5′-TCCACAGTCACGTCGTATGAA-3′
HsFSP1 5′-ATGGTTCGGCTGACCAAGAG-3′ 5′-GCCACCACATCATTGGCATC-3′
buffered saline (PBS), cells were fixed with 4% paraformaldehyde fol-lowed by staining with 0.1 μg/mL solution of DAPI dye. Images were
collected using Zeiss fluorescence Axiovert microscope with a CCD black-and white TV camera (SensiCam-PCO Computer Optics GmbH, Germany). Analysis of images was done by ImageJ software. Quantifi-cation of lipid peroxidation with the green fluorescence normalized to DAPI was performed using ImageJ software and data were expressed as fold change over the not-treated cells.
2.14. ELISA assay
The 96-well plates were coated with 0.1 mL of primary antibody against ferritin-H (RH02) (10 μg/mL diluted in 50 mM carbonate buffer
pH 9.6) for 18 h at 4 ◦C. After three washes with phosphate buffer saline with 0.1% Tween20 (PBST), the wells were over-coated by adding 0.1 mL of 3% bovine serum albumin (BSA) diluted in PBS for 1 h at 37 ◦C. After washing with PBST, 5–10 μg of protein extract for FTH analysis
were aliquoted, diluted in 1% BSA-PBST and incubated at 37 ◦C for 2 h. A standard curve using recombinant human FTH was added into the plate, as calibrator. After three washings in PBST, 0.1 mL of anti-FTH antibody HRP-labelled (diluted 1:500 in 1% BSA-PBST) were added and plate incubated for 1 h at 37 ◦C. After three washings in PBST, HRP activity was detected using 1 mg/mL tetramethylbenzene (TMB) dis-solved in dimethyl sulfoxide (DMSO) and diluted 1:10 in phosphate- citrate buffer pH 5 with added fresh hydrogen peroxide to final con-centration 0.006% and the absorbance read at 620 nm by Multiskan©EX plate reader. The reaction was stopped by adding 1 N sulphuric acid and the absorbance was measured at 405 nm. The concentration of ferritins was extrapolated from the calibrator curve and expressed as ng of ferritin/mg of protein extract.
2.15. Stable cell transfection with pcDNA3.1 and pcDNA3.1/hFTH-FLAG HeLa cells were transfected with pcDNA3.1 or pcDNA3.1/hFTH- FLAG and transfection was carried out with Xfect Transfection Re-agent (PT5003-2, Clontech Laboratories, Inc.A Takara Bio Company), according to the manufacturer’s instructions. After 24 h the complete culture medium was supplemented with 1 mg/mL of G418 (Invitrogen) for 2 weeks of the selection.
2.16. Immunofluorescent cytochemical staining
The cells were seeded on glass coverslips and treated with 1 μM
erastin or 0.5 μM RSL3 for 8 h. After washing with 1× phosphate-
buffered saline (PBS), cells were fixed with 4% paraformaldehyde. Cells were washed three times with PBS followed by staining with 0.1
μg/mL solution of DAPI dye. After three washes, cells were
per-meabilized by incubation with 0.25% Triton X-100 in PBS for 5 min. After 2–3 washes for 5 min, cells were incubated with 10% BSA in PBS for 30 min at 37 ◦C, followed by the incubation with anti-FLAG antibody (F1804, Sigma) and anti-LC3B antibody (TA301543, Origene) at 1:250 dilution each in 3% BSA/PBS for 2 h at 37 ◦C. After washing as before, cells were incubated with the Alexa Fluor 488-conjugated goat anti- mouse IgG (115-545-146, Jackson Immuno Research Laboratories) and the Cy3-conjugated donkey anti-rabbit IgG (711-165-152, Jackson Immuno Research Laboratories) at 1:300 dilution each in 3% BSA/PBS for 45 min at 37 ◦C. After washing with PBS, coverslips were mounted on glass slides and sealed. Images were collected using Zeiss fluorescence Axiovert microscope with a CCD black-and white TV camera (SensiCam- PCO Computer Optics GmbH, Germany) and processed by ImageJ software.
2.17. Statistics
Data are presented as mean ± standard error of mean (SD). Data of experiments are expressed as percentage or fold increase with respect to
not-treated cells. Comparison of values between untreated and treated cells was performed by Student t-test for unpaired data. Differences were defined as significant for: ****P < 0.0001, ***P < 0.001, **P < 0.01, *P <0.05.
3. Results
3.1. Generation and characterization of HeLa cell clones in which NCOA4 has been knocked-out and overexpressed
The NCOA4 knockout HeLa cells (named NCOA4 KO) were gener-ated using the CRISPR/Cas9 technology. Two clones were selected and characterized, clone B3 has homozygous deletion of two nucleotides next to the PAM target, resulting in frameshift and the expression of a truncated protein of 70 amino acids with deletion of the FTH-binding domain (Fig. S1 a-d), and clone A3 has one allele with a nucleotide deletion, and the other with four-nucleotide deletion next to the PAM target, both producing frameshift and premature stop codons (Fig. S1 a- d). Western blots confirmed the absence of NCOA4 in the two clones (Fig. 1a). The HeLa clone stably overexpressing NCOA4 (named mNCOA4) was obtained by transfecting cells with a pCMV plasmid that encodes mouse NCOA4 (79% identity with human NCOA4, with conserved FTH-binding domain) and the expression of the mouse NCOA4 was verified by qRT-PCR (Fig. 1b). The basal level of ferritin was higher in NCOA4 KO clones and lower in mNCOA4 clones, probably caused by different rates of ferritin degradation.
It is known that high levels of iron inhibit the binding of NCOA4 to ferritin [25] and favor proteasomal degradation of NCOA4 limiting ferritinophagy, whereas in the conditions of iron deprivation the ferri-tinophagy level is elevated [14]. Thus, initially the clones were verified for their capacity to trigger ferritinophagy using iron (ferric ammonium citrate, FAC) or/and iron chelator (desferoxamine, DFO) treatments. Iron supplementation induces ferritin synthesis in HeLa cells, then the addition of the iron chelator DFO promotes its degradation through ferritinophagy. In control HeLa cells, a 24-h pre-treatment with 36 μM
FAC increased ferritin level of about 2-fold and the following 24-h treatment with 100 μM DFO caused a major decrease of ferritin below
the initial levels, as expected (Fig. 1c and Fig. S2). In the NCOA4 KO B3 and A3 clones the iron treatment induced a 2-fold ferritin increase and that remained unchanged even after the DFO treatment (Fig. 1c and Fig. S2) consistent with the absence of NCOA4–mediated ferritin degradation [12]. Since we expected increased ferritin degradation in NCOA4 overexpressing cells, it was sufficient to treat cells with DFO without iron pre-treatment. Indeed, in the mNCOA4 clone a 24-h treatment with 100 μM FAC caused an induction of ferritin lower than
that of the control HeLa cells, and the incubation for 24 h in 100 μM DFO
decreased notably the level of ferritin (Fig. 1d) supporting the NCOA4- mediated ferritin degradation.
The changes in ferritin content can be associated with the different intracellular iron level. To evaluate this, LIP was measured using the Calcein-AM assay. Calcein-AM is a fluorescent probe absorbed by the cells, whose signal is quenched by the binding to iron(II), thus the higher fluorescence detected inside the cells, the lower is the level of LIP. The results showed a significant decrease of fluorescence of about 20% in the two NCOA4 KO clones (Fig. 1e), indicating an increase of LIP. This is in line with the observation that the increased basal level of ferritin in NCOA4 KO clones, thus a lower iron bioavailability for cell function-ality, mimicking a condition of “iron-deficiency”, leads to the higher expression of Transferrin Receptor 1 (TfR1) protein level (not shown) to compensate the iron insufficiency. On the other hand, when NCOA4 was overexpressed (mNCOA4 clone), a 50% decrease of calcein fluorescence was observed (Fig. 1e) indicating a major increase in free iron, as ex-pected. With the aim to understand where the iron excess is distributed in the clones, the iron incorporated into the ferritin was analyzed by staining with DAB-enhanced Prussian Blue the cell homogenates sepa-rated on non-denaturing PAGE. We observed stronger signal in both the
NCOA4 KO clones and a lower signal in the mNCOA4 clone (Fig. 1f), in agreement with the LIP measurement and ferritin level. Next the clones were treated for 24 h with 100 μM FAC and ferritin-iron was analyzed as
before. Interestingly, they all reached similar levels, indicating that the amount of NCOA4 has no impact on iron loading into ferritin (not shown).
Since both NCOA4 KO cell lines showed similar phenotype (abol-ished ferritinophagy, increased LIP and ferritin-iron), the NCOA4 KO B3 clone was chosen for further analyses together with control and mNCOA4 HeLa cell lines.
3.2. Expression of genes and proteins of oxidative stress in NCOA4 KO and mNCOA4 clones
Oxidative stress is tightly linked to cellular iron regulation, thus we analyzed the basal expression of genes and proteins regulating pro- and anti-oxidative cellular status focusing on those that are associated with iron metabolism and ferroptosis [7,26–29,49,50,58–60] (Table S1).
GPX4 is the principal enzyme detoxifying lipid peroxides and is considered one of main regulators of ferroptosis [7]. Its mRNA and protein levels were found to be 1.4-fold higher in NCOA4 KO B3 clone compared to control and mNCOA4 cells (Fig. S3 and Fig. S4), however its enzymatic activity was not significantly different in the three cell lines (Fig. S5). Recent studies identified ferroptosis suppressor protein 1 (FSP1), ubiquinone oxidoreductase, which reduces lipid ROS
independently of GPX4 activity and glutathione level and protects cells from ferroptotic cell death [26,27]. The mRNA level of FSP1 was 1.2- fold higher in NCOA4 KO B3 clone compared to the control and mNCOA4 cell lines (Fig. S3), however the FSP1 protein level did not differ significantly between cell lines (Fig. S4). The other mechanism independent of the GPX4/glutathione axis involves GTP cyclohydrolase- 1 (GCH1) which suppresses ferroptosis by synthesis of antioxidant tet-rahydrobiopterin (BH4) that causes lipid remodeling [28]. Moreover GCH1/BH4 system controls the abundance of coenzyme Q10, a substrate of FSP1 [26–28]. An 1.3-fold increase of GCH1 mRNA level was found in NCOA4 KO B3 cells and no significant differences between control and NCOA4-overexpressing cells (Fig. S3).
The mRNA level of NRF2, which is the transcriptional factor for FTH and heme oxygenase 1 (HO-1) regulating iron homeostasis in the response to the oxidative stress [29], was almost 2-fold higher in NCOA4-depleted cells than in control (Fig. S3), however the protein level in both NCOA4 knocked-out and overexpressing cells was not significantly different from the control (Fig. S4). We verified also the mRNA and protein expression of HO-1, a target of NRF2. The HO-1 mRNA was upregulated of about 1.5-fold in NCOA4 KO B3 cells without significant differences in protein level compared to control. Moreover, the NCOA4 KO B3 clone showed a 10–11 fold increase of lipoxygenase 5 (LOX5) mRNA expression compared to control HeLa (Fig. S3), but the protein was undetectable in all cell lines (not shown), consistent with the published data about trace levels of LOX5 in HeLa Fig. 1. Differences in phenotype between NCOA4 knockout and NCOA4 overexpressing cells. (a) Western Blotting for NCOA4 in control and NCOA4 KO HeLa cells. (b) qPCR for mouse NCOA4 in HeLa overexpressing mNCOA4 and control HeLa cells. The levels of mRNA are expressed as 2ˆ(-dCt) related to HPRT1. Bars and error bars represent mean values and standard deviation, respectively. (c) Lysates from control HeLa and NCOA4 KO B3 cells pre-treated with 36 μM FAC for 24 h followed by 24-h incubation with 100 μM DFO were immunoblotted for ferritin and β-Actin as a loading control. (d) Lysates from control HeLa and mNCOA4 cells treated with 100 μM FAC or 100 μM DFO for 24 h were immunoblotted for ferritin and β-Actin as a loading control. (e) Calcein-AM assay for labile iron pool quantification in control, KO (clones A3 and B3) and overexpressing NCOA4 HeLa cells. The values are expressed as percentage of the fluorescence detected. Bars and error bars represent mean values and standard deviation, respectively. (f) Prussian blue and DAB-enhanced staining to analyze the ferritin-iron content in control, KO (clones A3 and B3) and overexpressing NCOA4 HeLa cells. Coomassie blue staining was used to normalize the loading.
cells [30]. In contrast, the mNCOA4 clone showed a significant decrease of HO-1 mRNA and protein, of quinone oxidoreductase-1 (NQO1) and thioredoxin reductase (TxnR) mRNAs, involved in the antioxidant response (Fig. S3).
These data suggest that NCOA4 level may affect the expression of genes involved in oxidative damage (increased GPX4, FSP1, GCH1, NRF2, HO-1 mRNAs in NCOA4 KO B3 clone; decreased HO-1, NQO1, TxnR mRNAs in mNCOA4 cells). Despite the changes in the transcript levels, it is unclear whether these are biologically relevant, since the correspondent protein levels resulted to be comparable to the control, possibly due to the regulation at post-transcriptional and/or post- translational levels.
3.3. NCOA4 expression confers different sensitivity to the ferroptosis inducers erastin and RSL3
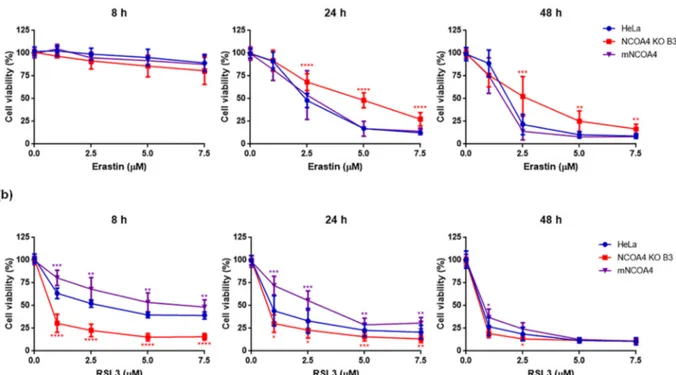
Recent studies showed that NCOA4 is a negative regulator of fer-roptosis [31] and that NCOA4 down-regulation limits erastin-induced ferroptosis, whereas NCOA4 overexpression promotes it [22]. To verify this, we analyzed ferroptosis in NCOA4 KO B3, mNCOA4 and control HeLa cells after the treatment with different doses of erastin, which induces ferroptosis by inhibiting the cystine/glutamate antiporter system or RSL3, the other major inducer of ferroptosis that acts by inhibiting the GPX4 activity [9], at different times of incubation. In these experiments the wild-type HeLa cells were used as a control, since in the preliminary experiments the non-transfected cells showed same sensitivity to ferroptosis inducers as the cells transfected with the empty vector and subjected to G418 selection (Fig. S6a-c). The cells were treated with erastin 0, 1, 2.5, 5 or 7.5 μM and viability was measured
after 8, 24 and 48 h with MTT assay. As expected, after 8 h the cell viability was unchanged, but after 24 h the NCOA4 KO B3 cells showed reduced cell death (30, 50 and 75% with erastin 2.5, 5 and 7.5 μM,
respectively) than control HeLa cells, which behaved similarly to the mNCOA4 cells (50, 80 and 90% with erastin 2.5, 5 and 7.5 μM,
respectively) and the trend was confirmed also after 48 h of the treat-ment (Fig. 2a). The results support the concept that NCOA4 expression
and the NCOA4-dependent ferritin degradation are involved in the sensitivity to erastin-induced ferroptosis. RSL3 was even more effective and faster than erastin with an evident inhibition of cell viability already at 8 h. Surprisingly, the NCOA4 KO B3 cells were more sensitive to the treatment showing 30% cell viabilty at lowest RSL3 dose at 8 and 24 h, whereas the mNCOA4 were the more resistant ones with viability of 80% and 72%, respectively (Fig. 2b). Thus, the different levels of NCOA4 expression had an effect on RSL3 treatment that was just the opposite of that caused by erastin.
To verify if the observed effect is dependent on the target of the inducer, the cells were treated with sorafenib (0, 1, 2.5, 5, 7.5, 10 or 15
μM for 48 h) and ML162 (0, 1, 2.5, 5 or 7.5 μM for 8 h), ferroptosis
inducers with the mechanisms of action similar to that of erastin and RSL3, respectively. The NCOA4 KO cells showed lower reduction of cell viability after sorafenib treatment than mNCOA4 and control HeLa cells, confirming tendency observed after erastin treatment (Fig. 3a). The difference in cell viability between clones was not as pronounced as after erastin, however sorafenib has multiple targets thus could affect also other pathways. We observed the same effect after treatment with ML162 as with RSL3, the NCOA4 KO B3 cells were more sensitive to the ML162-induced ferroptosis than cells expressing NCOA4 (Fig. 3b), suggesting that NCOA4 deficiency sensitizes HeLa cells to ferroptosis induced by the direct GPX4 inhibition.
To further verify that it is not cell-dependent behavior, mNCOA4 was overexpressed in human hepatocellular carcinoma HA22T/VGH cell line and the cells treated with various concentrations of erastin and RSL3 for 24 h. We observed the same tendency in HA22T/VGH cells (Fig. S7a-c), where mNCOA4 expression sensitized cells for erastin-induced cell death (Fig. S7b), while making them more resistant to RSL3 treatment compared to control cells (Fig. S7c), excluding the influence of genetic background of HeLa cell line on observed results.
To verify that the loss of cell viability was due to ferroptosis in our cell clones we analyzed lipid peroxidation levels, the rescue by a fer-roptosis inhibitor and possible involvement of other cell death type by evaluating the effect of necroptosis or apoptosis inhibitors and the activation of caspase-3.
Fig. 2. Erastin- and RSL3-induced cell death in control HeLa cells, with knocked-out NCOA4 and mNCOA4 overexpression. Control HeLa cells, NCOA4 KO B3 and mNCOA4 cells were treated with 0–1–2.5-5-7.5 μM erastin (a) or RSL3 (b) for 8–24-48 h and cell viability was measured by MTT assay. Points and error bars on the curve represent mean values and standard deviation, respectively.
Lipid peroxidation is a hallmark of ferroptosis that can be detected by the specific probe C11-BODIPY581/591 that shifts its fluorescence from red to green upon peroxidation [32]. The control HeLa cells and the clones NCOA4 KO and mNCOA4 were treated for 24 h with sublethal concentration of erastin (1 μM) and of RSL3 (0.5 μM), then stained with
C11-BODIPY and analyzed for its fluorescence. Nuclei were stained with DAPI. The intensity of red fluorescence of C11-BODIPY was comparable in the cytoplasm of all cells, indicating that the probe was evenly taken up by the cells, in the presence or the absence of erastin or RSL3. More importantly, the green fluorescence of the oxidized probe was low in the untreated cells and increased after erastin and RSL3 treatments (Fig. 4a- b). In details, the level of lipid peroxides increased in control HeLa cells of about 1.8 and 1.5 fold after erastin and RSL3 treatments, respectively, even if it is not statistically significant (Fig. 4b). In the NCOA4 KO B3 cells, both ferroptosis inducers caused a statistically significant 2-fold increase of lipid peroxides, whereas in mNCOA4 clone the erastin treatment caused a 1.5 fold and RSL3 a 2 fold increment of lipid per-oxides, compared to untreated cells, both statistically significant (Fig. 4a-b).
To verify that the cell death in our clones was caused by ferroptosis, ferrostatin-1 was also used, a specific inhibitor of ferroptosis acting as a lipid peroxide scavenger that is often used to verify if the loss of cell viability is due to ferroptosis and not to other processes [2]. The cells were treated with 7.5 μM erastin or 5 μM RSL3 (treatments that cause a
loss of cell viability of 70–80% in all the clones), together with 10 μM
ferrostatin-1 and the viability was analyzed after 24 h (Fig. 5). Ferrostatin-1 alone did not affect cell viability (with no differences among the clones), erastin reduced it to 10–25% and the addition of ferrostatin-1 increased it to 55–60% in the three cell lines (Fig. 5a). Similarly, with RSL3, the addition of ferrostatin-1 increased the viability from 15 to 30% to 40–55% (Fig. 5b), even if with a rescue lower than that of erastin. Although ferrostatin-1 did not fully rescue the cell viability in the presence of erastin and RSL3, probably due to the high concentration of ferroptosis inducers, the increase in viability was sig-nificant in all three cell lines.
Next, the cells were examined for the possible co-ocurrence of the necroptotic cell death using a necroptosis inhibitor, necrosulfonamide. The three cell lines were treated as before in the presence of 5 μM
necrosulfonamide and the cell viability was analyzed after 24 h. We did not observe significant changes in the viability of any cell line compared to the cells treated with the inducers alone (Fig. S8a-b), excluding involvement of necroptosis in the observed cell death. To verify if apoptosis contributed to the reduction of viability, the cells were co- treated with ferroptosis inducers and 10 μM Z-VAD-FMK, an apoptosis
inhibitor, for 24 h. The viability of the cells after co-treatment was comparable to that after single treatments with erastin (Fig. S9a) or RSL3 (Fig. S9b). Next, the cleavage of caspase-3 was analyzed in all clones after treatment with sublethal doses of inducers (1 μM erastin and
0.5 μM RSL3) for 24 h, same conditions that induced notable lipid
peroxidation. The cleaved peptides were not observed in any cell line
and after any treatment (Fig. S9c).
Altogether, the increase of lipid ROS, the rescue by the ferrostatin-1, the lack of effect by necrosulfonamide or Z-VAD-FMK and the absence of caspase-3 activation confirmed that the loss of viability induced by erastin and RSL3 was due to the ferroptosis process.
To further confirm ferroptosis as an iron-dependent cell death, we analyzed the impact of iron supplementation on the cell viability after co-treatment with ferroptosis inducers. The cells were treated with 5 μM
erastin or 5 μM RSL3 in the presence of 500 μM FAC for 24 h. The iron
treatment alone did not affect the cell viability in all cell lines which was comparable to the not-treated ones (Fig. 6a-b). However, iron potenti-ated the effect of both ferroptosis inducers decreasing the cell viability from 23 to 58% after erastin treatment to 12–20% (Fig. 6a) and from 12 to 34% after RSL3 to 11–21% (Fig. 6b). The minor effect observed in NCOA4 KO B3 cell line after RSL3 and iron co-treatment (Fig. 6b) was due to the significant reduction of cell viability induced by RSL3 alone, since this cell line is the most sensitive one for RSL3 treatment. These results confirmed the involvement of iron in ferroptosis, promoting cell death in all analyzed HeLa cell lines.
3.4. Ferritin is differently modulated by erastin and RSL3
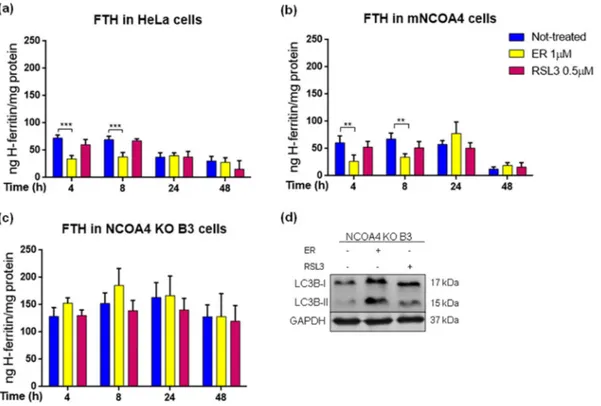
Ferritin is the target of NCOA4 for autophagic degradation and is a master regulator of the cellular iron necessary for ferroptosis. Recent studies demonstrated that FTH depletion promotes ferroptosis in mice [33] and Drosophila [34]. The cellular studies, focused on erastin- induced ferroptosis, have shown that erastin decreases ferritin level [21]. Thus, we asked if ferritin level was affected by the ferroptosis in-ducers in our cell lines and if it is due to the ferritinophagy, what could be verified taking advantage of the NCOA4 KO clone. The cells were treated with sublethal concentrations of erastin (1 μM) or RSL3 (0.5 μM)
for 4, 8, 24 and 48 h, and FTH was quantified by a specific ELISA assay (Fig. 7). The basal ferritin level was higher in NCOA4 KO B3 clone than in control and mNCOA4 cells, as expected. Erastin induced a transient reduction of FTH in both control and mNCOA4 cells at 4 and 8 h (of about 50%), and then ferritin remained at the level comparable to un-treated ones (Fig. 7a-b), in contrast erastin did not affect ferritin level in NCOA4 KO cells at any time (Fig. 7c) supporting the idea that erastin promotes the ferritin degradation in a NCOA4-dependent manner. RSL3 did not induce any significant modification in FTH content in any clone and at any time, probably due to the unaffected ferritinophagy rather than compensatory effect of ferritin synthesis, supported by the constant ferritin level in NCOA4-depleted cells.
Many ferroptosis inducers were found to increase autophagy and to impair lysosomal functionality that may contribute to the cell death [35]. Since both compounds used in the study showed to increase overall level of autophagy [20,22,36–38], we verified if the NCOA4 knocking- out could affect autophagy during ferroptosis pathway. The cells were treated as above for 8 h and analyzed for the level of LC3B protein, a member of LC3 family (microtubule-associated protein 1 light chain 3, Fig. 3. Sorafenib- and ML162-induced cell death in control HeLa cells, with knocked-out NCOA4 and mNCOA4 overexpression. Control HeLa cells, NCOA4 KO B3 and mNCOA4 cells were treated with 0–1–2.5-5-7.5–10-15 μM sorafenib for 48 h (a) or 0–1–2.5-5-7.5 μM ML162 (b) 8 h and cell viability was measured by MTT assay. Points and error bars on the curve represent mean values and standard deviation, respectively.
known also as MAP1LC3), involved in autophagy, which is required for the recruitment of cargo-receptor complex, expansion of autophago-some membrane and fusion with lysoautophago-some [39]. The activation of autophagy can be monitored by the conversion of LC3B (LC3B-I) to its lipidated form (LC3B-II). An increased expression of LC3B-II was observed after both erastin and RSL3 treatments in NCOA4 KO B3 cell line (Fig. 7d), confirming that the ferroptosis inducers had no effect on ferritin level in the NCOA4-depleted cells due to the impaired ferriti-nophagy, whereas autophagy was functional and stimulated by the two
compounds. The data suggest that erastin stimulates ferritin degradation probably by enhanced ferritinophagy, directly or by other indirect mechanisms not yet understood, while RSL3 does not affect ferritin degradation.
To study the effects of erastin and RSL3 on ferritin, the HeLa cells were transiently transfected with a plasmid expressing FTH fused at the N-terminus with a FLAG-tag that does not interfere with ferritin as-sembly and is accessible on protein outer surface [40]. The cells were treated with sublethal concentrations of the ferroptosis inducers and Fig. 4. Formation of lipid ROS after erastin and RSL3 treatment in control HeLa cells, with knocked-out NCOA4 and mNCOA4 overexpression. (a) Control HeLa cells, NCOA4 KO B3 and mNCOA4 cells were treated with 1 μM erastin or 0.5 μM RSL3 for 24 h and formation of lipid ROS was monitored using C11-BODIPY581/591 probe in fluorescent microscope. Nuclei were stained with DAPI dye. Images were taken with 63× magnification (with immersion) using different filters. (b) Quantification of lipid peroxidation with the green fluorescence normalized to DAPI was processed using ImageJ software. Bars and error bars represent mean values and standard deviation, respectively.
Fig. 5. Cell viability rescue with ferrostatin-1 in control HeLa cells, with knocked-out NCOA4 and mNCOA4 overexpression. HeLa cells, NCOA4 KO B3 and mNCOA4 cells were treated with 7.5 μM erastin (ER) (a) or 5 μM RSL3 (b) with or without 10 μM ferrostatin-1 (Fer-1) for 24 h and cell viability was measured by MTT assay. Bars and error bars represent mean values and standard deviation, respectively.
Fig. 6. Effect of co-treatment with ferroptosis inducers and iron on cell viability in HeLa cell lines. HeLa cells, NCOA4 KO B3 and mNCOA4 cells were treated with 5 μM erastin (ER) (a) or 5 μM RSL3 (b) with or without 500 μM FAC for 24 h and cell viability was measured by MTT assay. Bars and error bars represent mean values and standard deviation, respectively.
Fig. 7. Ferritin level in control HeLa cells, with knocked-out NCOA4 and mNCOA4 overexpression during erastin- and RSL3-induced ferroptosis. (a-c) Control HeLa cells (a), NCOA4 KO B3 (b) and mNCOA4 (c) cells were treated with 1 μM erastin (ER) or 0.5 μM RSL3 for 4-8-24-48 h and FTH was quantified by ELISA assay. Bars and error bars represent mean values and standard deviation, respectively. (d) Lysates from NCOA4 KO B3 cells treated with 1 μM ER or 0.5 μM RSL3 for 8 h were immunoblotted for LC3B (I and II) and GAPDH as a loading control.
after 8 h analyzed in immunocytochemistry for Ferritin-FLAG and LC3B. In untreated cells the green puncta of the FTH-FLAG and the red puncta of LC3B showed a cytosolic distribution with only partial co-localization (Fig. 8). Upon erastin treatment, the red puncta of LC3B showed grouped perinuclear distribution suggesting localization in closed autophago-some or lysoautophago-somes [41] with increased co-localization with the green puncta of FTH. A co-localization of LC3B and ferritin after the RSL3 treatment was comparable to the control with an even cytosolic distri-bution. HeLa cells transfected with a pcDNA3.1 plasmid and subjected to the same treatments were used as a control and confirmed cellular dis-tribution of LC3B upon treatments (Fig. S10).
Collectively, these findings suggest that erastin induces ferritinoph-agy, whereas RSL3 has no effect on the ferritin degradation.
4. Discussion
Nuclear receptor coactivator 4 (NCOA4) was identified as cargo- receptor targeting ferritin for autophagic degradation, named ferriti-nophagy, a pathway regulated by cellular iron level [12,13]. We generated two NCOA4 KO clones and one NCOA4 overexpressing clone in HeLa cells, which were initially characterized in term of impact of its absence or overexpression on iron availability and ferritinophagy and then for the role of NCOA4 in ferroptosis process. Our results confirmed that HeLa clones had the expected phenotype: ferritinophagy was abolished in NCOA4-depleted cell lines causing elevated basal ferritin- iron and protein level and ferritin degradation was increased in NCOA4-overexpressing cells with slightly decreased basal ferritin-iron and protein level and significantly higher LIP. This phenotype is in the agreement with the regulation of ferritin expression at protein level by NCOA4 [14] as well as at post-transcriptional level by IRP/IRE system [42]. The second one may explain the higher TfR1 and, as a
consequence, LIP levels during iron deficiency-like conditions in HeLa NCOA4 KO clones as observed an increased IRP2 level in NCOA4- deficient pancreatic adenocarcinoma cells due to the ferritin abun-dance [13].
Ferroptosis is a form of regulated cell death that requires redox- active iron for the lipid peroxides formation [6]. Thus, various pro-teins of iron metabolism have been implicated in this process [43] and they include transferrin [44], TfR1 [21,45–47] and ferroportin (FPN) [47,48], and heme oxygenase 1 (HO-1) [49,50]. Taking into consider-ation that ferroptosis requires reactive free iron pool for lipid ROS production and for iron-enzymes, ferritin is considered as the key fer-roptosis suppressor among iron-related proteins. In fact, its over-expression protected from erastin-induced ferroptosis the frataxin- knockdown human fibrosarcoma cells [51]. The protective role of ferritin was also confirmed by the conditional Fth-knockout in mouse cardiomyocytes, which demonstrated susceptibility to ferroptosis when mice were fed with a high-iron diet [33]. Likewise the knocking-down of FTH in Drosophila promoted ferroptosis causing growth defects in larval discs and adults wings [34]. Furthermore, erastin was found to decrease FTH level in mouse fibroblastic cells, and this correlated with the in-crease of intracellular iron level [21], that could be due to the ferriti-nophagy. NCOA4 is a master regulator of ferritin levels, hence of the cytosolic labile iron pool [14], involved in ferroptosis. Recent studies demonstrated that NCOA4-mediated ferritinophagy promotes erastin- induced ferroptosis by maintaining high intracellular iron content and increased ROS generation, whereas NCOA4 knocking-down counteracts the cell death and accumulation of lipid ROS [20,22]. Our studies confirmed these findings showing higher resistance of NCOA4 KO cells to erastin-induced cell death. We also observed a ferritin decrease in the first 8 h of the erastin treatment in the control and NCOA4 over-expressing cells, consistent with the published data that erastin induces Fig. 8. Co-localization of ferritin and LC3B in HeLa cells expressing FTH-FLAG after erastin and RSL3 treatment. HeLa cells transfected with pcDNA3.1/FTH-FLAG were treated with 1 μM erastin or 0.5 μM RSL3 for 8 h. Immunostaining of cells was performed for FLAG-tag to detect FTH and for endogenous LC3B, nuclei were stained using DAPI dye. Images were taken with 63× magnification (with immersion) by fluorescent microscope using different filters.
autophagy [20] and the generation of ROS in cytosol [46]. This suggests that erastin-induced ferritin degradation contributes to ferroptosis, whereas high level of cytosolic ferritin and impaired ferritinophagy due to the NCOA4 suppression, prevent ROS production and cell death. We observed that cell death caused by erastin treatment was delayed with respect to that caused by RSL3, suggesting that the reduction of gluta-thione and of GPX4 activity caused by the block of the cystine uptake requires long time. Possibly the utilization of the remaining intracellular pool of glutathione and the transsulfuration pathway as an alternative source of cysteine for glutathione synthesis [52] may contribute to the slow induction of ferroptosis by erastin. In fact, RSL3 that inactivates directly GPX4, is more potent and faster than erastin with a significant decrease in HeLa cell viability already after 8 h of the treatment.
An unexpected result was that NCOA4 KO cells were more sensitive to RSL3-induced cell death than controls, and that NCOA4 over-expression made them more resistant. We observed significantly lower cell viability of NCOA4 KO than control cells at all time points and at all RSL3 doses tested, while cells expressing NCOA4 showed a higher sur-vival rate in the first hours of the RSL3 treatment, and then after 48 h of RSL3 treatment the cell death was comparable to that of control HeLa cells. Thus, NCOA4 expression seems to protect cells from RSL3-induced ferroptosis, mainly in the first period of incubation, while it is detri-mental in the erastin-induced ferroptosis. It is consistent with the pub-lished data where head and neck cancer cells sensitivity for RSL3 was
increased after NCOA4 silencing [37].
However the interpretation of these data is rather complex, as they suggest that RSL3 may request less cytosolic iron or less ferritinophagy, while erastin more of both. A possibility is that iron might interfere with the alkylation of GPX4 by RSL3 that causes the inactivation of the enzyme. However, our experiment with iron co-treatment demonstrated that iron potentiates the effect of RSL3. Recently it was shown that knockdown of FTH and mitochondrial ferritin sensitized human mac-rophages and fibrosarcoma cells for RSL3-induced ferroptosis, demon-strating that ferritin protects cells also from ferroptotic cell death induced by GPX4 inhibition [53]. Even if it is partially in disagreement with our results where cells with higher ferritin level (NCOA4 KO cell line) are more sensitive for RSL3-induced ferroptosis, it may suggest that the observed effect in our cell clones may be due to the other mechanism unrelated to ferritin level. Since NCOA4 plays a role in several biological processes, the NCOA4 knocking-out abolished not only ferritinophagy but also other NCOA4 functions. Thus we cannot exclude the direct involvement of NCOA4 in ferroptosis, independently of ferritinophagy. Therefore, we hypothesize that NCOA4 can act as both, positive and negative regulator of ferroptosis, promoting erastin-induced one through ferritinophagy and delaying RSL3-induced one, possibly unre-lated to the ferritin degradation, however it requires further studies.
Iron contributes to all phases of tumor development, and the tumor cells are characterized by the so-called “iron addiction” since they
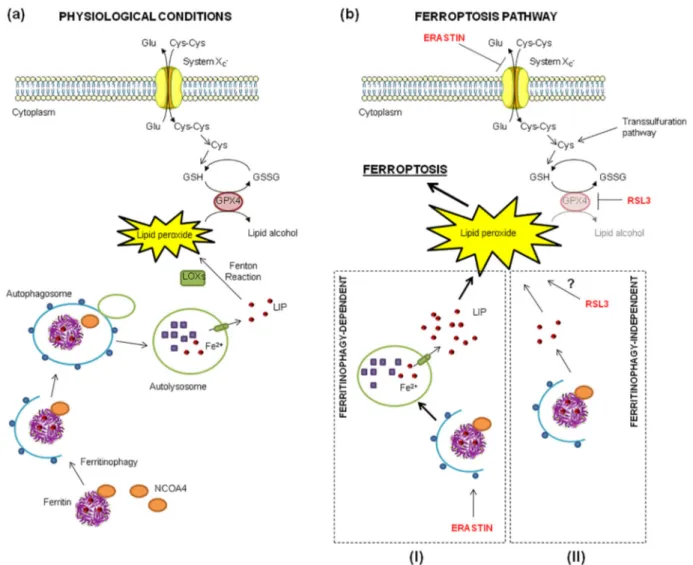
Fig. 9. Ferritinophagy in erastin- versus RSL3-induced ferroptosis. (a) Crosstalk between ferritinophagy and lipid ROS detoxification pathways. (b) Ferritinophagy level is elevated after erastin treatment and promotes erastin-induced ferroptosis (I), whereas RSL3 does not alter ferritinophagy level and does not involve it for ferroptosis inititation (II). The figure was adapted using a template on the servier medical art website (available online: www.servier.com) licensed under the creative commons attribution 3.0 unported license (available online: http://creativecommons.org/license/by/3.0/), the ferritin structure was generated using PyMol.
require enhanced iron uptake and storage to support proliferation [54]. Some studies showed that NCOA4 expression was altered in different types of cancer, such as breast, ovarian and colorectal cancers [55,56]. However, there is no direct correlation between NCOA4 expression level and cancer occurrence or prognostic value, which seem to be dependent on the tumor type and stage [57]. Thus, NCOA4 levels should be care-fully evaluated for each tumor type and compound inducing ferroptosis.
In conclusion, here we demonstrated evident differences in the mechanism of ferroptosis induction between erastin and RSL3 in connection with NCOA4-dependent ferritinophagy, in particular that active ferritinophagy promotes erastin-induced ferroptosis, but not the RSL3-induced one (Fig. 9).
Author contributions
M.G. performed most of the experiments and contributed to the preparation of manuscript; M.A. and A.D. supported M.G. in the ex-periments; P.A. supported M.P. in the preparation of the manuscript; M. P. designed the study, analyzed the data and wrote the paper. Declaration of competing interest
All the co-authors of the manuscript entitled “NCOA4-mediated ferritinophagy promotes ferroptosis induced by erastin, but not by RSL3 in HeLa cells” have no relevant interests to disclose.
Acknowledgments
We thank Prof. Francesca Carlomagno (Universit`a degli Studi di Napoli Federico II, Italy) for kindly providing us anti-NCOA4 antibody and Prof. Fulvio Ursini (University of Padova, Italy) for analyzing GPX4 activity.
This work was supported by the University of Brescia (ex 60%) research funds to M.P. M.G. was supported by Associazione Garda Vita with “Roberto Tosoni Fellowship 2018-2019” and Fondazione Umberto Veronesi with “Post-Doctoral Fellowship 2020”. M.A. was supported by Associazione Italiana per la Ricerca sul Cancro, AIRC Fellowship, for Italy (two-year fellowship “Loredana Guarandi Sabotti” rif.22482). Appendix A. Supplementary data
Supplementary data to this article can be found online at https://doi. org/10.1016/j.bbamcr.2020.118913.
References
[1] R.R. Crichton, S. Wilmet, R. Legssyer, R.J. Ward, Molecular and cellular mechanisms of iron homeostasis and toxicity in mammalian cells, J. Inorg. Biochem. 91 (1) (2002) 9–18. 12121757.
[2] Dixon SJ, Lemberg KM, Lamprecht MR, Skouta R, Zaitsev EM, Gleason CE, et al. Ferroptosis: an iron-dependent form of nonapoptotic cell death. Cell. 2012;149(5): 1060–72. doi: https://doi.org/10.1016/j.cell.2012.03.042. PubMed PMID: 22632970; PubMed Central PMCID: PMCPMC3367386.
[3] Xie Y, Hou W, Song X, Yu Y, Huang J, Sun X, et al. Ferroptosis: process and function. Cell Death Differ. 2016;23(3):369–79. Epub 2016/01/22. doi: https://d oi.org/10.1038/cdd.2015.158. PubMed PMID: 26794443; PubMed Central PMCID: PMCPMC5072448.
[4] TM Seibt, B Proneth, M Conrad, Role of GPX4 in ferroptosis and its pharmacological implication, Free Radic Biol Med. 133 (2019) 144–152. Epub 2018/09/13, https://doi.org/10.1016/j.freeradbiomed.2018.09.014, 30219704. [5] JPF Angeli, R Shah, DA Pratt, M Conrad, Ferroptosis Inhibition: Mechanisms and
Opportunities, Trends Pharmacol Sci. 38 (5) (2017) 489–498. Epub 2017/03/28,
https://doi.org/10.1016/j.tips.2017.02.005, 28363764.
[6] Feng H, Stockwell BR. Unsolved mysteries: How does lipid peroxidation cause ferroptosis? PLoS Biol. 2018;16(5):e2006203. Epub 2018/05/24. doi: https://doi. org/10.1371/journal.pbio.2006203. PubMed PMID: 29795546; PubMed Central PMCID: PMCPMC5991413.
[7] W.S. Yang, R. SriRamaratnam, M.E. Welsch, K. Shimada, R. Skouta, V. S. Viswanathan, et al., Regulation of ferroptotic cancer cell death by GPX4, Cell. 156 (1–2) (2014) 317–331, https://doi.org/10.1016/j.cell.2013.12.010. PubMed PMID: 24439385; PubMed Central PMCID: PMCPMC4076414.
[8] Friedmann Angeli JP, Schneider M, Proneth B, Tyurina YY, Tyurin VA, Hammond VJ, et al. Inactivation of the ferroptosis regulator Gpx4 triggers acute renal failure in mice. Nat Cell Biol. 2014;16(12):1180–91. Epub 2014/11/17. doi: https://doi. org/10.1038/ncb3064. PubMed PMID: 25402683; PubMed Central PMCID: PMCPMC4894846.
[9] B.R. Stockwell, J.P. Friedmann Angeli, H. Bayir, A.I. Bush, M. Conrad, S.J. Dixon, et al., Ferroptosis: a regulated cell death nexus linking metabolism, redox biology, and disease, Cell. 171 (2) (2017) 273–285, https://doi.org/10.1016/j. cell.2017.09.021 (PubMed PMID: 28985560; PubMed Central PMCID: PMCPMC5685180).
[10] A.M. Vuˇckovi´c, V. Bosello Travain, L. Bordin, G. Cozza, G. Miotto, M. Rossetto, et al., Inactivation of the glutathione peroxidase GPx4 by the ferroptosis-inducing molecule RSL3 requires the adaptor protein 14-3-3ε, FEBS Lett. (2019) https://doi. org/10.1002/1873-3468.13631. Epub 2019/10/03, 31581313.
[11] P. Arosio, L. Elia, M. Poli, Ferritin, cellular iron storage and regulation, IUBMB Life (2017), https://doi.org/10.1002/iub.1621. Epub 2017/03/30, 28349628. [12] W.E. Dowdle, B. Nyfeler, J. Nagel, R.A. Elling, S. Liu, E. Triantafellow, et al.,
Selective VPS34 inhibitor blocks autophagy and uncovers a role for NCOA4 in ferritin degradation and iron homeostasis in vivo, Nat. Cell Biol. 16 (11) (2014) 1069–1079, https://doi.org/10.1038/ncb3053. 25327288.
[13] J.D. Mancias, X. Wang, S.P. Gygi, J.W. Harper, A.C. Kimmelman, Quantitative proteomics identifies NCOA4 as the cargo receptor mediating ferritinophagy, Nature. 509 (7498) (2014) 105–109, https://doi.org/10.1038/nature13148
(PubMed PMID: 24695223; PubMed Central PMCID: PMCPMC4180099). [14] J.D. Mancias, L. Pontano Vaites, S. Nissim, D.E. Biancur, A.J. Kim, X. Wang, et al.,
Ferritinophagy via NCOA4 is required for erythropoiesis and is regulated by iron dependent HERC2-mediated proteolysis, Elife. 4 (2015), https://doi.org/10.7554/ eLife.10308 (PubMed PMID: 26436293; PubMed Central PMCID:
PMCPMC4592949).
[15] R Bellelli, G Federico, A Matte, D Colecchia, A Iolascon, M Chiariello, et al., NCOA4 Deficiency Impairs Systemic Iron Homeostasis, Cell Rep. 14 (3) (2016) 411–421. Epub 2016/01/19, https://doi.org/10.1016/j.celrep.2015.12.065, 26776506. [16] M.S. Ryu, K.A. Duck, C.C. Philpott, Ferritin iron regulators, PCBP1 and NCOA4,
respond to cellular iron status in developing red cells, Blood Cells Mol Dis. 69 (2018) 75–81. Epub 2017/09/28, https://doi.org/10.1016/j.bcmd.2017.09.009
(PubMed PMID: 29032941; PubMed Central PMCID: PMCPMC5783766). [17] N. Santana-Codina, S. Gableske, M.Q.D. Rey, B. Małachowska, M.P. Jedrychowski,
D.E. Biancur, et al., NCOA4 maintains murine erythropoiesis via cell autonomous and non-autonomous mechanisms, Haematologica. 104 (7) (2019) 1342–1354. Epub 2019/01/10, https://doi.org/10.3324/haematol.2018.204123 (PubMed PMID: 30630985; PubMed Central PMCID: PMCPMC6601094).
[18] A. Kollara, M.J. Ringuette, T.J. Brown, Dynamic distribution of nuclear coactivator 4 during mitosis: association with mitotic apparatus and midbodies, PLoS One. 6 (7) (2011), https://doi.org/10.1371/journal.pone.0022257 e22257. Epub 2011/ 07/26. (PubMed PMID: 21814571; PubMed Central PMCID: PMCPMC3144208). [19] R Bellelli, MD Castellone, T Guida, R Limongello, NA Dathan, F Merolla, et al.,
NCOA4 transcriptional coactivator inhibits activation of DNA replication origins, Mol Cell. 55 (1) (2014) 123–137. Epub 2014/06/10, https://doi.org/10.1016/j. molcel.2014.04.031, 24910095.
[20] M. Gao, P. Monian, Q. Pan, W. Zhang, J. Xiang, X. Jiang, Ferroptosis is an autophagic cell death process, Cell Res. 26 (9) (2016) 1021–1032. Epub 2016/08/ 16, https://doi.org/10.1038/cr.2016.95 (PubMed PMID: 27514700; PubMed Central PMCID: PMCPMC5034113).
[21] E. Park, S.W. Chung, ROS-mediated autophagy increases intracellular iron levels and ferroptosis by ferritin and transferrin receptor regulation, Cell Death Dis. 10 (11) (2019), https://doi.org/10.1038/s41419-019-2064-5, 822. Epub 2019/10/ 28. (PubMed PMID: 31659150; PubMed Central PMCID: PMCPMC6817894). [22] W. Hou, Y. Xie, X. Song, X. Sun, M.T. Lotze, H.J. Zeh 3rd, et al., Autophagy
promotes ferroptosis by degradation of ferritin, Autophagy. 12 (8) (2016) 1425–1428. Epub 2016/06/02, https://doi.org/10.1080/15548627.2016.11 87366 (PubMed PMID: 27245739; PubMed Central PMCID: PMCPMC4968231). [23] R. Agoro, S. Benmerzoug, S. Rose, M. Bouyer, R. Gozzelino, I. Garcia, et al., An Iron-rich diet decreases the mycobacterial burden and correlates with Hepcidin upregulation, lower levels of Proinflammatory mediators, and increased T-cell recruitment in a model of Mycobacterium bovis Bacille Calmette-Guerin infection, J. Infect. Dis. 216 (7) (2017) 907–918, https://doi.org/10.1093/infdis/jix366.
28973651.
[24] A. Roveri, M. Maiorino, C. Nisii, F. Ursini, Purification and characterization of phospholipid hydroperoxide glutathione peroxidase from rat testis mitochondrial membranes, Biochim. Biophys. Acta 1208 (2) (1994) 211–221, https://doi.org/ 10.1016/0167-4838(94)90106-6. 7524677.
[25] M. Gryzik, A. Srivastava, G. Longhi, M. Bertuzzi, A. Gianoncelli, F. Carmona, et al., Expression and characterization of the ferritin binding domain of Nuclear Receptor Coactivator-4 (NCOA4), Biochim Biophys Acta Gen Subj. 1861 (11 Pt A) (2017) 2710–2716. Epub 2017/07/25, https://doi.org/10.1016/j.bbagen.2017.07.015
(PubMed PMID: 28754384).
[26] K. Bersuker, J.M. Hendricks, Z. Li, L. Magtanong, B. Ford, P.H. Tang, et al., The CoQ oxidoreductase FSP1 acts parallel to GPX4 to inhibit ferroptosis, Nature. 575 (7784) (2019) 688–692. Epub 2019/10/21, https://doi.org/10.1038/s41586-0 19-1705-2 (PubMed PMID: 31634900; PubMed Central PMCID:
PMCPMC6883167).
[27] S Doll, FP Freitas, R Shah, M Aldrovandi, MC da Silva, I Ingold, et al., FSP1 is a glutathione-independent ferroptosis suppressor, Nature. 575 (7784) (2019) 693–698. Epub 2019/10/21, https://doi.org/10.1038/s41586-019-1707-0, 3163 4899.