Università degli Studi di Salerno
17
Abstract - The purpose of this study was to
identify the independent components of physical
frailty that most influence disability indicators in
institutionalized older women. A cross-sectional
study with 319 participants (81.967.89 years old)
was performed. Disability was assessed through
dynamic and static balance tests, activities of daily
life and falls risk screen. Fried physical frailty
protocol was used to access physical frailty. The frail
subgroup displayed the weakest results for all
disability indicators (p < 0.05). Regression analysis
showed that in the two models tested, low physical
activity levels and slowness were the physical frailty
independent components that better associated with
the disability indicators. More studies with larger
samples will help to better understand the
independent relationship of each physical frailty
component with disability outcomes and assist to
design a co-adjuvant treatment to reverse physical
frailty.
Keywords: Frail older adults, falls, disability evaluation, activities of daily living, motor skills.
I. INTRODUCTION
The Frailty Syndrome is a state in which reserve function across multiple physiologic domains decline, compromising the individuals’ capacity to withstand stress. This situation predisposes them to poor general health, functional decline, institutionalization and death [1], [2]. Fried et al.[3] developed a protocol to identify Physical Frailty (PF) that evaluated five components: weakness (low grip strength), low resistance to effort
(exhaustion), slowness (poor gait speed), low physical activity levels, and (non-intentional) weight loss, and categorized the population in frail, pre-frail and non-frail subjects [3].
Recent findings suggest that PF is strongly linked to different Functional Disability (FD) indicators, leading to increased caregiver burden, and greater financial costs for public health[4]–[6]. Currently, FD is understood as a multidimensional construct that integrates the analysis of compensation strategies to maintain a satisfactory physical health and perform daily life activities autonomously[7]. The assessment of FD can be quantified directly (through simple and low cost functional fitness and motor tasks tests) or indirectly (through questionnaires evaluating specific daily life tasks), both clinically validated [8], [9]. Positive changes in FD affect quality of life and perception of a positive physical condition (e.g. not being afraid to face possible physical barriers that condition the fear of falling) might reflect a personal sense of predicted support from others, despite being physically frail.
Currently, there is poor information about the contribution of each PF independent component on physical-functional decline [10]. Epidemiological studies reported that poor scores on the handgrip strength test were associated with high risk of mortality [11], dementia, and mild cognitive impairment [12]. Low levels of physical activity were consistently associated with mortality [13], cognitive decline [14], poor walking speed proficiency, and low physiological reserve [15]. Geriatric researchers have started to explore the independent association of each PF component with some indicators of FD [6]. However, the relationship between the PF independent components, different FD indicators and their contribution to understand the functional decline of frail institutionalized-dwelling individuals, is still poorly explored. Thus, the aim of this study was to analyze the relationship between the PF independent components and FD indicators and to explore the differences on functional
T
HE ROLE OF PHYSICAL FRAILTY INDEPENDENT COMPONENTS ON INCREASED
DISABILITIES IN INSTITUTIONALIZED OLDER WOMEN
Furtado GE
1, Letieri R
1, Caldo A
1, Patricio M
2, Loureiro M
2, Hogervorst E
3, Ferreira JP
3, Teixeira
AM
1.
1Research Unit of Physical activity and Sport at Faculty of Sport Sciences and Physical Education (CIDAF; UID/PDT/04213/2019) – University of Coimbra, Portugal
2Laboratory of Biostatistics and Medical Informatics and IBILI, Faculty of Medicine of the University of Coimbra 3School of Sport and Exercise Sciences, Loughborough University, United Kingdom
Università degli Studi di Salerno
18
disability between the different physically frail subgroupsin institutionalized-dwelling older women. II. METHODOLOGY
This is a cross-sectional study design that included institutionalized-dwelling older adults over 75 years old. Five centers of health care and social support (CHS) were approached and agreed to participate in this study.
Sample selection criteria
Participant inclusion and exclusion criteria were validated through face-to-face interview. Participants were excluded when severe chronic illnesses (e.g. severe cardiomyopathy, hypertension, uncontrolled asthmatic bronchitis), any musculoskeletal impairments that could prevent performance of the physical tests to assess functional disability, mental disorders (e.g. Alzheimer and Parkinson, severe dementia), severe hearing or vision impairment, morbid obesity, having no controlled and updated drug therapy or the use of medications that could cause attentional impairments and disturb the motor activity (e.g. anxiolytics and anti-depressants) were present.
Participants and sample size statistical power
Initially, 483 institutionalized-dwelling participants were approached to participate in this study. However, 164 women were excluded due to a poor clinical health condition (with high physical and cognitive impairment). A total of 319 older women were finally included in the study. Statistical power was computed by considering the Lawton index values to compare differences between frail and pre-frail groups, using a Mann–Whitney U test, with a significance level of p = 0.01. The analysis was performed on G*power 3.1.9.2; the power was determined to be 0.97 with a sample of 300 and an effect size of 1.12 [16].
Ethical procedures
All the CHS directors and potential subjects who expressed interest in participating in the study signed an informed consent form, in which the privacy and anonymous identity of the data collected were guaranteed, and any needed access to the participants medical records was given. This study protocol was approved by the University of Coimbra Faculty of Sport Sciences and Physical Activity, Ethical Committee (reference code: CE/ FCDEF-UC/000202013) respecting the current guidelines for human research of the Helsinki Declaration [17].
Data collection
Data collection was performed by the principal investigator and by a trained research team constituted by a nurse, physiotherapist and kinesiologist. The following variables were assessed: sociodemographic information, anthropometry, global health status (clinical-mental health status), physical frailty (unintentional weight loss, exhaustion, weakness, slowness, and physical activity level), and functional disability outcomes. To minimize inter-variability between evaluators, only one researcher was responsible to collect data from all participants in this study. The quality data of physical tests (static balance, agility-dynamic balance, hand grip and 15-feet walking tests) was examined in the pilot data collection and internal consistency reliability (ICR) for each test was reported.
Sociodemographic screening
Chronological age was assessed through the date of birth and analyzed as a continuous variable. Marital status was categorized as single, married, widowed or divorced. Level of education, assessed as a continuous variable, was collected for each participant and classified according to the Portuguese educational system [18].
Anthropometric measures
The standardized procedures described by Lohan and colleagues were followed for the collection of anthropometric data [19]. To assess body mass, a portable scale (Seca®, model 770, Germany) with a precision of 0.1 kilograms was used. For stature, a portable stadiometer (Seca Body meter®, model 208, Germany) with a precision of 0.1 centimeters was used. Participants, body mass index (BMI) was calculated according to the standard formula (BMI = body mass/stature2).
Clinical and mental health status
Comorbidity was assessed using the Charlson Comorbidity Index (CCI) that measures the burden of disease and has a weighted index based on 19 comorbid conditions. The score ranging from 0 (low) to 10 points (high) combined with age and gender provides a single index [20]. Individuals presenting a comorbidity index above 10 points were excluded from the study. The Mini-Mental State Examination (MMSE) questionnaire was used to assess cognition; the maximum score is 30 points and a score below 24 is usually considered indicative for dementia screening [21], [22]. Depression was assessed using the scale developed by the Centre of Epidemiologic Studies in Depression (CES-D)[23]. The 20-items scale
Università degli Studi di Salerno
19
has an overall score ranging from 0 to 60 points where thehighest scores correlate with the frequency of depressive symptoms [24].
Physical Frailty screening
The incidence of PF was calculated based on a continuous score ranging from 0 to 5 points of the following five components: unintentional weight loss, exhaustion, weakness, slowness, and physical activity level. Unintentional weight loss was assessed by self-reporting a loss of four kilograms or more in the last six months, validated by medical records over one year. Exhaustion (self-reported weariness) was evaluated by negative concordance of questions number 7 and 20 from the CES-D scale [23]. Weakness was analyzed using the handgrip strength test (HGT). This test uses a hand-held dynamometer (Lafayette Dynamometer, model 78010, United States) and strength is measured in kilograms. The subject holds the dynamometer in the hand to be tested, with the elbow by the side of the body. When ready, the subject squeezes the dynamometer with maximum isometric effort, which is maintained for 5 seconds. The best result of the two trials was used for scoring purposes [25]. Participants who were unable to perform the HGT and those in the lowest 20% (adjusted by gender and BMI) were categorized as positive, based on cut off values of Fried’s study population; Slowness was measured using the 4.6 meters walking test (4.6-WT) which results are expressed in seconds and adjusted for gender and stature. Based on cut off values of Fried’s study population, the best time of the two trials was used for final scoring [15]. Physical activity (PA) levels were assessed by the International Physical Activity Questionnaire (IPAQ) short version [26]. The IPAQ short form asks about three specific types of activity undertaken and time being sedentary. The types of activity assessed were walking, moderate-intensity activities and vigorous intensity activities. Frequency (measured in days per week) and duration (time per day) are collected separately for each specific type of activity. The total volume and the number of day/sessions were included in the IPAQ analysis. There are four levels of PA suggested for classification: inactive, minimally active, medium active and a highly active. Participants classified as inactive and minimally active had a positive score for the frailty status [27].
According to this five components, participants were categorized as pre-fail (scored positively in one or two PF components), frail (scored positively in three or more components), and non-frail (scored negatively in all five frailty independent components) [3].
Functional disability indicators
The assessment of FD was organized in a protocol proposed in a previous study [7]. The Katz Index of Independence (ADL) and the Instrumental Lawton Index (IADL) were used to assess autonomy in daily life tasks. The ADL scale ranks adequacy of performance in six tasks (dressing, transferring, toileting, continence, feeding, and bathing). Individuals are scored for each function as independent (1 point) or dependent (0 points) for each task. A score of 6 indicates full function, 4 indicates moderate impairment, and 2 or less indicates severe functional impairment [8], [28]. The Lawton Instrumental Activities of Daily Living (IADL) was used to identify deterioration or improvement over time in 8 socio-biological functions. A summary score ranges from 8 to 32 points, low function (dependent) to high function (independent) [29]. Fear of falling was measured using the Tinetti Falls Efficacy Scale (FES), which individuals are asked to rate, on a 4-point Likert scale, their concerns about the possibility of falling when performing 16 activities. Scores range from 10 to 100 points, with a lower score indicating a high self-efficacy and little fear of falling [30]. The eight foot-up-and go test was used to assess agility-dynamic balance (ADB). The ADB test measures the total time in seconds needed for the participant to get up from the chair, walk the distance of 2.44 meters as quickly as possible around either side of a cone, and to sit back down in the chair (ICR = 0.80). A total time of more than 9 seconds indicates a “risk zone”. [31]. The Tandem Stance Balance test (TSB) was used to evaluate static balance; it consists of the participant maintaining the standing position with eyes opened and one foot in front of the opposite foot for a maximum of 30 seconds, 10 seconds or less indicating very poor static balance (ICR = 0.77). Both TSB and ADB tests were chosen for their easy in application and clinical validity in older populations [32]. Three repetitions of each physical test were performed and the best score was considered.
Statistical analysis
The Shapiro-Wilk test was used to assess normality of continuous variables. Normally distributed continuous data was described by their averages and standard deviations. Non-normally distributed continuous data was described by median and first and third quartiles. As for categorical variables, absolute and relative frequencies were used. Independent samples ANOVA tests and Kruskal-Wallis tests were performed to compare continuous variables between groups and Chi-square tests to assess the association between categorical variables. Spearman's rank correlations and corresponding partial Spearman correlations were used to test the associations between FD outcomes and PF total score. The relationships between the Katz index of ADL and each of PF independent components was evaluated using logistic
Università degli Studi di Salerno
20
regressions. The relationships between PF and all otherdisabilities outcomes were analyzed using linear regressions. The unadjusted model simply included one dependent variable and one independent variable. In model 1, stature, comorbidities, depressive state, and cognitive state were included as covariates. The outcomes of disability were assumed as dependent variables and the PF components were independent in the regression analysis. The magnitude of the associations was classified as follow: trivial (r ˂ 0.1), small (r = 0.1 to 0.3), moderate (r= 0.3 to 0.5), strong (r=0.5 to 0.7), and robust (r= 0.7 to 0.9) [33]. The level of significance adopted was 0.05. All computations were performed on IBM/SPSS Statistics 21 and R version 3.3.1.
III. RESULTS
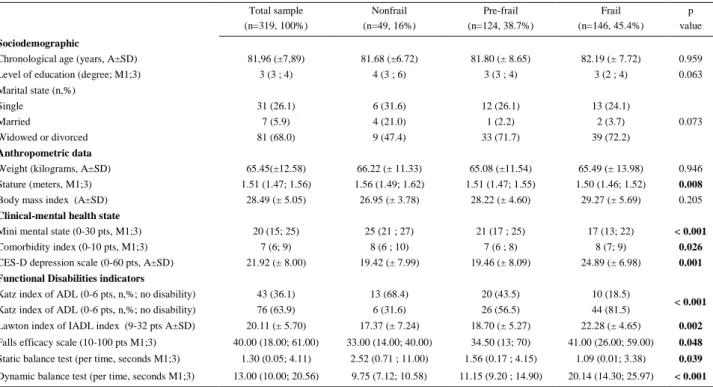
Characterization of the sample is shown in Table 1. Total sample mean age was 81.967.89 years, 68% of the participants were divorced or widowed, and the median level of education was third grade. When analysing the differences between the frailty subgroups, no significant changes were found for sociodemographic and anthropometric variables, except for stature. Mean stature showed that the frailest individuals had a significant shorter stature (p = 0.008). Frail individuals presented a lower score on the cognitive test (p < 0.001), a higher depressed mood (p = 0.026), and a higher comorbidity index (p < 0.001).
Functional disability outcomes showed significant differences for all variables, the frail subgroup being more dependent (Katz index of ADL = p < 0.001 and Lawton index of IADL p = 0.002), having higher fear of falling (p = 0.002), poorer static (p = 0.039) and dynamic balance (p < 0.001) when compared to pre-frail and non-frail subgroups (table 1).
Table 1. Characterization of total sample and comparison of physical frailty subgroups for biosocial, global health and functional disability
outcomes Total sample (n=319, 100%) Nonfrail (n=49, 16%) Pre-frail (n=124, 38.7%) Frail (n=146, 45.4%) p value Sociodemographic
Chronological age (years, A±SD) 81,96 (±7,89) 81.68 (±6.72) 81.80 (± 8.65) 82.19 (± 7.72) 0.959 Level of education (degree; M1;3) 3 (3 ; 4) 4 (3 ; 6) 3 (3 ; 4) 3 (2 ; 4) 0.063 Marital state (n,%)
Single 31 (26.1) 6 (31.6) 12 (26.1) 13 (24.1)
Married 7 (5.9) 4 (21.0) 1 (2.2) 2 (3.7) 0.073
Widowed or divorced 81 (68.0) 9 (47.4) 33 (71.7) 39 (72.2)
Anthropometric data
Weight (kilograms, A±SD) 65.45(±12.58) 66.22 (± 11.33) 65.08 (±11.54) 65.49 (± 13.98) 0.946 Stature (meters, M1;3) 1.51 (1.47; 1.56) 1.56 (1.49; 1.62) 1.51 (1.47; 1.55) 1.50 (1.46; 1.52) 0.008
Body mass index (A±SD) 28.49 (± 5.05) 26.95 (± 3.78) 28.22 (± 4.60) 29.27 (± 5.69) 0.205
Clinical-mental health state
Mini mental state (0-30 pts, M1;3) 20 (15; 25) 25 (21 ; 27) 21 (17 ; 25) 17 (13; 22) < 0.001
Comorbidity index (0-10 pts, M1;3) 7 (6; 9) 8 (6 ; 10) 7 (6 ; 8) 8 (7; 9) 0.026
CES-D depression scale (0-60 pts, A±SD) 21.92 (± 8.00) 19.42 (± 7.99) 19.46 (± 8.09) 24.89 (± 6.98) 0.001 Functional Disabilities indicators
Katz index of ADL (0-6 pts, n,%; no disability) 43 (36.1) 13 (68.4) 20 (43.5) 10 (18.5)
< 0.001
Katz index of ADL (0-6 pts, n,%; no disability) 76 (63.9) 6 (31.6) 26 (56.5) 44 (81.5)
Lawton index of IADL index (9-32 pts A±SD) 20.11 (± 5.70) 17.37 (± 7.24) 18.70 (± 5.27) 22.28 (± 4.65) 0.002
Falls efficacy scale (10-100 pts M1;3) 40.00 (18.00; 61.00) 33.00 (14.00; 40.00) 34.50 (13; 70) 41.00 (26.00; 59.00) 0.048
Static balance test (per time, seconds M1;3) 1.30 (0.05; 4.11) 2.52 (0.71 ; 11.00) 1.56 (0.17 ; 4.15) 1.09 (0.01; 3.38) 0.039
Dynamic balance test (per time, seconds M1;3) 13.00 (10.00; 20.56) 9.75 (7.12; 10.58) 11.15 (9.20 ; 14.90) 20.14 (14.30; 25.97) < 0.001
Università degli Studi di Salerno
21
A moderate-to-strong correlation between the PFcomposed score and all the FD indicators was found (p<0.005). The results of partial correlations controlling for age, education, comorbidities and depression, showed that only the correlation between the Lawton index of IADL and the FES scale disappeared.
Table 2. Characterization of total sample and comparison of physical
frailty subgroups for functional disability outcomes
1 2 3 4 5 1. ADL 2. IADL 0.513** 0.472** 3. FES 0.176 0.436** 0.114 0.329** 4. DBT 0.428** 0.387** 0.321** 0.347** 0.261** 0.231* 5. SBT -0.255** -0.299** -0.253* -0.466** -0.240** -0.261** -0.227* -0.449** 6. PF 0.420** 0.327** 0.247** 0.662** -0.224* 0.303** 0.149 0.140 0.610** -0.194
Notes: *p< 0.05 and **p< 0.010; in each variable line are expressed r and (p) values; partial correlation values are expressed in underline of each variable line and was adjusted for pre-determined covariates; PF =Physical frailty total score; ADL = Katz index; IADL = Lawton index; DBT = Dynamic balance test; SBT= static balance test.
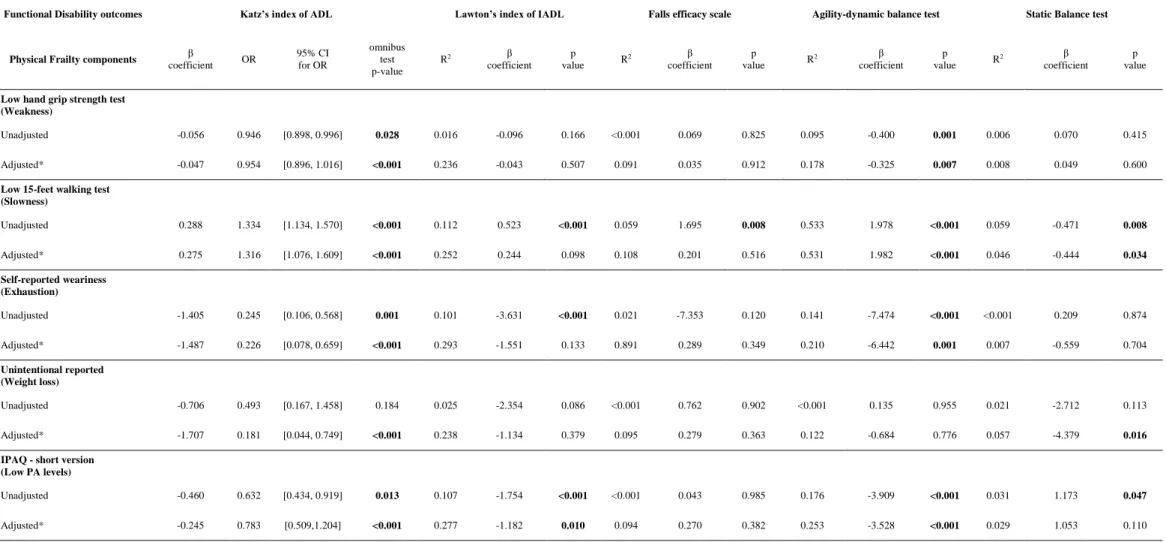
Multivariate regression analyses were performed and the results are presented in table 3. Two models of independent relationships were generated between each disability and frailty independent components. The unadjusted results showed that weakness was significantly associated with Katz of ADL and DBT tests, slowness was associated with all FD outcomes, exhaustion was associated with all FD components (except the STB test) and low PA levels were also associated with all FD outcomes, except for the FES scale. However, all these associations were trivial (r ˂ 0.10).
After adding the adjusted covariates, weakness presented a significant trivial correlation with the Katz of IADL index ( = - 0.047; OR = 0.954; IC95% [0.898, 1.016]; p <0.001) and ADB test (r2 = 0.18; = -0.325; p = 0.007). The PF component of slowness also showed a small correlation with the Katz of ADL index ( = 0.28; OR = 1.316; IC95% [1.076, 1.609]; p <0.001), a moderate association with the ADB test (r2 = 0.53; = 1.982; p <0.001) and a trivial correlation with the TSB test (r2 = 0.05; = -0.444; p = 0.034). Self-reported exhaustion maintained an independent and small significant association with the Lawton of IADL index (r2 = 0.53; = 1.982; p <0.001) and a significant but small association with the ADB test (r2 = 0.21; = -6.642; p = 0.001). The
1.707; OR = 0.181; IC95% [0.044, 0.749]; p < 0.001) and a trivial association with the TSB test (r2 = 0.05; = -4.379; p = 0.016).
Università degli Studi di Salerno
22
Table 3 – Association between each physical frailty and functional disability components (n = 319)
Functional Disability outcomes Katz’s index of ADL Lawton’s index of IADL Falls efficacy scale Agility-dynamic balance test Static Balance test
Physical Frailty components β
coefficient OR 95% CI for OR omnibus test p-value R2 β coefficient p value R 2 β coefficient p value R 2 β coefficient p value R 2 β coefficient p value
Low hand grip strength test (Weakness)
Unadjusted -0.056 0.946 [0.898, 0.996] 0.028 0.016 -0.096 0.166 <0.001 0.069 0.825 0.095 -0.400 0.001 0.006 0.070 0.415
Adjusted* -0.047 0.954 [0.896, 1.016] <0.001 0.236 -0.043 0.507 0.091 0.035 0.912 0.178 -0.325 0.007 0.008 0.049 0.600
Low 15-feet walking test (Slowness) Unadjusted 0.288 1.334 [1.134, 1.570] <0.001 0.112 0.523 <0.001 0.059 1.695 0.008 0.533 1.978 <0.001 0.059 -0.471 0.008 Adjusted* 0.275 1.316 [1.076, 1.609] <0.001 0.252 0.244 0.098 0.108 0.201 0.516 0.531 1.982 <0.001 0.046 -0.444 0.034 Self-reported weariness (Exhaustion) Unadjusted -1.405 0.245 [0.106, 0.568] 0.001 0.101 -3.631 <0.001 0.021 -7.353 0.120 0.141 -7.474 <0.001 <0.001 0.209 0.874 Adjusted* -1.487 0.226 [0.078, 0.659] <0.001 0.293 -1.551 0.133 0.891 0.289 0.349 0.210 -6.442 0.001 0.007 -0.559 0.704 Unintentional reported (Weight loss) Unadjusted -0.706 0.493 [0.167, 1.458] 0.184 0.025 -2.354 0.086 <0.001 0.762 0.902 <0.001 0.135 0.955 0.021 -2.712 0.113 Adjusted* -1.707 0.181 [0.044, 0.749] <0.001 0.238 -1.134 0.379 0.095 0.279 0.363 0.122 -0.684 0.776 0.057 -4.379 0.016 IPAQ - short version
(Low PA levels)
Unadjusted -0.460 0.632 [0.434, 0.919] 0.013 0.107 -1.754 <0.001 <0.001 0.043 0.985 0.176 -3.909 <0.001 0.031 1.173 0.047
Adjusted* -0.245 0.783 [0.509,1.204] <0.001 0.277 -1.182 0.010 0.094 0.270 0.382 0.253 -3.528 <0.001 0.029 1.053 0.110 *Adjusted for age, education level, morbidity index, body mass index and cognitive status (model 1). For each logistic regression and each of the FS components, the corresponding β coefficient, odds-ratio (OR), 95% confidence intervals for the OR and the p-value of the omnibus tests of model coefficients were computed. For each linear regression and each of the frailty components variables, the coefficient of determination of the model (R2), the β coefficient, the corresponding p-value and the p-value for the ANOVA test were computed;
Università degli Studi di Salerno
23
<0.001), a moderate association with the Lawton index ofIADL (r2 = 0.30; = -1.182; p = 0.010) and a small association with the ADB test (r2 = 0.25; = -3.528; p = 0.010). Lastly, residual and analytical analyses did not show violations of the assumptions underlying regression analysis and indicated a satisfactory fit of the model.
IV. DISCUSSION
The aim of the present study was to investigate the relationship between PF and FD outcomes in institutionalized women over 75 years old. We also examined the disability differences between the three frail sub-groups. The main findings were that low levels of PA and slowness were the PF components most associated with FD outcomes, even after adjusting the models. On the other hand, the Katz index of ADL and the ADB test were de FD outcomes most associated with the physical frailty independent components in both regression models. After Linda Fried described the PF Phenotype [3], several studies examined the prevalence of physical frailty in institutionalized samples [34]. Studies performed in Spain [35], [36], North America [37] and Brazil [38] corroborate the findings of the present study with similar prevalences of PF (45.4%), with the frail individuals having the worst FD scores when compared to the other PF subgroups.
The other finding that drew attention was the short stature found in the frail subgroup. According to previous evidence, stunted growth as a developmental delay is a risk factor for later life functional impairments [39], [40]. Stature could be related to osteopenia/osteoporosis leading to loss of height. This fact was independent of age and needs to be further explored. Previous researchers have also found that a high comorbidity index, lower cognition and depressive status also appear to strongly associate with physical frailty [41], [42].
As in the present study, low PA levels have been found to be a PF independent component with a relationship with the Katz of ADL and Lawton of IADL indexes [43]–[45]. The construct of daily life activities includes underlying socio-biological functions that are highly dependent on a satisfactory level of PA [46]. The biological mechanisms remain poorly comprehended, however, the main effects of low PA on functionality could be mediated by reduced muscle strength, and possibly by inflammation and a down-regulated sex steroids hormone expression [47].
Gait speed is the most used motor skill test in studies related to physical performance in older frail populations [48]. Low capacity of walking speed has been found to be an independent component of physical frailty linked with FD outcomes in numerous previous findings [49], [50]. On the other hand, the Katz of ADL Index was the FD outcome most closely related with all the
recognize it as an independent maker of frailty status [51]. Additionally, the results showed that, not the static balance, but the dynamic balance motor skill test had the best relationship with all the independent components of the frailty status. This test has shown satisfactory associations with the PF independent components in previous studies [52], [53]. In addition, recent research has demonstrated that the ADB test is a good predictor of PF; and is used for instance, when the full application or interpretation of Fried’s criteria is impracticable [52], [54], [55]. A critical analysis of the ADB test can help understand the satisfactory associations with PF found in this study since this test requires the integration of different physical capacities such as time reaction, upper body strength and agility [56], [57]. Exploring these associations in institutionalized-dwelling individuals has a particular interest since their risk for age-physical decline was approximately four times higher when compared to community-dwelling individuals.
V. CONCLUSION
Our findings showed that low levels of PA and slowness are the independent components of physical frailty most associated with functional disability outcomes. However, this study has some limitations that should be addressed: this is a cross-sectional study design, associations between the variables may be bidirectional; smaller number of people in the frailty subgroups due to excessive and unexpected number of dropouts
More epidemiological studies are needed, across different sample cohorts of institutionalized-dwelling populations, to determine the real prognostic value of frailty independent components and to help design a co-adjuvant treatment to prevent frailty based on active lifestyle police interventions, aiming to increase levels of PA and at encouraging changes in sedentary behaviors in this population.
ACKNOWLEDGMENT
We would like to thank the all residents and workers from SHSC that accepted to participate in this study. We would also like to thank the students Filipa Pedrosa, Nelba Souza, Fábio Direito, Rafael Carvalho and Taís Rieping that helped with data collection. This study was financed by the Portuguese Foundation for Science and Technology (FCT)- (FCT PTDC/DTP-DES/0154/2012). Guilherme Furtado was financed by a grant from CAPES/CNPQ – Ministry of Education – Brazil, reference BEX: 13642/13-8, respectively.
REFERENCES
[1] Morley JE, Vellas B, van Kan GA, Anker SD, Bauer JM, Bernabei R, Cesari M, Chumlea WC, Doehner
Università degli Studi di Salerno
24
W, Evans J, Fried LP, Guralnik JM, Katz PR, MalmstromTK, McCarter RJ, Gutierrez Robledo LM, Rockwood K, von Haehling S, Vandewoude MF, and Walston J. Frailty consensus: a call to action. Journal of the American Medical Directors Association 2013; 14 (6): 392–7. [2] Clegg A and Trust DM. The frailty syndrome. CME Geriatric medicine 2011; vol. 11, no. 1, pp. 72–75. [3] Fried LP, Tangen CM, Walston J, Newman B, Hirsch C, Gottdiener J, Seeman T, Tracy R, Kop WJ, Burke G and McBurnie M. Frailty in older adults: evidence for a phenotype. The journals of gerontology. Series A, Biological sciences and medical sciences 2001; 56 (3):146-56.
[4] Bergman H, Karunananthan S, Robledo LMG, Brodsky J, Chan P, Cheung M and Bovet P. Understanding and meeting the needs of the older population: a global challenge. Canadian geriatrics journal : CGJ 2013; 16(2): 61–5.
[5] Abizanda P, Romero L, Sánchez-Jurado P M, Martínez-Reig M, Gómez-Arnedo L and Alfonso SA. Frailty and mortality, disability and mobility loss in a Spanish cohort of older adults: the FRADEA study. Maturitas 2013; 74(1):54–60.
[6] Ávila-Funes JA, Pina-Escudero SD, Aguilar-Navarro S, Gutierrez-Robledo LM, Ruiz-Arregui L and Amieva H. Cognitive impairment and low physical activity are the components of frailty more strongly associated with disability. The journal of nutrition, health & aging 2011; 15(8): 683–9.
[7] Tomey KM and Sowers MR. Assessment of Physical Functioning: A Conceptual Model Encompassing Environmental Factors and Individual Compensation Strategies. Physical Therapy 2009; 89(7): 705–714. [8] Buurman BM, van Munster BC, Korevaar JC, de Haan RJ and de Rooij SE. Variability in measuring (instrumental) activities of daily living functioning and functional decline in hospitalized older medical patients: a systematic review. Journal of clinical epidemiology, 2011; 64(6): 619–27.
[9] Bowen ME. The relationship between body weight, frailty, and the disablement process. The journals of gerontology. Series B, Psychological sciences and social sciences 2012; 67(5): 618–26.
[10] Alencar MA, Dias JMD, Figueiredo LC and Dias RC. Frailty and cognitive impairment among community-dwelling elderly. Arquivos de neuro-psiquiatria 2013; 71(6): 362–7.
[11] Sasaki H, Kasagi F, Yamada M and Fujita S. Grip strength predicts cause-specific mortality in middle-aged and elderly persons. The American journal of medicine 2007; 120(4): 337–42.
[12] Alencar MA, Dias JMD, Figueiredo LC and Dias RC. Handgrip strength in elderly with dementia: study of reliability. Revista brasileira de fisioterapia 2012;16(6): 510–4.
[13] Ekelund U, Ward HA, Norat T, Luan J, May A M, Weiderpass E, Sharp SJ, Overvad K, Østergaard JN, Tjønneland A, Johnsen NF, Mesrine S, Fournier A, Fagherazzi G, Trichopoulou A, Lagiou P, Trichopoulos D,
Li K, Kaaks R, Ferrari P, Licaj I, Jenab M, Bergmann M, Boeing H, Palli D, Sieri S, Panico S, Tumino R, Vineis P, Peeters PH, Monnikhof E, Bueno-de-Mesquita HB, Quirós JR, Agudo A, Sánchez MJ, Huerta JM, Ardanaz E, Arriola L, Hedblad B, Wirfält E, Sund M, Johansson M, Key TJ, Travis RC, Khaw KT, Brage S, Wareham NJ and Riboli E. Physical activity and all-cause mortality across levels of overall and abdominal adiposity in European men and women: the European Prospective Investigation into Cancer and Nutrition Study (EPIC). The American journal of clinical nutrition 2015; 101(3): 613–21. [14] Lee Y, Kim J, Han ES, Chae S, Ryu M, Ahn KH and Park EJ. Changes in physical activity and cognitive decline in older adults living in the community. Age (Dordrecht, Netherlands) 2015; 37(2).
[15] Newman AB, Haggerty CL, Kritchevsky SB, Nevitt MC and Simonsick EM. Walking performance and cardiovascular response: associations with age and morbidity--the Health, Aging and Body Composition Study. The journals of gerontology. Series A, Biological sciences and medical sciences 2003; 58(8): 715–20. [16] Faul F, Erdfelder E, Buchner A and Lang AG. Statistical power analyses using G*Power 3.1: tests for correlation and regression analyses. Behavior research methods 2009; 41(4): 1149–60.
[17] Petrini C. Helsinki 50 years on. La Clinica terapeutica 2014; 165(4): 179–81.
[18] Fernandes D. A avaliação das aprendizagens no Sistema Educativo Português. Educação e Pesquisa 2007; 33(3): 581–600.
[19] Lohman R, Roche T, Martorell A. Anthropometric Standardization Reference Manual. Champaign IL: Human Kinetics Books 1991.
[20] Charlson M, Szatrowski TP, Peterson J and Gold J. Validation of a combined comorbidity index. Journal of clinical epidemiology 1994; 47 (11): 1245–51.
[21] Mungas D. In-office mental status testing: a practical guide. Geriatrics 1991; 46(7): 54–8, 63, 66. [22] Folstein MF, Folstein SE and McHugh PR. MINI-MENTAL STATE. Journal of psychiatric research 1975; 12: 189–198.
[23] Gonçalves B, Fagulha T, Ferreira A and Reis N. Depressive symptoms and pain complaints as predictors of later development of depression in Portuguese middle-aged women. Health care for women international 2014; 35(11–12): 1228–44.
[24] Ros L, Latorre JM, Aguilar MJ, Serrano JP, Navarro B and Ricarte JJ. Factor structure and psychometric properties of the center for epidemiologic studies depression scale (CES-D) in older populations with and without cognitive impairment. International journal of aging & human development 2011; 72(2): 83– 110.
[25] Syddall H, Cooper C, Martin F, Briggs R and Aihie Sayer A. Is grip strength a useful single marker of frailty?. Age and ageing 2003; 32(6): 650–6.
[26] Pitanga CPS, Pitanga FJG, Beck CC, Gabriel R ECD and Moreira MHR. Nível de atividade física para prevenção do excesso de gordura visceral em mulheres
Università degli Studi di Salerno
25
[27] Guessous I, Luthi JC, Bowling CB, Theler JM,Paccaud F, Gaspoz JM and McClellan W. Prevalence of frailty indicators and association with socioeconomic status in middle-aged and older adults in a swiss region with universal health insurance coverage: A population-based cross-sectional study. Journal of Aging Research 2014; 2014: 8.
[28] Katz S, Downs TD, Cash HR and Grotz RC. Progress in development of the index of ADL. The Gerontologist 1970; 10(1): 20–30.
[29] Graf C. The Lawton instrumental activities of daily living scale. The American journal of nursing 2008; 108 (4): 52-62; 62–3.
[30] Tinetti ME, Richman D and Powell L. Falls efficacy as a measure of fear of falling. Journal of gerontology 1990; 45(6): 239-43.
[31] Rikli C, Jones R. Senior Fitness Test Manual-2nd Edition. Champaign, IL: Human Kinetics 2013.
[32] Cho BL, Scarpace D and. Alexander NB. Tests of stepping as indicators of mobility, balance, and fall risk in balance-impaired older adults. Journal of the American Geriatrics Society 2004; 52(7): 1168–1173.
[33] Batterham AM and Hopkins WG. About Magnitudes. International Journal of Sports Physiology and Performance 2006; 1(1): 50–57.
[34] Chang SF and Lin PL. Frail phenotype and mortality prediction: A systematic review and meta-analysis of prospective cohort studies. International Journal of Nursing Studies 2015; 52(8): 1362–1374. [35] Abizanda P, López MD, García VP, Estrella J de D, da Silva González Á, Vilardell NB and Torres KA. Effects of an oral nutritional supplementation plus physical exercise intervention on the physical function, nutritional status, and quality of life in frail institutionalized older adults: The ACTIVNES study. Journal of the American Medical Directors Association 2015; 16(5): 439.e9-439.e16.
[36] de la Rica-Escuín M, González-Vaca J, Varela-Pérez R, Arjonilla-García MD, Silva-Iglesias M, Oliver-Carbonell JL and Abizanda P. Frailty and mortality or incident disability in institutionalized older adults: the FINAL study. Maturitas 2014; 78(4): 329–34.
[37] Robinson TN, Wallace JI, Wu DS, Wiktor A, Pointer LF, Pfister SM, Sharp TJ, Buckley MJ and Moss M. Accumulated frailty characteristics predict postoperative discharge institutionalization in the geriatric patient. Journal of the American College of Surgeons 2011; 213(1): 37-42; 42–4.
[38] Nóbrega PV de N, Maciel ACC, de Almeida Holanda CM, Oliveira Guerra R and Araújo JF. Sleep and frailty syndrome in elderly residents of long-stay institutions: a cross-sectional study. Geriatrics & gerontology international 2014;14(3): 605–12.
[39] Fernihough A and McGovern ME. Physical stature decline and the health status of the elderly population in England. Economics and Human Biology
heart disease: a systematic review of the literature and a meta-analysis. European heart journal 2010; 31(14): 1802–9.
[41] Wong CH, Weiss D, Sourial N, Karunananthan S, Quail JM, Wolfson C and Bergman H. Frailty and its association with disability and comorbidity in a community-dwelling sample of seniors in Montreal: a cross-sectional study. Aging clinical and experimental research 2010; 22(1): 54–62.
[42] Abizanda P, Romero L, Sánchez-Jurado PM, Martínez-Reig M, Alfonso-Silguero SA and Rodríguez-Mañas L. Age, frailty, disability, institutionalization, multimorbidity or comorbidity. Which are the main targets in older adults? The journal of nutrition, health & aging 2014; 18(6): 622–7.
[43] Romero-Ortuno R. The Frailty Instrument for primary care of the Survey of Health, Ageing and Retirement in Europe predicts mortality similarly to a frailty index based on comprehensive geriatric assessment. Geriatrics & gerontology international 2013; 13(2): 497– 504.
[44] Han ES, Lee Y and Kim J. Association of cognitive impairment with frailty in community-dwelling older adults. International psychogeriatrics / IPA 2014; 26(1): 155–63.
[45] Costa TB and Neri AL. Medidas de atividade física e fragilidade em idosos: dados do FIBRA Campinas, São Paulo, Brasil. Cadernos de Saúde Pública 2011; 27(8): 1537–1550.
[46] Theou O, Jakobi JM, Vandervoort AA and Jones GR. A comparison of physical activity (PA) assessment tools across levels of frailty. Archives of gerontology and geriatrics 2012; 54(3): 307-14.
[47] Ferrucci L, Penninx BWJH, Volpato S, Harris TB, Bandeen-Roche K, Balfour J, Leveille SG, Fried LP and Md JMG. Change in muscle strength explains accelerated decline of physical function in older women with high interleukin-6 serum levels. Journal of the American Geriatrics Society 2002; 50(12): 1947–54. [48] Clegg A, Rogers L and Young J. Diagnostic test accuracy of simple instruments for identifying frailty in community-dwelling older people: a systematic review. Age and ageing 2015; 44(1).
[49] Barrera G, Cases T, Bunout D, de la Maza MP, Leiva L, Rodriguez JM and Hirsch S. Associations between socioeconomic status, aging and functionality among older women. Geriatric nursin, 2014.
[50] Verghese J, Holtzer R, Lipton RB and Wang C. Mobility stress test approach to predicting frailty, disability, and mortality in high-functioning older adults. Journal of the American Geriatrics Society 2012; 60(10): 1901–5.
[51] Boyd CM, Xue QL, Simpson CF, Guralnik JM and Fried LP. Frailty, hospitalization, and progression of disability in a cohort of disabled older women. American
Università degli Studi di Salerno
26
Journal of Medicine 2005; 118(11): 1225–1231.[52] Greene BR, Doheny EP, O’Halloran A and Anne Kenny R. Frailty status can be accurately assessed using inertial sensors and the TUG test. Age and ageing 2014; 43(3): 406–11.
[53] Jeoung BJ and Lee YC. A Study of relationship between frailty and physical performance in elderly women. Journal of exercise rehabilitation 2015; 11(4): 215–9.
[54] Chang SF, Yang RS, Lin TC, Chiu SC, Chen ML and Lee HC. The discrimination of using the short physical performance battery to screen frailty for community-dwelling elderly people. Journal of nursing scholarship : an official publication of Sigma Theta Tau International Honor Society of Nursing / Sigma Theta Tau 2014; 46(3): 207–15.
[55] Savva GM, Donoghue OA, Horgan F, O’Regan C, Cronin H and Kenny R. A. Using timed up-and-go to identify frail members of the older population. The journals of gerontology. Series A, Biological sciences and medical sciences 2013; 68(4): 441–6.
[56] Cebolla EC, Rodacki ALF and Bento PCB. Balance, gait, functionality and strength: Comparison between elderly fallers and non-fallers .Brazilian Journal of Physical Therapy 2015; 19(2): 146–151.
[57] Furtado G, Patrício M, Loureiro M, Teixeira AM and Ferreira JP. Physical Fitness and Frailty Syndrome in Institutionalized Older Women. Perceptual and Motor Skills 2017; 124(4).