Titolo
Fukushima Dai-ichi Unit 1 Accident Simulation by Best Estimate and Integral Codes & Accident Management Procedures Identification Focusing on BWR close to the Italian Borders
Descrittori
Tipologia del documento: Rapporto Tecnico
Collocazione contrattuale: Accordo di Programma ENEA-MSE su sicurezza nucleare e
reattori di IV Generazione
Argomenti trattati: MELCOR, RELAP/SCDAPSIM, severe accident, accident
management, Fukushima Dai-ichi Sommario
Il presente documento riporta le attività relative allo sviluppo ed alla validazione di nodalizzazioni di reattori ad acqua bollente (BWR) mediante codici di calcolo per l’analisi di incidenti severi (MELCOR e RELAP/SCADPSIM). Dopo aver evidenziato le necessità di disporre di tali tools per l’analisi di reattori BWR transfrontalieri, si è analizzata la sequenza incidentale occorsa all’Unità 1 dell’impianto Nucleare di Fukushima Dai-ichi, evidenziandone le fasi salienti. Si è poi provveduto allo sviluppo preliminare di una nodalizzazione MELCOR (BWR/4) e di uno sviluppo completo di una nodalizzazione RELAP/SCDAPSIM (BWR/3). Con quest’ultima, si è svolta un’analisi preliminare dell’incidente occorso all’impianto giapponese, al fine di testare le capacità del codice e di ottenere dati di riferimento da poter confrontare, in un secondo momento, con i risultati del codice MELCOR.
Note
Questo documento è stato preparato col contributo congiunto del seguente personale di ricerca ENEA e CIRTEN:
C. Parisi, F. Mascari (ENEA)
P. Balestra, F. Giannetti, G. Caruso (Università di Roma)
sigla doc. rif. CIRTEN-Università di Roma: CERSE-UNIRM RL 1193-2014
Copia n. In carico a:
2 NOME
FIRMA
1 NOME
FIRMA
0 EMISSIONE NOME C. Parisi F. De Rosa F. De Rosa
FIRMA
REV. DESCRIZIONE DATA REDAZIONE CONVALIDA APPROVAZIONE
Sommario
Il presente documento riporta le attività relative allo sviluppo ed alla validazione di nodalizzazioni di reattori ad acqua bollente (BWR) mediante codici di calcolo per l’analisi di incidenti severi (MELCOR e RELAP/SCADPSIM). Dopo aver evidenziato le necessità di disporre di tali tools per l’analisi di reattori BWR transfrontalieri, si è analizzata la sequenza incidentale occorsa all’Unità 1 dell’impianto Nucleare di Fukushima Dai-ichi, evidenziandone le fasi salienti. Si è poi provveduto allo sviluppo preliminare di una nodalizzazione MELCOR (BWR/4) e di uno sviluppo completo di una nodalizzazione RELAP/SCDAPSIM (BWR/3). Con quest’ultima, si è svolta un’analisi preliminare dell’incidente occorso all’impianto giapponese, al fine di testare le capacità del codice e di ottenere dati di riferimento da poter confrontare, in un secondo momento, con i risultati del codice MELCOR.
Abstract
This report presents the activities devoted to the development and validation of models for Severe Accident analyses of BWR. The reference severe accident simulation codes are MELCOR and RELAP/SCDAPSIM. The need to have such tools for performing safety analysis of BWR close to the Italian border is presented. Then, the reconstruction of the sequence of events occurred at Fukushima Dai-ichi Unit 1 is reported. MELCOR nodalization of a generic BWR is described and test calculations are reported. RELAP/SCDAPSIM modelling of Fukushima Dai-ichi Unit 1 is also presented and a preliminary analysis of the accident is performed. This model and results should constitute the basis for future MELCOR works.
Index
List of Figures ... 5 List of Tables ... 7 Acronyms... 8 1. Introduction ... 10 2. BWR description ... 12 2.1 BWR Containment description ... 122.2 Boiling Water Reactors: Safety Systems ... 14
2.3 Isolation Condenser Passive System ... 15
3. Analyses of the Fukushima Accident ... 16
3.1 Introduction ... 16
3.2 Fukushima Unit 1 transient scenario ... 18
4. Code Applications ... 20
4.1 MELCOR code ... 20
4.1.1 BWR MELCOR nodalization ... 20
4.1.2 Peach Bottom Reactor Description ... 21
4.1.3 Peach Bottom MELCOR Nodalization ... 25
4.1.4 MELCOR Steady State analysis ... 29
4.1.5 Fukushima MELCOR model ... 38
4.2 RELAP5/SCDAPSIM code ... 39
4.2.1 BWR RELAP5/SCDAPSIM nodalization ... 39
4.2.2 RELAP/SCDAPSIM Model qualification ... 42
4.2.3 The Fukushima Dai-ichi Unit 1 Accident Simulation ... 43
5. Conclusions ... 49
6. References ... 50
List of Figures
Figure 1: Peach Bottom NPP view [12]. ... 13
Figure 2: Isolation Condenser sketch [13]. ... 15
Figure 3: Epicenter of the earthquake [10]. ... 16
Figure 4: Postulated general sequence of events at the Fukushima NPP [14]. ... 17
Figure 5: Peach Bottom Mark 1 containment and failure mode [12]. ... 23
Figure 6: Horizontal view of the in-pedetsal, ex-pedestal and sump cavity region [12] ... 24
Figure 7: RPV MELCOR nodalization. ... 25
Figure 8: SNAP 3 D view of the core for the COR package MELCOR nodalization. 26 Figure 9: SNAP visualization of the primary containment MELCOR nodalization ... 28
Figure 10: SNAP visualization of the secondary containment MELCOR nodalization. ... 28
Figure 11: Isolation Condenser nodalization... 29
Figure 12: SNAP two-step MELGEN MELCOR stream. ... 29
Figure 13: Visualization of the RPV fluid condition by using SNAP. ... 30
Figure 14: Pressure condition of the primary and secondary containment by using SNAP. ... 32
Figure 15: Void fraction condition of the primary and secondary containment by using SNAP. ... 33
Figure 16: Core oxidation process visualization by using SNAP. ... 34
Figure 17: Isolation Condenser operation visualization by using SNAP ... 35
Figure 18: Core degradation visualization by using SNAP. ... 36
Figure 19: Lower head status visualization and total debris mass ejected through the vessel breach data by using SNAP. ... 36
Figure 20: Lower head node temperatures visualization by using SNAP. ... 37
Figure 21: Plastic strain in vessel lower head nodes by using SNAP. ... 38
Figure 22: BWR scheme of Fukushima Dai-ichi Unit 1 ... 39
Figure 23: RELAP/SCDAPSIM TH nodalization scheme (left) and core modelling (right) ... 40
Figure 24: RELAP/SCDAPSIM TH nodalization of the MARK I containment ... 41
Figure 25 : On-transient qualification: Core Mass flow (kg/s, left), Steam Dome pressure (MPa, right) ... 43
Figure 26: On-transient qualification: Recirculation line mass flows (kg/s), line A (left), line B (right) ... 43
Figure 27: Isolation Condensers A&B Mass Flows (Kg/s) and IC-A Level (m) ... 45
Figure 28: RPV DC and in-shroud level (m), Hot spot clad temperature (°C) ... 46
Figure 29: RPV and Drywell pressures (MPa) ... 46
Figure 30: Containment pressure (MPa) – COUPLE on/off model sensitivity ... 47
Figure 31: Core degradation snapshots. Earliest (left) and latest (right) damage progressions ... 47
List of Tables
Table 1 – BWR close to the Italian border ... 10
Table 2: BWR Model VS Containment Type [10]. ... 13
Table 3: Fukushima Dai-ichi reactor details [15]. ... 17
Table 4: Unit 1 event sequence [6]. ... 19
Table 5: Peach Bottom reactor characteristic [17]. ... 21
Table 6: Peach Bottom reactor recirculation system design characteristics [17]. ... 22
Table 7: Wet well and Dry Well geometric characteristics [12]. ... 23
Table 8: Peach Bottom SRV characteristics [12]. ... 24
Table 9: Cavity region geometric characteristics [12]. ... 24
Table 10: Material mass used as reference for the MELCOR COR nodalization [12]. ... 26
Table 11: Comparison, by using SNAP, between the BWR reference value and MELCOR calculated data. ... 31
Table 12: Steady state qualification – significant parameters ... 42
Table 13: Main events simulation time ... 44
Acronyms
1D One Dimensional 3D Three Dimensional AC Alternating Current
ADS Automatic Depressurization System BE Best Estimate
BDBA Beyond Design Basis Accident BWR Boiling Water Reactor
CST Condensate Storage Tank DBA Design Basis Accident DC Direct Current
ECCS Emergency Core Cooling System EDG Emergency Diesel Generators FP Fission Products
HPCI High Pressure Coolant Injection System IC Isolation Condenser
INL Idaho National Laboratory (USA)
IRSN Institute de Radioprotection et de Sureté Nucléaire (France) LWR Light Water Reactor
MSIV Main Steam Isolation Valve
OECD/NEA Nuclear Energy Agency of the OECD OP Operating Procedures
NK Neutron Kinetics NPP Nuclear Power Plant
NRC US Nuclear Regulatory Commission PWR Pressurized Water Reactor
RCIC Reactor Core Isolation Cooling System RCS Reactor Coolant System
RPV Reactor Pressure Vessel SA Severe Accident
SBO Station Black Out SRV Safety and Relief Valve TAF Top of Active Fuel TH Thermal-hydraulics
1. Introduction
After the Fukushima accident, each Country having nuclear power generation in its national energy mix, has been more focused on developing strategies for Severe Accident (SA) mitigation. Several Severe Accident Management (SAM) analyses have been performed to analyze the possible accidents progressions, the probability of core damage, the grace periods and the amount of fission products release [1].
Generally, nuclear reactors are designed to maintain the fuel damage and radioactive release within authorized limits during selected postulated accident (Design Basis Accident). A severe accident is a Beyond Design Basis Accident (BDBA) involving significant core degradation [2], [3]. Several computational tools can be used to analyze a SA. Considering the duration and the different interacting phenomena taking place during a SA, integral codes with a modular design are used. They permit a fast transient simulation, reproducing the coupled phenomena. Example of severe accident codes are ASTEC, MELCOR [4], [5], MAAP [6], and RELAP/SCDAPSIM [7].
Though the nuclear energy is not part of the Italian energy mix, among the twenty five NPPs in the Italian border areas, twenty are PWRs and five are BWR (see Table 1).
Table 1 – BWR close to the Italian border
NPP / BWR type Electric Power
(MWe)
Muehleberg / GE – BWR/4 390 Leibstatd (Switzerland) / GE – BWR/6 1275 Gundremmingen-B (Germany) / KWU – Mod. 72 1344 Gundremmingen-C (Germany) / KWU – Mod. 72 1344 Santa Maria de Garona+ (Spain) / GE – BWR/3 466 +
in Long-Term Shutdown
Therefore the analyses of possible severe accident sequences are of interest for our national emergency preparedness strategy [8].
The ENEA activities related to the MELCOR and RELAP/SCDAPSIM codes are oriented to the simulation and evaluation of SA evolutions and source term for
“safety assessment”, mainly focusing on the characteristics of Nuclear Power Plants
(NPP) located at the Italian border. Concerning BWRs, in order to start this activity, a general, investigative work and code simulations of the Fukushima accident is in progress. This report describes the status of the MELCOR and RELAP/SCDAPSIM input decks developments and the preliminary analyses performed.
Chapter Two reports a description of a BWR, while Chapter Three reports a reconstruction of the Fukushima accident. In Chapter Four, results of MELCOR and RELAP/SCDAPSIM are given. Chapter Five presents the conclusions and the future steps.
2. BWR description
Inside BWR vessel, a steam water mixture is produced when very pure water (reactor coolant) moves upward through the core absorbing heat. The major difference in the operation of a BWR from other nuclear systems is the steam void formation in the core. The steam-water mixture leaves the top of the core and enters the two stages of moisture separation, where water droplets are removed before the steam is allowed to enter the steam line. The steam line, in turn, directs the steam to the main turbine causing it to turn the turbine and the attached electrical generator. The unused steam is exhausted to the condenser where it is condensed into water. The resulting water is pumped out of the condenser with a series of pumps and back to the reactor vessel. The recirculation pumps and jet pumps allow the operator to vary coolant flow through the core and change reactor power [9].
2.1 BWR Containment description
The containment of a BWR is a pressure suppression containment. In general it is composed by a “wet well”, a “drywell” and a “vent system”.
The wet well consists in a large capacity suppression pool situated inside the primary containment; above the pool is a leak-tight gas space. The drywell consists in a pressure retaining structure surrounding the RCS. The vent system connects the dry well space to the wet well below the suppression pool surface. The MARK 1, The MARK 2 and MARK 3 containment type can be identify [10] , [11]. Table 2 shows BWR Model generation VS containment type.
In particular the Mark I containment comprises a building (drywell), where the Reactor Pressure Vessel (RPV) and primary system reside, connected to the water-filled suppression chamber (wet well) that can be cooled over long periods of time to maintain lower pressures and temperatures to maintain its integrity. If this cooling is lost, the wet well can be vented under controlled conditions by operator action to the
atmosphere, where the suppression water pool filters out radioactive material before the release of gases by the vent.
Table 2: BWR Model VS Containment Type [10].
BWR model Containment Type
BWR/1 Several type of containment
BWR/2 Mark I
BWR/3 Mark I
BWR/4 Mark I; Few Mark II BWR/5 Mark II BWR/6 Mark III
Figure 1 shows, e.g., the Peach Bottom Atomic Power Station, Unit 2, (BWR-4) with its MARK 1 containment [12].
2.2 Boiling Water Reactors: Safety Systems
All BWRs have control rod drive systems that can be inserted to shut the reactor down. As a backup, there is also a standby liquid control system consisting of a neutron-absorbing water solution (borated) that can be injected to shut down the fission chain reaction.
In the event that the normal heat-removal pathway to the main turbine/condenser is lost, BWRs have, as the first backup, systems to provide core safety by either adding water to the RPV or by an alternate heat removal path, or by both.
BWR/3s have isolation condenser systems that both remove the decay heat by condensing the generated steam in the RPV through heat exchange with a water pool outside the drywell and return condensate to the reactor over a wide range of reactor pressures. No additional water is added, however, so if there are leaks in the primary pressure circuit, additional water is required from other sources.
BWR/4s and BWR/5s use an Reactor Core Isolation Cooling system (RCIC), which is a turbine-driven pump using reactor steam that can add water to the RPV over a wide range of reactor pressures. The RCIC system draws water from either a large pool inside the containment, the suppression pool, or from a tank located outside the containment, the condensate storage tank (CST). The RCIC system has the advantage that it can provide significantly more water than needed to make up for decay heat–generated steam, but it does not remove the heat. When the reactor becomes isolated from the main turbine/condenser, that heat is transported to the suppression pool via safety and relief valves (SRVs) that open and close to maintain the primary system pressure within safety limits. There is sufficient heat capacity in the suppression pool for many hours of decay heat storage before the heat must be removed from the containment using pumps and heat exchangers requiring electrical power. If this does not occur, the pressure and temperature in the containment will rise as time progresses.
If these first backup systems are not sufficient, then ECCSs are provided to both add water to the RPV and to remove decay heat either from the RPV or from the containment. With one exception, all these systems require alternating-current (AC)
power that is supplied either by the NPP normal AC distribution system or by emergency diesel generators (EDGs) if the normal supply is lost. The exception is that as part of the ECCSs in BWR/3s and BWR/4s, there is a high-pressure coolant injection (HPCI) system that is a turbine-driven pump that uses reactor steam and that has about seven times the capacity of the RCIC system and can add water over a wide range of reactor pressures [5].
2.3 Isolation Condenser Passive System
The Unit 1 of Fukushima NPP have two IC for removing the decay heat when the main isolation valve (MSIV) is closed and the main condenser is isolated. This passive system were originally designed to prevent over pressure in the RPV without activation of the SRV. When the pressure is higher than 7.13 MPa the IC goes in operation and continues more than 15 seconds, while the SRV activation pressure is about 7.27 MPa. Figure 2 show a layout of the IC piping and valve. In particular the valve M1, M2 and M4 are normally open. The valve M3 is normally closed.
Considering the heat removal capacity of the two ICs after the reactor scram, in order to avoid thermal stress due to cold water inflow in the RPV, the valve M3 opening is adjusted in order to have a temperature change of the RPV less than 55 °C/hr ( operator manual states) [13].
RPV Containment Vessel Recirculation Pump Condensed Water Steam Is o lat ion Con d en se r M2 M1 M3 M4 M6 Core
3. Analyses of the Fukushima Accident
3.1 Introduction
On March 11, 2011, at 2:46 p.m. (Japan time), one of the largest earthquake recorded in the history of the world occurred on the east coast of northern Japan. The earthquake generated a major tsunami; the majority of damage, which occurred in the prefectures of Iwate, Miyagi, and Fukushima, was caused by this tsunami. The total economic loss in Japan is estimated to be about US$500 billion. Electricity, gas and water supplies, telecommunications, and railway service were disrupted. Such disruptions affected the Fukushima Dai-ichi NPP reactors, which were severely damaged. Figure 3 shows the Epicenter of the earthquake [10].
The Station Black Out (SBO) of the Fukushima Dai-ichi nuclear power station occurred due to submergence of emergency equipment by the sea water. Only the passive systems, Reactor Core Isolation Cooling System (RCIC), High Pressure Coolant Injection System (HPCI) driven by steam turbines, and Isolation Condenser (IC), cool the core during the SBO. Figure 4 shows the postulated general sequence of event at the Fukushima NNP and Table 3 shows the Fukushima Dai-ichi reactor details [14].
Figure 4: Postulated general sequence of events at the Fukushima NPP [14]. Table 3: Fukushima Dai-ichi reactor details [15].
UNIT Reactor Type Model Power (MWt) Commercial Operation Date Permanent Shutdown Date
UNIT 1 BWR BWR-3 1380 26 Mar, 1971 19 May, 2011
UNIT 2 BWR BWR-4 2381 18 Jul, 1974 19 May, 2011
UNIT 3 BWR BWR-4 2381 27 Mar, 1976 19 May, 2011
UNIT 4 BWR BWR-4 2381 12 Oct, 1978 19 May, 2011
UNIT 5 BWR BWR-4 2381 18 Apr, 1978 17 Dec, 2013
3.2 Fukushima Unit 1 transient scenario
The event sequence of the Fukushima Unit 1 accident is reported in the Table 4. It is to underline that the emergency diesel generators had provided power, after the loss of offsite power, until the sea water invasion due to the tsunami. 14:52, March 11th, due a RPV high pressure signal, the two ICs automatically started causing a fast pressure decrease. IC operation was interrupted manually after 11 minutes of operation. In order to keep the RPV pressure around 7 MPa, until SBO occurrence at 15:37, one of the two ICS was intermittently operated, by varying the opening of the valve M3. 15:37, March 11th, the emergency DC batteries were submerged in the sea water. The SBO takes place. It is assumed that the power of the DC Battery had slightly survived, permitting to have the M1, M2, M3 vale partially opened after the event. By manual operation the IC was restart at 18:18 and stopped at 18:25. It seems that this is the last time that steam generation has been observed in the shell side of the IC. Until SBO occurrence, there was no steam release from the RPV, since the RPV pressure was kept below activation pressure of SRV by intermittent IC operation. Therefore, the water level in the RPV was kept enough higher than the level for activation of HPCI. And even after SBO, the HPCI did not activate because of no signal for its activation and no electricity to open valves which are in the HPCI line. The fire engine had worked from 5:46 to 14:53, March 12th for alternative water injection into the RPV. The total amount of discharge from the fire pump during this time was 80 m3, but actual amount of water into the RPV is still
unknown because the RPV pressure was not enough lower than the discharge pressure of the fire pump and there might be divergent flow from some branches in the piping connected to the RPV [13].
Table 4:Unit 1 event sequence [6].
Date and time Time after
scram [hr] Event
3/11 14:46 0 Earthquake; Reactor scrammed
3/11 14:47 0.02 MSIVs* close due to loss of instrument power, loss of normal heat sink
3/11 14:52 0.1 Isolation Condensers automatically starts (Train A and B)
3/11 15:03 0.28 Isolation Condensers (Train A and B) manually stopped to control cool down rate
3/11 15:07 0.35 Containment A and B spray systems activated 3/11 15:17 0.52 Isolation condenser train A manually started 3/11 15:19 0.55 Isolation condenser train A manually stopped 3/11 15:24 0.63 Isolation condenser train A manually started 3/11 15:26 0.67 Isolation condenser train A manually stopped 3/11 15:27 0.68 First tsunami wave hits
3/11 15:32 0.77 Isolation condenser train A manually started 3/11 15:34 0.8 Isolation condenser train A manually stopped 3/11 15:35 0.82 Second tsunami wave hits
3/11 15:41 0.92 Station Blackout; containment sprays stopped 3/11 18:18 3.53 Isolation condenser train A manually started 3/11 18:25 3.65 Isolation condenser train A manually stopped 3/11 21:30 6.73 Isolation Condenser train A manually started
3/12 5:46 15 Fresh water injection from fire water pump starts, 80,000 liters injected by 14:53
3/12 9:05 18.32 Drywell venting attempted
3/12 11:00 20.23 Isolation condenser train A manually stopped 3/12 14:30 23.73 Wetwell vented by portable generator and air
compressor
3/12 14:53 24.12 Fresh water injection stopped due to running out of fresh water. 80 ton total injection
3/12 15:36 24.83 Hydrogen explosion in the reactor building
3/12 19:04 28.3 Seawater injection from the firewater system starts 3/14 0:00 57.2 Seawater injection from the firewater system ends 3/15 0:00 81.2 Seawater injection from the firewater system starts 3/15 14:36 96 End of simulation
4. Code Applications
4.1 MELCOR code
MELCOR [12,13] is a fully integrate severe accident code able to simulate the thermal-hydraulic phenomena in steady and transient condition and the main severe accident phenomena characterizing the RPV, the reactor cavity, the containment, and the confinement buildings typical of LWR. The estimation of the source term is obtained by the MELCOR code as well. The code is based on the “control volume” approach. MELCOR can be used with the Symbolic Nuclear Analysis Package (SNAP) [16] in order to develop the nodalization and for the post processing data by using its animation model capabilities.
MELCOR has a modular structure and is based on packages. Each package simulates a different part of the transient phenomenology. In particular the CVH and FL packages simulate the mass and energy transfer between control volumes, the HS package simulate the thermal response of the heat structure and the COR package evaluates the behavior of the fuel and core structures. It is to underline that the role of the CVH/FP packages that provide the boundary condition for other packages.
MELCOR is being developed at Sandia National Laboratories for the US Nuclear Regulatory Commission (NRC).
4.1.1
BWR MELCOR nodalization
In order to develop the FUKUSHIMA unit 1 MELCOR nodalization, following the SANDIA approach reported in the Fukushima Dai-ichi Accident Study Accident Study (SAND2012-6173), the nodalization will be based on the Peach Bottom reactor (different power but similar reactor). The references used to develop the BWR Peach Bottom nodalization are the “BOILING WATER REACTOR TURBINE TRIP (TT) BENCHMARK, Volume I: Final Specifications, NEA/NSC/DOC(2001)1” [17] and the
“Severe Accident Source Term Characteristics for Selected Peach Bottom Sequences Predicted by the MELCOR Code, NUREG/CR-5942”[12].
4.1.2
Peach Bottom Reactor Description
The Peach Bottom Atomic Power Station, Unit 2, is a BWR-4 with a Mark I containment design. In relation to Peach Bottom selected reference design information’s are reported in Table 5 and Table 6.
The drywell and wet well or torus are made of steel, with an internal design pressure of 0.485 MPa. The estimated failure pressure is 1.2 MPa. Peach Bottom Mark I containment failure modes are:
- Mode 1: high pressure-induced primary containment liner failure,
- Mode 2: high temperature degradation of the drywell head flange seals,
- Mode 3: liner melt-through (or creep rupture) when hot debris in the cavity contacts the drywell liner.
The primary containment is enclosed by a reactor building; the secondary containment (reactor building) has five different floors. If a leakage from the primary containment passes through the secondary containment, the secondary containment affect the source term release in the environment.
Table 5: Peach Bottom reactor characteristic [17].
Parameter Value
Rated core thermal power, MWth 3293 Turbine inlet pressure, Pa 6.653E06 Rated reactor dome pressure, Pa 7.033E06 Rated steam flow rate, kg/s 1685.98 Approximate core inlet pressure, Pa 7.3084E06 Reactor average exit quality at rated conditions 0.129 Design hot channel active coolant exit quality 0.25 Total feedwater flow rate 1679.7 Feedwater temperature, °K 464.32 Number of recirculation pumps 2 Recirculation pump type Centrifugal Recirculation pump rated flow, kg/s 2154.56
Table 6: Peach Bottom reactor recirculation system design characteristics [17].
Number of loops 2
Design pressure (/Pa), design temperature (°K)
Suction piping 8016506, 567.59 Discharge piping 9243773, 567.59
Pumps 1.044346E07, 574.82
Operation at rated conditions
Flow (kg/s) 2154.56
Total developed head, m 216.408 Water temperature (max.)., K 548.71
Flow velocity at pump suction, m/s (approximate)
8.382 Jet pumps
Number 20
Total jet pump flow, (kg/s) 12915 Differ exit velocity, (m/s) 4.6634 Jet pump head, m 23.195
The SRVs, located on a steam header attached to the main steam lines leaving the reactor vessel, vent steam from the reactor vessel into the wetwell. The Peach Bottom Plant has a total of eleven SRVs and two spring safety valves. The eleven SRVs have different opening and closing pressures; they open automatically when the opening pressure is reached. They also close automatically when the closing pressure in the vessel is reached. The eleven SRVs are distributed into three bank of four, and three SRVs each, respectively. The two remaining spring safety valves have an automatic opening pressure of 1245 psia (8.555 MPa). Consequently, the spring safety valves will only open at high pressures after all the SRVs are already open. The spring safety valves close at a low pressure of 7.260 MPa.
The SRVs can also be opened manually at a pressure below the automatic set point. ADS actuation automatically opens five SRVs that discharge symmetrically into and around the torus below the suppression pool water level. The Peach Bottom cavity consists of the in-pedestral, the ex-pedestral and the sump region. The main characteristic of these region are reported in Table 9. Once the sump is filled with molten debris, the debris will spread and fill the in-pedestal region. The in-pedestal
and the ex-pedestal region are connected through an opening with a steel door. When the in-pedestal region is filled with molten debris, the debris will leave through the door (ablated by the debris) into the ex-pedestal region. The drywell liner is located on the periphery of the ex-pedestal region. Once the molten debris spreads out to the periphery of the ex-pedestal region, molten debris will contact the drywell liner. All the cavity floor is horizontal, with the exception of the sump region. The time needed for the molten debris to reach the drywell liner is a function of the debris release rate from the vessel and the debris viscosity. The higher the viscosity of the debris, the longer the time to travel to the liner [12].
Figure 5: Peach Bottom Mark 1 containment and failure mode [12].
Table 7: Wet well and Dry Well geometric characteristics [12].
Zone Volume
Wet well free volume 3.170 m3 Dry Well free volume 4.777 m3 Wet Well total volume (torus) 7.123 m3
Table 8: Peach Bottom SRV characteristics [12]. Valve No Bank No Opening P (MPA) Closing P (MPa) Rated Flow (kg/s) Rated P (MPA) Rated Density (kg/m3) ADS 1 1 7.687 7.253 109 7.722 40.8 yes 2 1 7.708 7.101 109 7.722 40.8 yes 3 1 7.722 7.184 109 7.722 40.8 yes 4 1 7.756 6.991 109 7.722 40.8 no 5 2 7.763 7.053 110 7.791 41.2 yes 6 2 7.791 7.322 110 7.791 41.2 yes 7 2 7.797 7.184 110 7.791 41.2 no 8 2 7.825 7.246 110 7.791 41.2 no 9 3 7.846 7.391 111 7.86 41.6 no 10 3 7.860 7.115 111 7.86 41.6 no 11 3 7.86) 7.308 111 7.86 41.6 no
Table 9:Cavity region geometric characteristics [12].
Region Horizontal Area (m2) Deph (m) Total Volume Note Sump 14.6 0.4 5.83
Region is located immediately under the vessel and it normally will be the first region to be filled with molten debris after vessel failure.
In-pedestal 29.9 - - Ex-pedestal 102.2 - -
4.1.3 Peach Bottom MELCOR Nodalization
The MELCOR nodalization [18] was designed to have a reasonable computational time and a realistic prediction of the phenomena involved during the transient assuring a reliable and accurate transient simulation.
The RPV MELCOR nodalization made by using SNAP, Figure 7, comprises the lower plenum, the core bypass, the upper plenum, the standpipes, the steam separator, the steam dome, the upper downcomer, the middle downcomer, the lower downcomer and the steam line. The 2 external recirculation loops are modelled separately, while the 20 jet pumps are modeled with two equivalent jet pumps.
Figure 7: RPV MELCOR nodalization.
The core hydraulic nodalization model consists in only one hydraulic region coupled with an active heat structure; the by bass is modelled in only one hydraulic
region. The core hydraulic nodalization is coupled with the core model for the COR package. The core of the COR package is modeled with 12 axial levels and 4 radial rings. A 3D view of the core nodalization is shown in Figure 8. The Lower Plenum cells are modeled with 5 cells, another cell represent the core plate region and the remaining 6 cells represent the active core region. The mass considered as reference in the MELCOR model are reported in the Table 10.
Lo
w
er
Pl
enum
Core Plate
Cor
e
Acti
ve R
egi
on
Figure 8: SNAP 3 D view of the core for the COR package MELCOR nodalization. Table 10: Material mass used as reference for the MELCOR COR nodalization [12].
Material Mass (kg)
Fuel 168.480 kg Zircaloy 61.708 kg
Steel 121.180 kg Poison ( Boron carbide) 1.785 kg
The primary and the secondary containment are modeled separately. In particular, the primary containment of the Mark-I design is modeled with of six separate regions: - Drywell-In-pedestal; - Drywell-Ex-pedestal; - Drywell-Top; - Drywell-Annulus; - Vent pipes; - Wetwell.
The primary containment nodalization view is shown in Figure 9. The secondary containment is modeled with nine separate regions:
- Torus room - South 135 level - North 135 level - South 165 level - Remain 165 level - South 195 level - Remain 195 level - Refueling Bay - Turbine Bldg.
The secondary containment nodalization view is shown in Figure 10. The two isolation condenser are modeled separately; in particular each isolation condenser is modeled with one control volume representing the heat exchanger thermally coupled with another control volume representing the pool. The nodalization is shown in Figure 11.
Figure 9: SNAP visualization of the primary containment MELCOR nodalization
Figure 11: Isolation Condenser nodalization.
4.1.4 MELCOR Steady State analysis
In order to run the steady state calculation, SNAP have been used. Figure 12 shows the SNAP two-step MELGEN MELCOR stream.
The comparison between the BWR reference value and the calculated data are reported in Table 11 made by using SNAP post processing capability. Several SNAP animation model have been reported in order to visualize, in a direct and user friendly way, the main thermal hydraulic and core degradation parameters. The fluid conditions of the RPV are reported in Figure 13,
Figure 14 shows the pressure condition of the primary and secondary containment,
Figure 15 shows the void fraction condition of the primary and secondary containment, Figure 16 shows the core degradation, Figure 19 shows lower head status and the total debris mass ejected through the vessel breach, Figure 20 shows the lower head node temperatures, Figure 21 shows the plastic strain in vessel lower head nodes, Figure 16 shows the core oxidation process parameters, Figure 17 shows the isolation condenser operation visualization.
Table 11: Comparison, by using SNAP, between the BWR reference value and MELCOR calculated data.
552.7 552.7
Figure 18: Core degradation visualization by using SNAP.
Figure 19: Lower head status visualization and total debris mass ejected through the vessel breach data by using SNAP.
Figure 21: Plastic strain in vessel lower head nodes by using SNAP.
4.1.5 Fukushima MELCOR model
In order to develop the FUKUSHIMA unit 1 MELCOR nodalization, following the SANDIA approach reported in the Fukushima Dai-ichi Accident Study Accident Study (SAND2012-6173), the nodalization will be based on the Peach Bottom reactor (different power but similar reactor). The main modifications are still in progress considering the difference of power and design. Considering the reference power of
the reactor of 1380MWt, a first preliminary analyses have been performed and the steady state conditions are reached.
4.2 RELAP5/SCDAPSIM code
The acquisition of the RELAP5/SCDAPSIM code [7] and the development of a model simulating the SA analysis of Unit 1 of the Fukushima Dai-ichi NPP are tasks devoted to the development of the ENEA-Casaccia “Enhanced NPP Engineering Simulator”. The code selected for simulation is based on the well-known RELAP5 thermal-hydraulic code. It can model the overall RCS thermal-thermal-hydraulic response, including the (zero dimensional) neutron kinetic and the thermo-mechanical behavior of the fuel rod. During the severe accident simulation, the core structures damage progression is modeled by means of the code SCDAP while the code COUPLE calculates the thermo-mechanics interaction between the molten material and the reactor pressure vessel lower head.
4.2.1
BWR RELAP5/SCDAPSIM nodalization
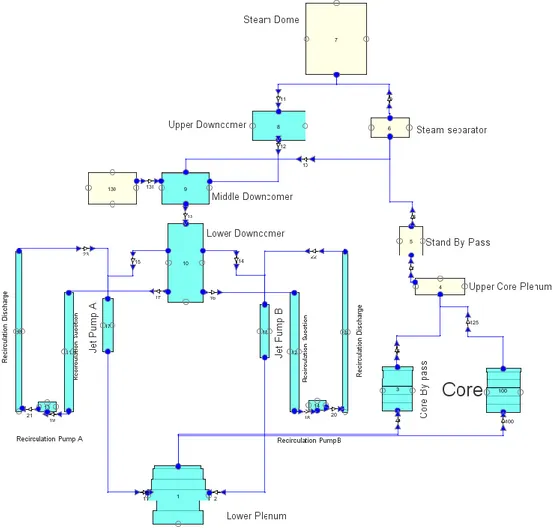
Fukushima Dai-ichi unit 1 is a BWR-3 reactor, designed by General Electric, equipped with isolation condensers [18], [19], see Figure 22.
The thermal-hydraulic (TH) nodalization models the RPV, the steam lines, the Safety & Relief Valves (SRV/RV), the IC and the two recirculation lines including the centrifugal pumps and the jet pumps. The turbine and the turbine bypass are also modelled, as imposed boundary conditions. Active and passive heat structures are used for modelling the nuclear fuel and the structural materials of the RPV and of the reactor coolant system. The active core is divided into five independent zones by means of five TH channels. Moreover, one TH channel is used for modelling the radial reflector and further five independent TH channels are used for modelling the moderator bypass. The latter is associated with the RELAP/SCDAPSIM control rod blade component. General Electric 8x8 fuel assembly (FA) data are used and appropriate peaking factors and axial power shape are imposed. ICs are modelled and connected to the upper part of the downcomer (DC) and to the two recirculation lines. All the SRV/RV are modelled by using opening and closing set points reported in reference [18]. In Figure 23, the nodalization scheme and the core radial scheme are presented.
Figure 23: RELAP/SCDAPSIM TH nodalization scheme (left) and core modelling (right)
The overall nodalization is composed of around 1000 hydraulic volumes. The geometrical data for setting up the RPV model and the reactor coolant system was retrieved by public available documentation concerning an identical unit [20].
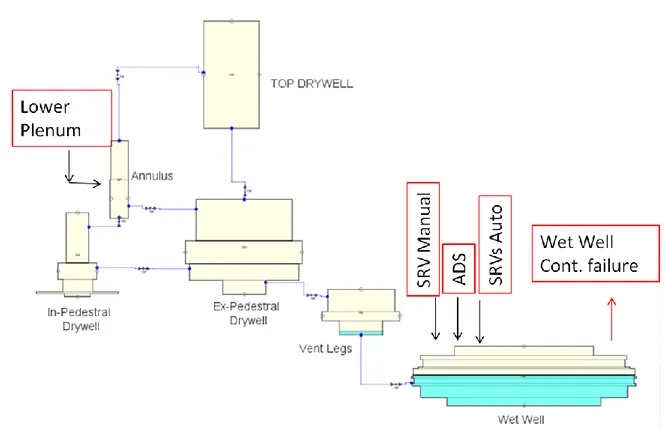
MARK I type containment is present at the Fukushima Dai-ichi unit 1. This containment type was modelled by using a nodalization scheme properly set up for simulating the three-dimensional flow paths in big volumes (Figure 24). The bulb-shaped drywell and torus-bulb-shaped wetwell are represented with a series of pipes and branches preserving the volumes of the relevant sections. The venting system (header and downcomers), the spargers and the vacuum breakers are also modelled. 009 008 007 006 005 004 003 002 011 010 001 015/016 017/018 Drywell 020/022 024/026 021/023 025/027 Wetwell Vent 035/037 039/041 036/038 040/042 030/031 032/033 Vacuum BRK 045 Safety VLV Safety/relief VLV
Figure 24: RELAP/SCDAPSIM TH nodalization of the MARK I containment
The containment nodalization is coupled to the reactor coolant system nodalization via the SRV/RVs, discharging into the wetwell liquid volumes and into the drywell atmosphere.
4.2.2
RELAP/SCDAPSIM Model qualification
A steady-state qualification was achieved by running a null transient and by verifying the main plant parameters. BWR-3 steady state data of a similar unit were used [20]. Results are showed in Table 12.
Table 12: Steady state qualification – significant parameters
PARAMETER PLANT
PARAMETER
RELAP5/
SCDAPSIM Error (%)
Core Thermal Power (W) 1.38E+09 1.38E+09 N/A
RPV dome pressure (MPa) 6.98 7.02 0.54
Total mass flow (Kg/s) 5622 5605 -0.30
Bypass flow (Kg/s) -- 341 N/A
Recirculation line mass flow (kg/s) 1308 1311 0.23
Steam Lines total mass flow (Kg/s) 685.7 685.0 -0.10
Reactor Level (m above the TAF) 4.109 4.163 1.31
FW mass flow (Kg/s) 677.5 686.0 1.25
FW Temperature (K) 452 452 N/A
The following step was the “on-transient” qualification. This was performed by reproducing a turbine trip event occurred in a similar unit [21] in 1992 and by checking some of the main parameters. Results are reported in Figure 25 and Figure 26, showing the trends of the reactor pressure dome, the core and the recirculation lines mass flows. A qualitative agreement is demonstrated by such calculations notwithstanding an imperfect knowledge of the imposed sequence of main events (i.e., the detailed operation of the steam dump system is not available).
Figure 25 :On-transient qualification: Core Mass flow (kg/s, left), Steam Dome pressure (MPa, right)
Figure 26: On-transient qualification: Recirculation line mass flows (kg/s), line A (left), line B (right)
4.2.3
The Fukushima Dai-ichi Unit 1 Accident Simulation
The main sequence of events of the accident at unit 1 (Table 13) was reconstructed by using Japanese official documentation [18], and then used for the numerical simulation.
Table 13: Main events simulation time
Main Event Time (s)
Earthquake, Reactor Scram, Turbine Stop Valve closure 0.
Bypass valve opening +30.
Bypass valve closure, MSIV closure Reactor
Isolation +60.
IC opening +360.
IC closure +1060.
IC openings/closures (3 times) from +1860. to +2880.
TSUNAMI flooding +3060.
Fresh water injection by core spray (2.4 kg/sec) +54000.
Containment venting +85440.
End of Containment venting +86580. Stop of fresh water injection [end of simulation] +86820.
The main assumption is that no reactor cooling was achieved anymore after the tsunami flooding, because of the total station blackout and the loss of the passive cooling by the ICs. Some reactor cooling was re-established by using the core sprays several hours later. Containment venting was imposed after roughly 24 hours from the beginning of the events. Simulation was stopped immediately after, because of the hydrogen explosion that occurred into the reactor building.
Seven phases of the accident were identified and simulated:
Phase 1: scram, by-pass pressure control, reactor isolation by MSIVs closure [0-60 secs]
Phase 2: energy removal by the ICs [+360 to 3060 secs]
Phase 3: End of cooling (stop of ICs), loss of RPV inventory, water level decreasing up to the Top of Active Fuel (TAF) [ ~ 3060 secs to +7000 secs (2hr)]
Phase 4: Core uncovery and degradation, H2 formation [from +2hr to +3.4/4
Phase 5: Core melting [+3.4/4 hrs to 3.8/8 hrs]
Phase 6 : RPV bottom damage and break [+3.8/8 hrs to +15 hrs]
Phase 7: Containment over-pressurization and venting [+15 hrs to +24 hrs]
The results of the reference calculation are showed in the figures below. The IC-A level and ICs mass flows are showed in Figure 27. These passive systems were actuated for removing the core decay heat during the first phases of the accident. The reference simulation was conservatively supposed to completely cease the operation of the isolation condenser systems after the tsunami wave. It should be noted that this is a point that is still being discussed by the Japanese authorities.
Figure 27:Isolation Condensers A&B Mass Flows (Kg/s) and IC-A Level (m)
Following the tsunami, the RPV level decreased, reaching the Top of Active Fuel (TAF) in 1 hour (onset of core uncovery), because of the loss of cooling by ICs and mass inventory released via the SRV towards the containment. Figure 28 provides the timing of the water level in the reactor pressure vessel downcomer and shroud sides, and the maximum cladding temperature calculated in the core. About 10 minutes later the collapsed level drops below the TAF, the cladding temperature starts to rise slowly. After 3h5min the cladding temperature exceeds 1200°C. Then, few minutes later the power of the steam zirconium interaction becomes predominant compared to the decay power, and the rate of cladding temperature increases drastically. The first fuel melting temperature is calculated in the upper part of the core after about 3h20min.
Figure 28:RPV DC and in-shroud level (m), Hot spot clad temperature (°C)
RPV pressure is kept constant by the actuation of the SRV that, on the other hand, causes a slow increase in the containment pressure (see Figure 29). A large drop into the RPV pressure was registered by the NPP instrumentation [22] and it was modelled in the simulation by imposing a RPV lower head break (see Figure 29). This loss of RPV integrity is supposed to be caused by the degradation effects caused by the fuel slumping in the bottom part of the lower plenum and it is calculated by the COUPLE module of the RELAP/SCDAPSIM. Consequently, because of the energy released into the containment by the lower plenum break and because of the H2 releases, the containment pressure spikes around 0.8 MPa. The
COUPLE module then correctly predicts the energy transfer between the molten fuel still kept into the lower head and the containment atmosphere (see Figure 30). The following pressure drop, several hours later, is obtained by simulating the containment venting [22]. Such procedure led to the hydrogen explosion into the reactor building in the real NPP.
Figure 30: Containment pressure (MPa) – COUPLE on/off model sensitivity
Several sensitivities were run in order to assess the effect of the different code models on the transient evolution. One example of such sensitivities is showed in Figure 31, where different models were applied for bounding or determining when a pool of molten material in the core region slumps to the lower head. In particular, on the left part of the picture, the degradation sequence led to the complete core slumping in 7.2 hours, while, on the right part, the degradation sequence resulted in a major core melting in 8.3 hours.
L I I L I V V L I I V V I I I V V V I I V V V V V V V V P P V V V P I P P P I I I I I I I I I I I I I I I I I I I I I I I I I I I I I I I I I I I I I I I I I I I I I I I I I I I I I I I I I I I I I I CENTER PERIPHERY V V V V P V V V V I V V V V P V V V V L V V V V V V V V V V V V V V P V V V V P V V V V L V V V V L V V V V L V V V V P V V V V P V V V V V V V V V V V V V V xxMxx V V V V xxMxx V V V P L V V L I L P V I I I CENTER PERIPHERY V V V V P V V V V I V V V V P V V V V V V V V V V V V V V V V V V V V V V V V V V V V V V V V V V V V V V V V V V V V V V V V V V V V V V V V V V V V V V V V V V V V V V V V V L V V V xxMxx I V L V L I xxMxx CENTER PERIPHERY I I I I I I I I I I I I I I I L I I I I L L L I I V L L I I V V L I I V V V L I xxMxx xxMxx xxMxx P I xxMxx xxMxx L I I L P I I I I I I I I I I I I I I I I I I I I I I I I I I I I I I I I I I I I I I I I I I I I I I I I CENTER PERIPHERY I I I I I I I I I I V I I I I V V V I I V V V I I V V V V I V V V V I V V V V I V V V V V V V V V xxMxx V V V V P V V V L I V V V I I V P P I I P I I I I I I I I I I I I I I I I I I I I I I I I I I I I I I I I I I I I I I I I I I I I L I I I I L L L I I V L L I I V V L I I V V V L I xxMxx xxMxx xxMxx P I xxMxx xxMxx L I I L P I I I I I I I I I I I I I I I I I I I I I I I I I I I I I I I I I I I I I I I I I I I I I I I I CENTER PERIPHERY L I I I I V V V I I V V V L I V V V V I V V V V I V V V V I V V V V I V V V V V V V V V V V V V V V V V V V V V V V V P V V V V I V V V V I V V V xxMxx I V V V P I V xxMxx xxMxx I I V P xxMxx I I L I P I I I I I I I I I I I I I I I I I I I I I I L I I I I L L L I I V L L I I V V L I I V V V L I xxMxx xxMxx xxMxx P I xxMxx xxMxx L I I L P I I I I I I I I I I I I I I I I I I I I I I I I I I I I I I I I I I I I I I I I I I I I I I I I CENTER PERIPHERY
3h45min 6h25min 7h10min 4h25min 5h30min 8h20min Figure 31: Core degradation snapshots. Earliest (left) and latest (right) damage
progressions
A sensitivity analysis was also run for taking into account the loss of mass inventory through the pump seals (~25 gallons per minute were imposed, [23]), resulting in an anticipation of the core degradation by half an hour. Calculation of the total hydrogen production resulted in roughly 450 Kg. Sensitivities were performed on the steam starvation model, on the oxidation extent for assessing the durability of the cladding oxide shell, and on the application of the COUPLE model. The most
relevant events of accident progression are presented in Table 14. The results of the reference simulation are compared with the analyses performed by the Japanese institutions [22] using independent severe accident codes like MAAP and MELCOR.
Table 14: Comparison of the main events simulated by different institutions
Event ENEA – R5/SCDAPSIM NISA - MELCOR TEPCO - MAAP Core Exposure 2 hrs 2 hrs 3 hrs Core Damage 3 hrs 3 hrs 4 hrs
5. Conclusions
This report presents the joint activities performed by ENEA and CIRTEN for the development of BWR input decks for SA simulation codes. Fukushima accident highlighted the need to have such tools for performing extensive safety analyses and for investigating possible mitigation strategies. Most of the European NPP close to the Italian border are PWR, but some BWR are also included (in Switzerland and Germany). Therefore ENEA promoted such researches, in order to improve the national know-how on such NPP technology. In this document it is shown the activities devoted to the development of MELCOR input deck for a BWR/4 (reference plant, Peach Bottom) and to the development of RELAP/SCDAPSIM input deck for a BWR/3 (reference plant Fukushima Dai-ichi 1). The results clearly shown codes capabilities, allowing to plan future studies on AM procedures and SA investigation.
6. References
[1] Research and development with regard to severe accidents in pressurised water reactors: Summary and outlook, Rapport IRSN-2007/83,Rapport CEA-2007/351
[2] Safety of Nuclear Power Plants: Design, IAEA Safety Standards, Specific Safety Requirements
[3] Severe Accident Management Programmes for Nuclear Power Plants, IAEA Safety Standards
[4] R. O. Gauntt et alii (2001), “Melcor computer code manuals”, Sandia National Lab
[5] http://melcor.sandia.gov/about.html
[6] Fauske & Associates, MAAP4 code (http://www.fauske.com/pdf/MAAP.pdf)
[7] C. M. Allison, J. K. Hohorst (2008), “Role of RELAP/SCDAPSIM in Nuclear Safety”, Proceeding of TopSafe Conference, Dubrovnik, Croatia
[8] F. Giannetti, F. Mascari, L. Gramiccia, A. Naviglio, F. De Rosa, Station Blackout transient analysis for a PWR like design by using the MELCOR code, 32nd UIT Heat Transfer Conference, Pisa, June 23-25, 2014.
[10] FUKUSHIMA DAIICHI: ANS Committee Report, A Report by The American Nuclear Society Special Committee on Fukushima, March 2012 Revised June 2012.
[11] SOAR on Containment Thermalhydraulics and Hydrogen Distribution, Prepared by an OECD/NEA Group of Experts, June 1999
[12] Severe Accident Source Term Characteristics for Selected Peach Bottom Sequences Predicted by the MELCOR Code, NUREG/CR-5942 / ORNL/TM-12229.
[13] Masanori Naitoh, Hiroaki Suzuki, Hidetoshi Okada FUNCTION OF ISOLATION CONDENSER OF FUKUSHIMA UNIT-1 NUCLEAR POWER PLANT, Proceedings of ICONE20-POWER2012 July 30 - August 3, 2012, Anaheim, California, USA
[14] Randall Gauntt, Donald Kalinich, Jeff Cardoni, Jesse Phillips, Andrew Goldmann, Susan Pickering, Matthew Francis, Kevin Robb, Larry Ott, Dean Wang, Curtis Smith, Shawn St.Germain, David Schwieder, Cherie Phelan. “Fukushima Daiichi Accident Study”, (Status as of April 2012), SANDIA REPORT SAND2012-6173 Unlimited Release. Printed July 2012
[15] http://www.iaea.org/pris/home.aspx
[16] Symbolic Nuclear Analysis Package (SNAP), 2007. Users Manual. Applied Programming Technology, Inc., Bloomsburg, PA.
[17] BOILING WATER REACTOR TURBINE TRIP (TT) BENCHMARK, Volume I: Final Specifications, NEA/NSC/DOC(2001)1”
[18] F. Mascari, F. De Rosa, ADVANCES IN THE ENEA ACTIVITY ON PLANT APPLICATIONS, 6th EMUG meeting European MELCOR User Group
[18] Nuclear Emergency Response Headquarters, Government of Japan (2011), “Report of the Japanese Government to the IAEA Ministerial Conference on Nuclear Safety - The Accident at TEPCO’s Fukushima Nuclear Power Stations”
[19] US NRC Technical Training Center, “GE Technology Manual (R-304B)”
[20] C. Garcia de la Rua, J. Garcia Garcia, J.V. Lopez Montero (2011), “Assessment of Single Recirculation Pump Trip Transient in Santa Maria de Garona Nuclear Power Plant With TRAC-BF1/MOD1, Version 0.4”, NUREG/IA-0193, Office of Nuclear Regulatory Research, U.S. NRC, Washington D.C., USA
[21] P. Corcuera, E. Rodriguez, and G. Villescas (2010), “Assessment of the Turbine Trip Transient in Santa Maria de Garofia Nuclear Power Plant with TRACE version 4.16”, NUREG/IA-0226, Office of Nuclear Regulatory Research, U.S. NRC, Washington D.C., USA
[22] Nuclear Emergency Response Headquarters, Government of Japan (2011), Attachment IV-1 and IV-2 of “Report of the Japanese Government to the IAEA Ministerial Conference on Nuclear Safety - The Accident at TEPCO’s Fukushima Nuclear Power Stations”
[23] GE-Hitachi Nuclear Energy (2008), “Safety Analysis Report For Monticello Constant Pressure Power Uprate (Non-Proprietary Version of Enclosure 5)”, NEDO-33322, Rev. 4, Class I
7. CV of CIRTEN authors
Gianfranco Caruso received his degree (M.S. level) in Nuclear Engineering in 1984, his Ph.D. in Energy in 1988 and obtained a Postgraduate certificate in Industrial Safety and Protection in 1992 from the “Sapienza” University of Rome. Lecturer in Nuclear Plants from 1986 to 2000, he was Adjunct Professor from 2000 to 2006 and then Assistant Professor in Applied Physics and in Nuclear Plants at the same University. He is member of the ICHMT (International Centre for Heat and Mass Transfer) Scientific Council (1998-2006 and 2012-2016) and member of UIT (Italian Union of Thermal Fluid Dynamics). He is author of two textbooks and more than 120 scientific publications in major journals and conferences. From 1984 he acquired particular expertise in the following topics: advanced thermal-hydraulics in nuclear plants; alternative energy and energy saving; air heating and conditioning; two-phases heat transfer; design of components and systems for energy production plants; studies on physical properties of fluids; heat exchange equipment; thermodynamic cycles of nuclear power plants; industrial safety.
Fabio Giannetti received his degree (M.S. level) in Energy Engineering in 2010 and his Ph.D. in Energy in 2014. He is currently a Postdoc at “Sapienza” University of Rome. He is member of UIT (Italian Union of Thermal Fluid Dynamics). He acquired particular expertise in the following topics: advanced thermal-hydraulics in nuclear power plants; thermal-hydraulics system codes; two-phases heat transfer; alternative energy and energy saving; components and systems design for energy production plants; thermodynamic cycles for nuclear power plants.
Paolo Balestra got his degree (M.S. level) in Energy Engineering in 2012. He is currently a Ph.D. student on Energy and Environmental Studies at “Sapienza” University of Rome. He is carrying out his PhD on BWR simulations by Best Estimate codes (Neutronic and Thermalhydraulics), focusing on “Oskarshamn-2” 1999 Instability Event. He is performing such activity in collaboration with the SIMING Lab of ENEA-UTFISST.
![Figure 1 shows, e.g., the Peach Bottom Atomic Power Station, Unit 2, (BWR-4) with its MARK 1 containment [12]](https://thumb-eu.123doks.com/thumbv2/123dokorg/5627787.68826/13.892.128.835.512.972/figure-shows-peach-atomic-power-station-unit-containment.webp)
![Figure 2: Isolation Condenser sketch [13].](https://thumb-eu.123doks.com/thumbv2/123dokorg/5627787.68826/15.892.267.662.787.1114/figure-isolation-condenser-sketch.webp)
![Figure 3: Epicenter of the earthquake [10].](https://thumb-eu.123doks.com/thumbv2/123dokorg/5627787.68826/16.892.298.595.746.1066/figure-epicenter-earthquake.webp)
![Figure 4: Postulated general sequence of events at the Fukushima NPP [14]. Table 3: Fukushima Dai-ichi reactor details [15]](https://thumb-eu.123doks.com/thumbv2/123dokorg/5627787.68826/17.892.149.749.171.742/figure-postulated-general-sequence-fukushima-fukushima-reactor-details.webp)
![Table 4: Unit 1 event sequence [6].](https://thumb-eu.123doks.com/thumbv2/123dokorg/5627787.68826/19.892.107.839.232.1036/table-unit-event-sequence.webp)
![Figure 5: Peach Bottom Mark 1 containment and failure mode [12].](https://thumb-eu.123doks.com/thumbv2/123dokorg/5627787.68826/23.892.130.754.436.912/figure-peach-mark-containment-failure-mode.webp)
![Table 9: Cavity region geometric characteristics [12].](https://thumb-eu.123doks.com/thumbv2/123dokorg/5627787.68826/24.892.110.826.556.1050/table-cavity-region-geometric-characteristics.webp)
![Figure 8: SNAP 3 D view of the core for the COR package MELCOR nodalization. Table 10: Material mass used as reference for the MELCOR COR nodalization [12]](https://thumb-eu.123doks.com/thumbv2/123dokorg/5627787.68826/26.892.176.716.395.830/figure-package-melcor-nodalization-material-reference-melcor-nodalization.webp)