Universit`
a degli studi di Padova
Facolt`
a di Scienze Statistiche
Corso di Laurea Specialistica in Scienze
Statistiche, Economiche, Finanziarie e
Aziendali
Tesi di Laurea in
Liste di mobilit`
a: impact of benefits
on unemployment duration
Relatore:
Prof. Jan van Ours
Prof. Anna Giraldo
Laureanda:
Silvia De Poli
Matricola: 603992-SEAContents
Chapter 1 Introduction 5
Chapter 2 Labour market policies 9
2.1 Unemployment policies . . . 10 2.1.1 Benefit system . . . 11 2.2 Unemployment policies in Italy . . . 12
2.2.1 Indennit`a ordinaria di disoccupazione con requisiti pieni . . . 12 2.2.2 Indennit`a di disoccupazione agricola ed edile . . . 13 2.2.3 Indennit`a ordinaria di disoccupazione a requisiti
ri-dotti . . . 13 2.2.4 Cassa integrazione guadagni . . . 14 2.2.5 Liste di mobilit`a . . . 14 2.2.6 Recent regional programmes in order to extend the
amount of recipients. . . 14 2.3 Unemployment expenditure in Europe . . . 15
Chapter 3 Previous studies on unemployment benefits 17
3.1 American studies . . . 17 3.2 Dutch studies . . . 19 3.3 Conclusions . . . 20
Chapter 4 Liste di mobilit`a 21
4.1 Set-up of Liste di mobilit`a . . . 21 4.1.1 Condition for enrolment and eligibility duration . . . . 22 4.1.2 The active and the passive component of the programme 22 4.2 Previous studies on LM . . . 26 4.3 Conclusion . . . 28
Chapter 5 Data used in our analysis 31
5.1.1 Giove database . . . 32
5.1.2 Inps database . . . 32
5.1.3 Linkage . . . 32
5.2 Our sample . . . 33
Chapter 6 Exploratory analyses 35 6.1 General trends depending on the contract . . . 35
6.2 Survival analyses . . . 38
6.2.1 Survival analysis up to the first job . . . 39
6.2.2 Survival analysis to a permanent job . . . 45
6.3 Conclusions . . . 49
Chapter 7 Empirical analyses 53 7.1 Logit model . . . 53
7.1.1 Logit model on the probability of first reemployment . 54 7.1.2 Logit model on the probability of permanent reemploy-ment . . . 58
7.2 Effect of benefits on first reemployment . . . 61
7.2.1 Effect of benefits on a permanent reemployment . . . . 65
7.3 Logit model near the threshold . . . 66
7.3.1 Logit model on the probability of first reemployment, near the threshold . . . 67
7.3.2 Logit model on the probability of permanent reemploy-ment near the threshold of 40 years old . . . 70
7.3.3 Effect of benefits on a permanent reemployment near the threshold . . . 72
7.4 Analyses of wages . . . 76
Chapter 8 Final conclusions 81
Appendix A 87
Chapter 1
Introduction
Work is a fundamental value of the Italian Constitution: the first article says ”Italy is a democratic republic founded on labour”.
The workers losing their job, have to face a very difficult situation in particular when the labour market is depressed. For this reason the wel-fare system introduces employment protection legislation and unemployment benefits in order to protect the individuals against uninsurable labour mar-ket risk. The first makes the dismissal of the workers more difficult for the employer, while the latter acts as replacement income for the worker experi-encing unemployment spell when he looses his job.
In this thesis we will focus on re-employment policies. Re-employment policies could have both a passive component when they support workers in their first period of unemployment and an active component for their relocation in the labour market. These policies sometimes are very expensive and not very effective on transitions from unemployment to work. Therefore this field in the last thirty years became subject of many experiments and studies, focused on understanding their impact on re-employment according to different incentives. All these programmes are different in length, amount and type of incentives. Incentives could be bonuses re-employment or benefit sanctions, like reduction of benefits level for workers who do not respect the programme rules. In this thesis we deal only with bonus re-employment. In particular we focus on an Italian labour programme, called Liste di mobilit´a (LM).
This programme, introduced in the Nineties, is a particular welfare tool that provides incentives both for workers and for employers who hire workers enrolled in LM. LM were introduced mainly to face situations of collective dismissals caused by reduction, transformation or cessation of the activity of a firm. This programme combines both active and passive components and has different features depending on the dismissing firm’s size and worker’s age
at dismissal. The active component is applied for all workers enrolled in LM, while the passive component is applied only to workers collectively dismissed by large firms. The aim of this programme is to facilitate the re-entering in the labour market, but its effects evaluation is difficult because there is no control group. Therefore analyses evaluating the impact differences on workers submitted to different treatments or with different characteristics are carried out.
Previous studies show that benefits do not always work in the right direc-tion; sometimes the income support has a negative effect on the probability of finding a job. Re-employment is more difficult for older workers, even if this programme tries to give them more incentives. Women too are more discriminated in the labour market.
In this thesis we want to study how incentives for workers and firms influence the unemployment duration. We want to analyse if the bonuses, supporting worker’s income during the unemployment period, have a negative effect on the re-employment probability. This negative effect could be due to two reasons: workers may take more time for looking for a better job or, with an opportunistic behaviour, they may see bonuses like an income and so a reason for remaining unemployed. It could be that this negative effect is hold down by the active component of the programme which transfers the benefit from worker to the hiring firm. Concerning employers, we want to understand which type of workers they, considering their incentives, prefer to hire and with which type of contract. In particular we will focus on hirings with permanent contract. We are mostly interested on the effect of the monetary benefits on unemployment duration, which could be considered both an active and a passive component. In order to understand the effect of the additional year of older workers on re-employment, we restrict our sample to workers aged between 38 and 41 years old. In this way we eliminate possible effects caused by age and we can take in account of the differences between workers below or above the threshold of 40 years old, caused by the different length of the programme. Finally we carry out some exploratory analyses in order to observe if the programme affects the quality of job, in terms of wage increase or reduction, compared to the wage of the job which causes the entrance in LM. In other words we want to study how the length of the search for a new job is related to a better or worse job and if the final results is influenced by the different features of the programme.
For this study we use data from Giove, a database coming from Centri per l’impiego of the Veneto region and from VMH, a database from INPS archive. The linkage between the two datasets permit us to have richer data on workers as social demographic characteristics (gender, age, education); working history of the previous job (salary, qualification, size of the firm)
and eventually of the subsequent job (type of contract, date of hiring and for a smaller sample also the wage after three years).
We analyse only workers younger than 49, because for workers above this threshold the situation is more complex. Sometimes they exploit an adding programme called Mobilit´a lunga, that can be considered as a bridge to the retirement.
The frame of this thesis is as follows. Chapter 2 describes labour mar-ket policies and their possible effects on the probability of re-employment. Chapter 3 is an overview of the previous studies in the United States and in Netherlands. Chapter 4 describes the Italian labour market programme, Liste di mobilit´a, first explaining the main features of the programme and then with a short summary of previous studies. Chapter 5 describes the data and provides some summary statistics. In chapter 6 some exploratory analyses are reported. Chapter 7 presents empirical analyses and chapter 8 presents the conclusions.
Chapter 2
Labour market policies
Labour market policies can be divided in active and passive policies. They are classified by Eurostat into nine categories:
1. Public employment services and administration 2. Training
3. Job rotation and job sharing 4. Employment incentives
5. Supported employment and rehabilitation 6. Direct job creation
7. Start-up incentives
8. Out-of-work income maintenance and support 9. Early retirement
The first seven categories are active policies, the last two are passive policies. In this thesis we are interested in unemployment policies, thus we start looking at the general effects of these policies by paying attention to benefit system which in Italy is the biggest component of passive policies in Italy. Then we will describe unemployment policies in Italy and we will conclude with a comparison between Italian and European expenditure for these policies.
2.1
Unemployment policies
Let us examine the aim of unemployment policies, which can be both active and passive [Sestito, 2001]. Aim of active policies is to assist people to come back in the labour market. The purpose of these policies is not only to increase the number of employed people, but also to provide unemployed people with training in order to improve their qualification and let them find a better job in terms of qualification and wage.
The aim of passive policies is to decrease the uneasiness caused by unem-ployment; their purpose is not to increase employment but to protect help-less workers. Passive policies act in a double way: they have an insurance function which provides a support to fired workers in term of income and a distribution function which prevents the level of income of some individuals from falling below a minimum level essential in their entire life cycle. These policies should improve the quality of employment; in fact with a temporary support workers could perform a more careful and aware search of a new job. In this way there will be a better matching between supply and demand.
However there is also a negative effect; in fact incentives reduce the active search of a new job. An unemployed will accept a new job offer if the wage is above his reservation wage.
The reservation wage is:
WR= {Pr(W > WR)E(W |W > WR)} + b (2.1)
where b is the benefit, W is the wage, Pr() and E() are respectively the probability and the expected value of the function [Sestito, 2001].
Therefore they will accept a new job if the offered wage is at least equal to the monetary benefits plus the advantage given by continuing the search. This advantage is the possibility to find a job with a bigger wage than the offered one and it is calculated multiplying the expected value of bigger wages by the probability to find them.
From equation 2.1 we notice that the reservation wage is a positive func-tion of the monetary benefit (the only sure benefit which workers renounce if they accept the job offer). Moreover there is a positive relationship between unemployment and the reservation wage, because if the reservation wage is higher, the probability to accept a new job offer (with a wage bigger than the reservation wage) will be smaller. By the way it does not imply that more qualified workers will stay longer unemployed, because they will probably receive better offers. Actually the equation 2.1 consider the average wage level available in the labour market (according with worker qualification), that represent a realistic level that the worker could achieve continuing the
search. Finally we can conclude that there is a positive correlation between monetary benefit and the probability to stay unemployed.
Fig. 2.1: Active and passive policies effects [Sestito, 2001]
The effect of active and passive policies can be showed to act on unem-ployment and real wages as represented in figure 2.1 [Sestito, 2001]. Passive policies increase the real wage in the short period, but they reduce employ-ment both in the long and short period. Instead active policies work in the opposite way, raising the level of employment. The problem of policy maker could be seen as a trade-off between insurance and employment purposes. In this thesis we focus on benefit system ”Liste di mobilit`a”, which is mostly a passive policy, but mixed with an active component.
2.1.1
Benefit system
Among labour policies it is worth to study the benefit system. The first unemployment benefit system was introduced in the United Kingdom in 1911, but many people did not like that persons not working could receive money by the State. Nowadays all the OECD countries and an increasing number of countries in the world, even middle-income countries with serious fiscal constraints, have or are introducing unemployment benefit systems. They try to provide more protection against income fluctuation due to job loss via unemployment benefit system rather than via employment protection legislation. These schemes are very popular among workers, but they also increase welfare of society, because they improve the allocation of human
capital and so economic growth. By the way these benefits should not be too generous in order to not discourage the job search.
These benefit systems are different in features among countries. They differ in eligibility (the norms determining access to the benefit) and entitle-ment (the rules concerning the duration and the level of payentitle-ment). Usually job losers with short unemployment duration receive benefits that are pro-portional to their past contributions. Another component of unemployment benefit system is the unemployment assistance, typically offered at a flat rate (independent of the previous wage). Unemployment assistance can also be integrated with general social assistance, which is offered for unlimited du-ration to unemployed individuals who have incomes and family assets lower than a given poverty threshold [Boeri and van Ours, 2008].
2.2
Unemployment policies in Italy
In Italy unemployed workers can take advantage both of active and passive policies. First of all we shortly look at active policies and then we see more in detail passive policies, which are mostly directed to fired workers. The main active policies in Italy are [Sestito, 2001]:
• particular kinds of contract, as apprenticeship (apprendistato, contratti di formazione-lavoro)
• training and work experiences, as internship and qualifying period • advantages for hiring firms as cut in social security contributions. This
is a component of the programme Liste di mobilit`a. • direct job creation
Beyond these policies, fired workers can be involved in different passive pro-grammes in order to support their income during unemployment. These programmes have different requirements for participation. Depending on the programme [Anastasia et al., 2011], workers will receive different amount of benefits.
2.2.1
Indennit`
a ordinaria di disoccupazione con
req-uisiti pieni
The indennit`a ordinaria di disoccupazione con requisiti pieni (ordinary un-employment benefits with full requirements) programme was introduced in
1919 as insurance against involuntary unemployment. Fired workers can en-joy up to 8 months (12 for workers older than 50 years). The amount of benefits is a percentage of the previous wage and it was equal to the 30% in 1996, 40% in 2001 and in 2008 it arrived at 60% of the previous wage [Anastasia et al., 2011]. Recipients are all fired workers (not self-employed workers) who paid at least 52 weeks of contributions in the last two years and with at least two years of compulsory insurance against unemployment. Accessibility to this programme also depends on the kind of contract, for example workers with an apprenticeship contract are excluded.
2.2.2
Indennit`
a di disoccupazione agricola ed edile
The Indennit`a di disoccupazione agricola (unemployment benefits for farm-ers) programme was introduced in the middle of the Fifties and it is an insurance against farmer unemployment. This programme was an important intervention to help needy families. Recipients were farmers who worked at least 51 days during the year and they could enjoy 40% of their wage during the period they were enrolled in suitable lists.
In 1970 was also introduced the Indennit`a di disoccupazione edile (un-employment builder’s labourer benefits), in order to support their income. The maximum length of this programme is up to 90 days with a maximum amount of 579 e.
2.2.3
Indennit`
a ordinaria di disoccupazione a requisiti
ridotti
The Indennit`a ordinaria di disoccupazione a requisiti ridotti (ordinary unem-ployment benefits with restricted requirements) programme was introduced in 1980 in order to support income of temporary and seasonal workers ex-cluded by previous programmes. Fired workers can receive 35 % of the pre-vious wage during the first four months and then during the fifth and the sixth month the bonus increase to 40 %. Sometimes workers could enjoy both this programme and the one with full requirements. In this case they have to decide between these two programme; the advantage of the first one (full requirements) is that workers could enjoy a bigger bonus, instead the advantage of the second one is that there is no interval between the dismissal and the beginning of the bonus.
2.2.4
Cassa integrazione guadagni
A special public fund Cassa Integrazione Guadagni CIG (wages guarantee fund) used to protect workers’ income, financed by companies and the state was established since 1945. The CIG provides the pay of workers affected by lay-offs or short-time working, up to 80% of the lost pay. In industry, the Fund operates through two forms of intervention (ordinary and special), gov-erned by a series of laws. Payments under ordinary intervention are granted to workers who have been suspended by work because of immediate circum-stances which cannot be blamed either on the employer or on the employees, or because of temporary market situations. Payments under special inter-vention are granted to workers who have been fired because of company reorganization, restructuring or conversion, or a company’s economic diffi-culties that are of particular social importance as regards local employment. In this programme the relationship between the employer and the employee is maintained with hope of a future upturn in work. Originally it was in-troduced as means of temporary income protection for employees, in the expectation that the company and its employees would soon resume normal activity. Afterwards it has gradually been extended even to cases in which there is no prospect of a return to the normal production and work pattern, so that it has in fact become a welfare instrument for the management of labour surpluses.
2.2.5
Liste di mobilit`
a
The Liste di mobilit`a LM (mobility list) programme was introduced in 1991. It is the most profitable unemployment programme in term of duration and amount of benefits. Workers can receive the benefits if they worked at least for one year with a permanent contract and they are fired because of reduction or cessation of their firm activity. We will see more in detail the features of this programme in chapter 4.
2.2.6
Recent regional programmes in order to extend
the amount of recipients.
During last years (2009-2011) in order to face the difficult situation caused by the crisis, some new programmes have been introduced to extend the access to unemployment benefits. These programmes are experimental and they try to assist apprentices and lavoratori a progetto (temporary workers). Apprentices who worked at least three months could enjoy 60 % of the previous wage (sometimes also 80 %) at maximum for 90 days; lavoratori a progetto who
satisfy some particular requirements could enjoy 30 % of the previous wage of the last year, up to 4000 e.
Moreover regions, according to the amount of available resources, intro-duced others programmes devoted to fired workers. The aim of these new programmes is to help workers excluded by the previous ones.
2.3
Unemployment expenditure in Europe
In this section we want to compare unemployment expenditure in Europe with the Italian one. Figure 2.2 shows the amount of social expenditure
Fig. 2.2: Public unemployment spending as % of GDP [Oecd, 2010] for unemployment policies during years 2000, 2003 and 2007. The source of these statistics is an OECD database and in this table we report data of some OECD European Countries [Oecd, 2010].
During the three years the level of Italian expenditure on unemployment policies was constant. It is 0,4 % of GDP and it is one of the lowest level of expenditure in Europe. We have a similar level in Estonia, Greece, UK, Hungary and Czech Republic. In Belgium and Denmark we have the highest level of public social expenditure, around 3 % of GDP. By the way in Denmark in 2007 the level is decreased at 1,9 % of GDP.
These statistics have to be compared with the level of unemployment in European countries in those years reported in figure 2.3. Also relating the unemployment expenditure with unemployment rate we can conclude that the expenditure level for unemployment in Italy is lower than the mean of European OECD countries.
Chapter 3
Previous studies on
unemployment benefits
As we saw in the previous chapter, unemployment policies and in particular unemployment benefits are a very common tool used by welfare systems in order to sustain income of unemployed and to help fired workers for their re-location in the labour market. By the way these policies sometimes are very expensive and not very effective on transitions from unemployment to work. Therefore in the last thirty years, this field became subject of many experi-ments and studies, focusing on understanding their impact on re-employment, according to different incentives. In this chapter we examine the results ob-tained by these experiments, in the Unites States and in Netherlands.
3.1
American studies
In the United States, in order to assist involuntary unemployed, there is the unemployment insurance (UI) which provides short-term monetary assis-tance. It provides unemployment benefits to eligible workers who are unem-ployed, but not by their fault. Eligibility, benefit amounts and duration are determined by the Federal law. Usually benefits are based on a percentage of an individual’s earnings over a recent 52-week period; in most States can be paid for a maximum of 26 weeks. Additional weeks of benefits may be available during periods of high unemployment. A frequent criticism of this system has been that the unemployment insurance benefit acts as disincentive for job seekers and prolongs the duration of unemployment insurance spells. During the 1980’s some experiments of alternative compensation scheme for UI have been tested in the US.
conducted in Illinois. In the first experiment a random sample of new UI claimants were informed that they would qualify for a bonus of $500, if they found a job of 30 hours or more per week within 11 weeks of filing the claim. They could enjoy this bonus if they retrained the new job for at least 4 months. In the second experiment a random sample of new claimants was told that their next employer would be entitled to a bonus of $500 if the claimants were able to find a job and keep it under the same conditions of the previous experiment. The two treatments were tested against a control group of claimants who followed the usual rules of the Illinois UI system. The authors found that in the first experiment the re-employment bonus reduced unemployment duration by approximately one week and reduced paid state regular benefits by an average of $158. The second experiment had a much smaller effect. The post-unemployment earnings of members of the treat-ment group didn’t differ from the earnings of members of the control group. Since the Illinois experiment was successful in reducing UI payments, the US Department of Labour sponsored others experiments to further investigate the use of a re-employment bonus in the UI system.
During 1986-1987 a re-employment bonus experiment was conducted in New Jersey [Anderson, 1992]. In this experiment UI claimants were ran-domly assigned to one of three treatment groups or to a control group. All UI claimants in treatment groups were assigned to job-search assistance ac-tivities. One treatment group was offered a cash bonus for finding a new job. During the first two weeks the bonus was equal to one half of the remaining UI entitlement for a claimant; after that the bonus amount declined by 10% of the original amount each week, falling to zero in the eleventh week of un-employment after the initial offer. A second group was offered assistance in getting into a job-training programme, or in relocation, but no cash bonus. A third group was offered nothing after the job-search assistance activities. The authors found out that the effect of a bonus on the job finding rate is significantly positive at the beginning of the offer period when the bonus was larger.
Both the New Jersey and Illinois experiments offered re-employment bo-nuses to UI claimants, but one important difference is that the Illinois bonus was constant over time, in contrast the New Jersey bonus declined over time, so that the bonus received was greater the earlier that re-employment oc-curred. The declining bonus creates a direct incentive for claimants to shorten unemployment spells to less than the full duration of the bonus qualification period [Decker, 1994].
During 1988-1989 bonus experiments were conducted also in Pennsyl-vania and Washington to test other type of re-employment bonus offers [Decker and O’Leary, 1995]. Pennsylvania and Washington tested some
dif-ferent experiments, which differed by the amount of the bonus offer and the period which an individual was qualified to receive the bonus. Pennsylvania tested four different bonus offers based on two alternative bonus amounts and two alternative qualification period, instead Washington compared six differ-ent experimdiffer-ents based on three alternative bonus amount and two alternative qualification period. The authors find that more generous bonus offers gener-ated larger impacts than did less generous offers; in particular the treatment with a higher bonus offer and a longer qualification period reduced unem-ployment duration of 0,76 weeks. All these experiments have similar impact on average UI receipt and earnings among eligible claimants. The impacts on UI receipt were statistically significant but relatively modest. The average impact of the bonus offers on earnings was extremely small and not statis-tically significant. Findings of these experiments are contrary to findings in the Illinois experiment. These experiments suggest that the re-employment bonus is not a cost-effective method of speeding the re-employment of UI claimants.
Following studies on Illinois experiments suggest that the difference be-tween the treatment and the control exit rates is positive during the period of bonus eligibility and rise just before the end of the eligibility period. One weakness of that programme is that the absence of an effect of the bonus on re-employment earnings. It suggests a greater role for changes in search intensity than changes in reservation wages.
3.2
Dutch studies
In the Netherlands there are welfare benefits in order to support unemployed workers who are not entitled to any other social insurance benefits. Unem-ployment insurance pays 70 per cent of the last earned wage for a period of time dependent on age and on their work history, which varies between 3 and 38 months. Welfare benefits recipients are often long-term unemployed with poor labour market prospects and benefits are related to the family situation, but not limited in duration.
Since 1997, to increase their transition from welfare to work, benefit re-cipients in the municipality of Rotterdam were exposed to various financial incentives. The effects of this programme is studied over the period 2000-2003 in [van der Klaauw and van Ours, 2010].
During this period, the re-employment rules changed frequently. The rules were related to accepting regular jobs in the years 2001, 2002 and 2003. If they found a job during 2001 they were entitled to a maximum of 1800e, to be paid in four equal amounts of 450e, each six months after the start of
the job and only if they remained employed. If they found a job during 2002, they were entitled to a re-employment tax rebate of maximum 2269eover a period of three years. If they found a job after January 2003, they did not receive re-employment bonuses.
The authors find that re-employment bonuses do not seem have a sig-nificant effect on the job finding rate and there is a low take-up rate of the bonuses (not due to the lack of information). Might be that people assign a lower value to benefits because of the delay in payment.
3.3
Conclusions
The main difference between US experiments and the Rotterdam programme is that in the US bonuses were paid to workers who find job quickly; instead in Rotterdam welfare recipients become entitled for a re-employment bonus after being unemployed for at least one year. Aim of the Dutch strategy is to avoid giving bonus to workers who would have found a job anyway. Bonus experiments in Rotterdam do not seem have a significant effect on the probability to find a job, probably for the delay in payment. Furthermore they support only workers who do not find a job during the first year, so they try to help only workers with a more difficult situation. Actually with this programme we can see better effectiveness of the policy, because it excludes workers that would have found a job anyway. However the results between Netherlands and America are quite similar: the effectiveness of all these programmes are often positive but, in magnitude, the effect is low. From these studies we learnt that declining bonuses are more effective than constant bonuses, because they incentive more workers to not remain unemployed.
American experiments include also control groups, so it is easier to evalu-ate the impact with respect to the Italian programme we are going to study. The American programme, most similar to the LM, is the experiment in New Jersey, where workers were entitled to income support during unemployment (passive component) and they enjoy some assistance in looking for a job (active component). In New Jersey bonuses were decreasing and thus an incentive to reduce unemployment spell was created. Also in Italy bonuses are decreasing, but they change every year and not every month.
Chapter 4
Liste di mobilit`
a
4.1
Set-up of Liste di mobilit`
a
In 1991 the Italian Parliament promulgated the law 223, which introduced new regulation for the labour market. One important innovation introduced by this law is the reintegration of collective dismissals. Collective dismissals can be applied by firms with more than 15 employees that, due to a reduction, a transformation or the cessation of the activity, want to dismiss at least 5 workers in 120 days. This law introduced a new safety valve, called Liste di mobilit`a (LM), in order to assist collectively dismissed workers.
This programme includes both a passive and an active component. The passive component is an income support that the worker receives if he/she is registered in the LM. The important innovation of this labour programme is the active component, like reductions in labour costs, which includes advan-tages for the firms who hire dismissed.
In 1993 the law 236 extended the participation to the programme also to workers individually dismissed by small firms. They could participate on voluntary basis, but they do not receive the income support.
This programme is an important innovation compared to the previous Cassa integrazioni guadagni (see section 2.2) where workers received only the passive component. With the previous programme workers were not motivated to look for a new job also because that they felt attached to the previous firm. In fact workers entered in the programme they were not defini-tively fired. Hence many workers receiving an income support did not look for a new job, hoping in a re-employment in the previous firm. With the LM, workers are finally fired and so they are induced to start searching a new job.
4.1.1
Condition for enrolment and eligibility duration
The LM programme establishes that firms with more than 15 employees may dismiss redundant workers and automatically register them in a special register maintained by a regional authority. The programme helps firms to face situation of crises, allowing them to reduce the personnel with collective dismissal. Workers dismissed by small firms, with up to 15 employees, may enter in the list but on voluntary basis.
In order to be eligible for the list, workers must have been hired with a permanent contract with the dismissing firm at least 1 year before and with at least six months of effective work in the firm (including holidays, accidents, etc).
The eligibility period varies with the worker age at time of dismissal; it lasts:
• 1 year for workers younger than 40 years old • 2 years for workers between 40 and 49 years old
• 3 years for workers older than 49, or even longer when workers are getting close to being eligible for retirement benefits.
In south Italy, the periods last respectively 2, 3 and 4 years.
Workers in the LM should carry out some obligations with respect to training and job offers. If a worker refuses an appropriate job offer (consid-ering the position and the wage of the previous work) by the local public labour exchange, he is dropped from the programme. Anyway these rules are not often applied, thus workers can refuse job offers. Workers enrolled in the LM could work for short time (up to 12 months on temporary contract) without compromise their maximum duration of stay in list. Indeed income support and LM duration are temporary frozen up to the end of the contract with the return in list.
4.1.2
The active and the passive component of the
pro-gramme
As we saw at the beginning of this chapter the LM programme is composed by an active and a passive component.
The passive component is enjoyed only by workers dismissed by large firms. During the stay in LM they are entitled to income support. These benefits are interrupted if the worker is hired and last up to the maximum stay in list. They vary according with the worker’s age.
year benchmark net pay gross wage 1997 below 2,994,924£ 1,300,730£ 1,384,344£ above 1,563,351£ 1,663,847£ 1998 below 3,036,374£ 1,325,749£ 1,403,503£ above 1,593,422£ 1,686,875£ 1999 below 3,080,098£ 1,344,839£ 1,423,713£ above 1,616,367£ 1,711,166£ 2000 below 3,119,030£ 1,361,838£ 1,441,709£ above 1,636,798£ 1,732,795£ 2001 below 3,182,908£ 1,389,729£ 1,471,235£ above 1,670,320£ 1,768,283£
2002 below 1,679.07e 733.12e 776.12e
above 881.14e 932.82e
2003 below 1,711.70e 747.38e 791.21e
above 898.27e 950.95e
Table 4.1: Summary table of ceilings during 1997-2003 [Inps, 2011].
Workers younger than 40 years old enjoy one year of income support, instead workers between 40 and 49 years old enjoy two years of benefit. Income support is equal to 80% of the previous pay during the first year and is reduced to 64% during the second and the third year (figure 4.1), with a ceiling that varies over time. In fact the amount of benefit can not exceed a ceiling fixed every year. Ceilings are divided in two ranges depending on the previous wage. In table 4.1 we can see the two ceilings from 1997 to 2003, depending on a benchmark fixed every year. For example if a worker in 2003 entered in LM because fired from a job where he earned a wage larger than 1,711.70e, then he will earn 80% of the previous wage. Nevertheless if this amount exceeds the ceiling (950.95e), he will receive just 950.95e. While, if the worker’s previous wage was below 1,711.70e, then the ceiling will be 791.21e.
Looking at the ceilings we observe that workers with high wage receive a benefit definitely smaller than the 80% of the previous wage.
On the other side, as we saw in chapter 2, workers dismissed by small firms could receive just the standard UI, that is 30% or 40% of their last wage up to 6 months.
The active component of the programme consists in benefits given to employers who hire enrolled workers from the LM. It consists in a reduction of social security contribution (SSC) and in an amount of the remaining bonus of the worker (if the worker enjoyed the benefit). The advantage of the reduction in SSC is different according to the type of contract adopted by the firm hiring the worker:
Fig. 4.1: incentives for workers to stay in LM.
• If firms hire workers on a temporary contract (up to 12 months), firms enjoy 12 month in cut SSC.
• If firms hire workers on a temporary contract and then they switch it into a permanent one, cut in SSC can last up to 2 years.
• If firms hire workers immediately on a permanent contract, they enjoy 18 months of cut in SSC.
In addition firms receive a benefit equal to 50% of the remaining bonus that workers would have received had they remained in the list. The maximum benefit transfer is equal to the 50% of total amount of the monetary benefit of at most one year.
If employers hire workers without benefit they enjoy only cut in social security contribution. Therefore the best strategy for firms is to hire a worker with benefit with a temporary contract and then switch it into a permanent one.
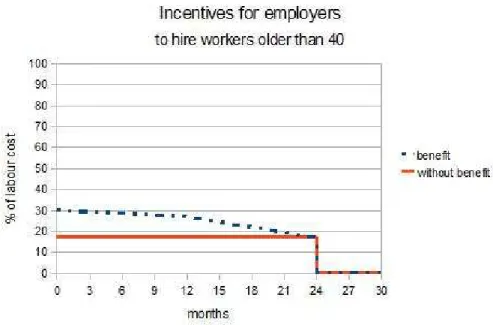
In figures 4.2 and 4.3 we can observe the incentives for firms1.
The difference of incentives for employers hiring a worker 40 − 49 years old with bonus instead of a worker younger than 40 is that they have an
1Incentives for employers are computed using a study of Rettore, Paggiaro, Trivellato
(2009). They are the percentage of labour savings (respect of the total labour cost) over two years for firm hiring a worker in LM. The assumption used for these estimates is that the annual gross wage is 13000 e
Firm size workers collectively dismissed by large firm ( ≥ 15 ) workers collectively dismissed by small firm (< 15) age of dismissal <40 40-49 <40 40-49 eligibility duration (year) 1 2 1 2
monetary benefits 80% 80% first year, 64% second year
-
-rebate on SSC’s 18 - 24 months
benefits transfer to hiring firm
50% of one year at most -
-Table 4.2: Summary table about incentives for firms [Paggiaro et al., 2009].
Fig. 4.2: Incentives for employers to hire workers enrolled in LM younger than 40 years old with a permanent contract.
Fig. 4.3: Incentives for employers to hire workers enrolled in LM older than 40 years old with a permanent contract.
additional year for hiring the worker (because the spell in the LM for these workers is of two year).
During the first month the incentives are the same, then until the end of the first year they are a little higher for the workers aged 40 − 49 because the period of bonus received by the worker is two years and by the employer is half of it up to 1 year. During the second year it is convenient to hire a worker aged 40 − 49 because there are no incentives for those younger than 40.
4.2
Previous studies on LM
There are several studies on the LM programme, because it has a considerable role in the field of labour policies and for the uncertainty of its effectiveness. All these studies differs with respect to analysed regions, methods and results, but they use all the same kind of data: administrative regional archive of LM. Since there is not an appropriate control group, analyses are concentrated on differences between different treatments received by workers, varying accord-ing to worker’s age and to the size of the firms which the workers belonged to. It is important to distinguish the effect of the treatment (one year more in the LM) from the effect of the age, which tend to combine together.
Most analyses show that remaining one more year in the LM has a nega-tive effect, maybe because older workers are more selecnega-tive in accepting a new job (they have a higher reservation wage). Although the programme gives them more incentives, the negative effect caused by the age is not eliminated. Usually studies exclude people with more than 49 years old, because some of them in the list are only waiting for retirement. The main studies on LM are about the duration of stay in the list and the probability to find a new job according to workers’ features and LM rules.
A study about length of stay in the list [Brunello and Miniaci, 1997b], conducted in Lombardia, finds out that bonuses tend to extend the duration of stay in list, in particular for workers of higher age. To avoid this negative effect, the real search and job acceptance by workers and the possible partici-pation at market of undeclared work should be checked. In the same year and still in Lombardia, Brunello and Miniaci conducted another study related to workers between 40-49 years old [Brunello and Miniaci, 1997a]. They observe that conditionally to workers’ age, an additional year of benefits reduces the probability to find a new job, in particular for women. Despite this favourable treatment for older workers, the negative effects caused by bigger reservation wages prevails on the positive effects due to the larger benefits given to the firms hiring them.
From a study [Borzaga and Carpita, 1997] conducted in Veneto and in the province of Trento, we observe that the probability to find a new job for workers enrolled in LM depends on the characteristics of workers (on the side of the supply) and of firms which discriminate older and less skilled workers (on the side of the demand). If the labour market is dynamic, there will be more possibility of finding a new job and fewer differences between men and women. From this study the passive element of the policy (benefit) does not seem to have a significant negative effect on the probability of finding a new job.
A study about LM in Veneto [Franceschini and Trivellato, 1998], notices that the bonus has a negative effect and it reduces chances of re-employment for workers older than 40 years old and in particular for those older than 50 years old. For workers younger than 40 years old, the bonus works like an active component of the policy, because it increases the probability to leave the LM. A possible cause could be that firms prefer younger workers and that older workers enjoy bonus for long period, so they are less stimulated to look for a new job.
In another study still in Veneto [Paggiaro and Trivellato, 2002], the au-thors find that the transfer of the bonus from workers to firms has not a dominant role, because the advantage obtained by the firms by the cuts in social security contributions is bigger. The SSC’s cut is invariant with the
size of the firm which the worker belonged to, with worker’s age and the time spent in LM. Moreover the authors affirm that the facility for firms to cumulate social security reductions, by hiring on temporary contracts and then transforming them into permanent ones, is used.
A study about LM in Umbria [Caruso, 2001] notices that, the longer is the period allowed in staying in list, the most negative is the effect of the bonus. This effect is associates with the negative effect of age; even if the bonus is bigger, workers are discriminated by firms for their age and they are more selective with the new job offers because they have a higher reservation wage.
In another study still in Umbria [Caruso and Pisauro, 2005], the authors study the duration of unemployment. They face the problem of opportunistic behaviours of firms; in fact firms fire some workers and then they recall the same from the LM in order to achieve incentives in cut is SSC. They find out that there is a negative dependence between unemployment duration and recall from the previous employer, while there is no dependence between unemployment duration and new jobs.
In a study in Turin [Martini and Costabella, 2007] opportunistic behav-iour of firms and of unemployed are analysed. They find out a non negligible number of firms who fraudulently dismiss their workers to rehire them soon afterwards under a different firm denomination. They also find a strong negative effect of the receipt of income support on the probability of re-employment. Such negative effect increases strongly with the age of the worker.
One of the most recent studies about LM is carried out by Paggiaro, Trivellato and Rettore in 2009. In this research they study the impact of ex-tending the duration of eligibility on re-employment probabilities and wages. They find that for most subgroups there is no significant impact, except a small negative one for women at the 40-years threshold (which could be at-tributed to family commitments in particular if they have young children) and a significant negative one for workers aged 50 years or more, probably because they use this programme as a bridge to retirement. Finally they conclude that more generous provision for older workers do not help in get-ting them back to work, but it just makes the programme more expensive [Paggiaro et al., 2009].
4.3
Conclusion
Looking at features of the LM and at previous studies we learnt that treat-ment is different mostly according to the size of the dismissing firms which
workers belonged to. However is difficult to find the real effect of different treatments because the two groups are not randomly assigned, so we do not have a control group. The treatment differs also according to the age of dis-missed workers; in particular incentives are longer for older workers. These bigger incentives are not enough to fill the differences caused by age, in fact for older workers it is more difficult to leave the LM. Incentives for workers are constant during the first year of stay in LM, then during the second and the third year they are reduced and they are enjoyed only by older workers. Incentives for firms are mostly related to cuts in social security contribution, which are enjoyed when workers enrolled in LM are hired. However incentives are bigger when workers who enjoy bonus are hired, in particular if they are at the beginning of the stay in LM. Although incentives are larger for workers who receive benefits, from the previous studies we observe that bonuses do not have always a positive significant effect on re-employment rate and that an additional year of benefits for older workers reduces the probability to find a job.
The literature relating to LM is quite wide, but this topic is worth of a lot of future studies for its importance and uncertainty of effectiveness.
Chapter 5
Data used in our analysis
5.1
Sources
In this study we use administrative data. The database is obtained by the linkage between two administrative archives: Giove (that is an archive from the Labour Exchange Office) and INPS (that is an archive from social security administration) [Maurizio and Trevisan, 2009].
The advantages to use administrative data are in term of cost, coverage and timeliness:
• there is a reduction of costs, because data-gathering takes place for other purposes and it is not sponsored and organized by statistical data collectors.
• Usually there is a total coverage, thus data are more detailed than in surveys on samples.
• The gathering of statistical data is continuous, thus it is possible to obtain data with timeliness.
Nevertheless there are also some limitations in using administrative data. In fact these databases are constructed for purposes different from the statis-tical analyses. There could be variables not collected, because considered not interesting for administrative purposes. Some administrative variables could have different definitions than those utilized in statistic and the population registered in administrative data could be different from the population of interest for statistical analyses.
5.1.1
Giove database
Giove is a statistical database composed by data coming from Labour Ex-change Offices (centri per l’impiego) [Maurizio, 2006].
Data collected by Labour Exchange Offices come from:
• firms: they are committed by law to communicate information concern-ing workconcern-ing histories (hirconcern-ing, contracts and dismissal). These are the biggest component of the dataset.
• workers: when they are looking for a job and they spontaneously go to employment exchange offices.
The database is composed by four tables, concerning workers, firms, agen-cies and working histories. In particular we utilize data about:
• workers: gender, citizenship, age and educational qualification
• working histories: the date of beginning and cessation of working spells, kind of contract, qualification and position.
5.1.2
Inps database
The other database used in order to obtain more information is composed by data coming from the archive of social security administration (Inps). In this database we have data about firms and more detailed information about working histories. In fact there are data about all the employment spell between employers and employees (with the dates of beginning and cessation of every work and contract), qualification, salary, position, kind of contracts for every spell. In particular we have data about the salary received by each worker during each working spell. For a smaller sample, composed only by workers enrolled in LM during 1997 and 1998, we have also the salary after three years from the entrance in LM.
5.1.3
Linkage
Although these two databases are composed by administrative data, there are some differences caused by the way and the purposes of data-gathering. In the first dataset we have more personal information about workers; instead in the second one we have more information about working spells and about the salaries.
The linkage is obtained using a key for workers and one for employers. With record linkage we lose some observations, but we gain in term of amount of variables.
with benefit without benefit
men women men women
total 8266 9825 7766 17832
percentage 0.19 0.22 0.18 0.41
Table 5.1: Summary statistics
5.2
Our sample
We carry out analyses on dismissed workers enrolled in LM in the Veneto region from 1997 to 2003. Veneto is a well-developed region with an unem-ployment rate lower than the Italian average. During 2003 the unemunem-ployment rate for workers between 15 and 64 years old was 3,4% compared to the 8,8% in Italy [Oecd, 2010]. Thus our main results could be generalized to most of Northern and Central Italian regions, with similar unemployment rate; but they can not be taken as representative of whole Italy. Furthermore in the South of Italy the programme is different in length. We use data from 1997 to 2006 in order to observe working histories over three years from the entrance (years 1997-2003) in the LM programme.
We consider only workers younger than 50, because for older workers the situation is more complicated, indeed sometimes they exploit an adding pro-gramme called long mobility, that is a bridge to retirement. From the linkage between the two databases we obtain a dataset with 43689 individuals. In the dataset we can follow working history for each enrolled in list up to three years. With the linkage we obtain information concerning:
• social demographic features: age, gender, education and citizenship • past working history: length, position, qualification and weekly wage
of the job which caused the mobility.
• LM with new working histories: year of start of the programme, if the worker receives benefits or not (it depends if the worker belonged to a small or a big firm), days of unemployment up to a first job and to a permanent one, kind and supposed length of the first contract and (for a smaller sample) wage after three years from the entrance in LM In table 5.1 we observe that most of our sample is composed by women without benefits. It means that a lot of women took advantage of the change of the programme LM of 1993. With this change also workers belonged to firms with less than 15 employees could be enrolled in LM, enjoying only the active component.
with benefit without benefit
men women men women
Age % <40 0.61 0.7 0.7 0.8
40-49 0.39 0.3 0.3 0.2
Citizenship % Italian 0.91 0.97 0.88 0.97
foreign 0.09 0.03 0.12 0.03
Destination of permanent 0.54 0.39 0.57 0.43
the first job % temporary 0.34 0.39 0.33 0.37
no job in 3 years 0.12 0.22 0.10 0.20
Educational middle school 0.73 0.73 0.63 0.68
qualification high school 0.24 0.23 0.25 0.29
(up to)% degree 0.03 0.02 0.02 0.02
Table 5.2: Summary statistics
with benefit without benefit
age men women men women
<40 872 1041 1023 2278
40 - 49 529 301 437 367
total 1401 1342 1460 2645
Table 5.3: Summary statistics of the reduced sample
Looking at table 5.2 we observe that there are more young than old work-ers, most of workers are Italian and with up to 8 years of education. Looking at the percentage of workers who do not find a job during three years from the beginning of the LM, we figure out that the percentage is almost the same for workers with and without benefits (a little bigger for workers without benefits) and it is around 10% for men and 20% for women.
In order to analyse effects of benefits on wages we can use a smaller sam-ple. We have data about wage of the previous job and after three years for a sample of workers enrolled during 1997 and 1998. This sample is composed by 8548 unemployed. If we restrict the sample to workers who find a per-manent job during these three years we obtain 6848 observations. Table 5.3 reports the composition of the sample by sex age and entitlement to income support.
Chapter 6
Exploratory analyses
In this chapter we describe through exploratory analyses the main data char-acteristics.
6.1
General trends depending on the contract
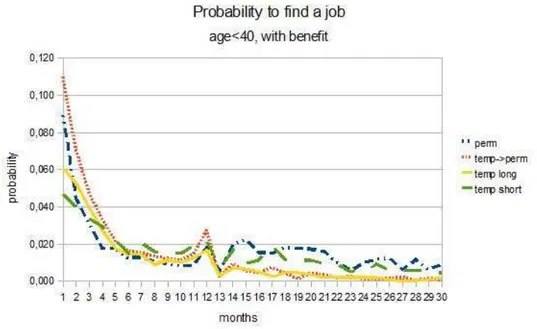
In the following four graphs we can see the probability to find a job during two years from the beginning of stay in LM, according to 4 types of contract:
• permanent;
• temporary contract switched later into a permanent one;
• temporary long (if the expected length of contract is more than 6 months);
• temporary short (if the expected length of contract is between 0 and 6 months).
These graphs are divided by age (younger and older than 40 years old) and by benefits (workers who enjoy benefits or not). They have time (in months) in abscissa and the probability to find a job in ordinate.
The probability of re-employment during the t month (rt) is computed as
follows:
Pr(rt) =
# of unemployed who find a job during t month mean between # of unemployed at t and at t+1 month Figure 6.1 shows the probability to find a job for workers younger than 40 years old, who receive benefit. During the first month it is higher, then
Fig. 6.1: Probability to find a job for workers, who receive benefits, younger than 40 years old.
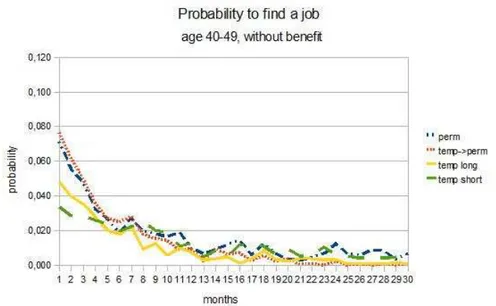
Fig. 6.2: Probability to find a job for workers younger than 40 years old, who do not receive benefit.
it decreases quickly and after some months it becomes almost constant. We can notice a little spike at one year, when workers stop to receive the bonus. Figure 6.2 shows the probability to find a job for workers younger than 40 years old, who do not receive benefit. This group has a similar trend of the previous one, but here the probability to find a job decreases slower during the first year. At the end of the first year there is a little spike and after the trend is almost constant. This group of workers do not receive benefits, but the firms have some incentives to hire them during the first year.
The spike in correspondence of the last month of the mobility, followed by a valley on the thirteenth month, could be attributed to the active part of the programme (the incentive for firms). In fact an employer hiring a worker up to the twelfth month takes advantage of cut in SSC, which is an important saving in labour cost. Thus he is more interested in hiring workers on the twelfth than on the thirteenth month. However the bigger spike seen in figure 6.1 could be attributed to the mix of active component (incentives for firms) and passive component (incentives for workers).
Focusing on the kind of contract, we notice that at the beginning there are more unemployed who find a job with a permanent contract (or with a temporary contract switched later in a permanent one) than unemployed who find a job with a temporary short contract. After some months the trend of all four kinds of contracts is almost the same.
Fig. 6.3: Probability to find a job for workers older than 40 years old, who receive benefit.
Fig. 6.4: Probability to find a job for workers older than 40 years old, who do not receive benefit.
Figure 6.3 shows the situation for workers older than 40 years old, who receive benefits. After some months the probability to find a job decreases quickly and then it is quite small until the end of the stay in LM. The probability to find a job increases at the end of the second year, when the unemployed exit from the LM.
Figure 6.4 shows the probability of re-employment for people older than 40 years old, who do not receive benefits. This group has a trend similar to that of younger workers who do not receive the bonus.
For older workers, we observe that at the end of the second year (when the programme for unemployed is almost finished), there is a little increase in re-employment. This growth is smaller for workers who do not receive benefits.
In all these four graphs we observe that during the first five months, the line representing temporary contract switched into permanent one is the highest. This is the best strategy for firms, because with this type of contract they enjoy up to 2 years of cut in SSC.
6.2
Survival analyses
Survival analysis is used to estimate the probability to leave the LM and unemployment. For workers we have data on the first three years from the
dismissal; indeed we have to face the problem of right censoring, because not all workers find a job during that period.
In order to handle the right censoring problem we could use survival anal-ysis. The survival function can be estimated by the Kaplan-Meier estimator, which can be interpreted as joint probability of surviving to time t, where surviving means remaining unemployed.
The Kaplan Meier estimator is defined by S(t) = Y
j|tj≤t
rj − dj
rj
where:
rj is the number of spell at risk at time tj. In this analysis it is the number
of unemployed at time tj
dj is the number of spells ending at time tj. In this analysis it is the number
of unemployed who find a job at time tj
6.2.1
Survival analysis up to the first job
In this section we study the unemployment duration up to the first job. Actually if a worker finds a temporary job, he will temporarily leave the LM up to the end of the contract; instead if he finds a permanent job, he will definitively leave the LM.
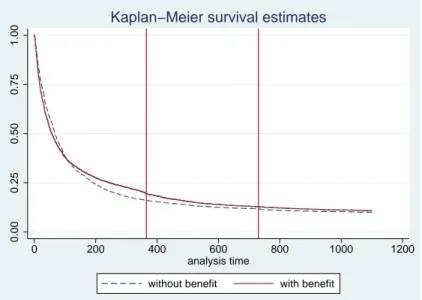
Using the Kaplan Meier estimator we check the main effects of some variables. We start with the variable most interesting for our analysis, which is the variable benefit.
Figure 6.5 has in abscissa the time in days and in ordinate the probability of staying in LM. Vertical lines show the end of the first and of the second year. The solid line represents workers who receive benefits, the dashed line the others.
From the graph we find out that at the beginning the variable benefit has a positive effect on re-employment, but after some months this effect becomes negative. During the second year the negative effect decreases and during the third year it is almost null. However the difference between the two lines is not caused only by the presence of benefits, because the two groups are not randomly selected; workers with benefit belonged to large firms, while workers without benefit belonged to smaller firms.
Now we separate the effect of the same variable benefit on four different groups. We want to check if the impact of a monetary aid is different when we divide the population in four groups according to gender and age (younger
0.00 0.25 0.50 0.75 1.00 0 200 400 600 800 1000 1200 analysis time
without benefit with benefit
Kaplan−Meier survival estimates
Fig. 6.5: Probability to stay unemployed, during the first three years, by benefit.
or older than 40 years old). For these groups, we observe what happens during the first three years from the entrance in the list. We remind that permanence in list of workers younger than 40 years lasts up to one year, while the permanence of workers older than 40 years lasts up to two years.
Figure 6.6 shows the probability of surviving (staying unemployed) for women below the threshold of 40 years old. During the first three months it is almost the same (a little higher for those who do not receive benefits), instead later it is higher for those who receive benefit. During the second and the third year, when benefits for unemployment are finished, the difference is smaller. Probably firms prefer to hire unemployed workers at the beginning of the LM because incentives are higher. After the first year workers who received benefits have more motivation to look for a job, because they do not receive money anymore; thus during the second and the third year the difference between the two groups decreases.
In figure 6.7 (men younger than 40 years old) we observe that for men the distribution has a similar trend of the previous one, but the differences between workers with and without benefits are smaller. In general the prob-ability to remain unemployed is higher for women.
In figure 6.8 we find out that the probability to find a job for women older than 40 years old is very low and here the difference, between those who receive benefits and those who do not, is higher than in the previous graphs. The group receiving benefits seems to have a real negative impact
0.00 0.25 0.50 0.75 1.00 0 200 400 600 800 1000 1200 analysis time
without benefit with benefit
Kaplan−Meier survival estimates
Fig. 6.6: Probability to stay unemployed, during the first three years for women younger than 40, by benefit.
0.00 0.25 0.50 0.75 1.00 0 200 400 600 800 1000 1200 analysis time
without benefit with benefit
Kaplan−Meier survival estimates
Fig. 6.7: Probability to stay unemployed, during the first three years for men younger than 40, by benefit.
0.00 0.25 0.50 0.75 1.00 0 200 400 600 800 1000 1200 analysis time
without benefit with benefit
Kaplan−Meier survival estimates
Fig. 6.8: Probability to stay unemployed, during the first three years for women older than 40, by benefit.
on the probability to find a new job. We observe that the negative impact decreases after the end of the second year, when workers are no longer in LM.
In figure 6.9 we observe that for men over 40, receiving benefits has a negative impact after about three months. But here the differences between the two distributions are smaller than for women. Also for this group the negative impact becomes a little smaller after the second year.
From these four graphs we can conclude that finding a new job is more difficult for women and for older unemployed. Moreover for these groups the entitlement to benefit has a bigger negative impact on the probability of re-employment.
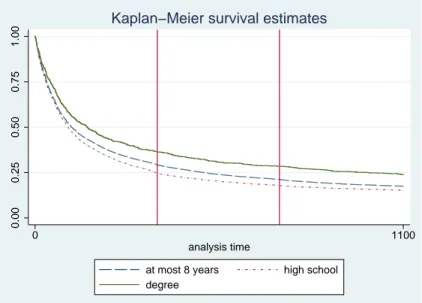
Now we analyse the effect of the variable education on the probability of re-employment. We divide the number of years of education in three groups: • middle school : where we consider workers who studied at most for 8
years
• high school: where we consider who studied between 9 and 13 years • degree: where we consider graduated workers
Figure 6.10 shows that the probability to find a new job is the highest for workers with a number of years of education between 9 and 13 and it is
0.00 0.25 0.50 0.75 1.00 0 200 400 600 800 1000 1200 analysis time
without benefit with benefit
Kaplan−Meier survival estimates
Fig. 6.9: Probability to stay unemployed, during the first three years for men older than 40, by benefit.
0.00 0.25 0.50 0.75 1.00 0 1100 analysis time
at most 8 years high school
degree
Kaplan−Meier survival estimates
Fig. 6.10: Probability to stay unemployed, during the first three years, by education.
the lowest for workers with a degree. May be that graduated workers spend more time to look for a job, because they have an higher reservation wage.
Then we analyse the effect of another variable: the influence of the type of previous work on the probability of staying in LM. We divide the type of previous job in two groups:
• White collar workers are usually salaried professionals who do a job, which is expectedly less strenuous but typically more highly paid than that of blue-collar workers. With white collar workers we indicate: highly specialized intellectual professions, intermediate technical occu-pations, administrative executive professions, jobs of sales and family services.
• Blue collar workers refer to manual or technical labourers, such as in a factory or in technical maintenance trades. They may be skilled or unskilled. With blue collar workers we include: artisans, skilled and unskilled workers and unqualified personnel.
0.00 0.25 0.50 0.75 1.00 0 200 400 600 800 1000 1200 analysis time
blue collar white collar
Kaplan−Meier survival estimates
Fig. 6.11: Probability to stay unemployed, during the first three years, by kind of previous work position.
In figure 6.11 we do not observe significant differences between two groups. The type of the previous job does not seem to influence the probability of re-employment.
0.00 0.25 0.50 0.75 1.00 0 200 400 600 800 1000 analysis time
low medium − low
medium high high
Kaplan−Meier survival estimates
Fig. 6.12: Probability to stay unemployed, during the first three years, by salary.
variable salary of the previous job1. This variable is divided in four categories,
using quartiles of the distribution. From this analysis we notice that workers with a lower previous wage have a lower probability of re-employment. This probability of re-employment increases with the growth of the previous wage and it is the same for workers with middle-high and high wages. Maybe these two groups receive the same amount of bonus because of the ceiling of maximum benefits. Looking at this figure we find out that workers with a previous job with a medium or a higher wage have a bigger probability to find a job than workers with a lower wage. We guess that this behaviour can depend both on firms, which might prefer workers with a bigger previous wage (since they are more experienced and qualified) and on workers who may have bigger necessity of income since their higher standard of living or family needs.
6.2.2
Survival analysis to a permanent job
In this section we use survival analysis in order to estimate the probability to stay in LM, where the failure is considered finding a permanent job, therefore definitively leaving the LM. In these estimates dj (the number of spells ending
at time tj) is the number of unemployed who find a permanent job at time tj.
1This variable is a proxy of the wage of the job, which caused the enrolment to the
This analysis could be useful to observe the effect of LM, because the main aim of this programme is to assist people to find a permanent job. We could achieve different results because workers who do not receive benefits may be more interested in finding a job (even if temporary) than workers who receive benefits. In fact workers without benefits have to sustain their income, while workers with benefits can afford to refuse some job offers because they are waiting for a permanent job.
First of all we analyse the effect of the variable benefit (figure 6.13). We
0.00 0.25 0.50 0.75 1.00 0 200 400 600 800 1000 1200 analysis time
without benefit with benefit
Kaplan−Meier survival estimates
Fig. 6.13: Survival analysis (where the failure is to find a job with a perma-nent contract), during the first three years, by benefit.
observe that the probability to find a permanent job is fast-growing at the end of the first year. This trend could be explained by the active component of the programme. In fact employers find profitable to hire workers during the first month of LM with a temporary contract and after one year to switch it into a permanent one. With this strategy they will enjoy up to two years of cut in social security contributions. Looking at the effect of the variable benefit we observe that after the first month the probability to find a permanent job is bigger for workers without benefits, during the second year this difference is smaller and at the end of the third year it is almost null. Differences between the two groups are similar to differences achieved in figure 6.5.
Now we separate the effect of the variable benefit on four groups divided by gender and age. We observe survival estimates for women (figure 6.14)
and men (figure 6.15) younger than 40 years old and survival estimates for women (figure 6.16) and men (figure 6.17) older than 40 years old.
0.00 0.25 0.50 0.75 1.00 0 200 400 600 800 1000 analysis time
without benefit with benefit
Kaplan−Meier survival estimates
Fig. 6.14: Survival analysis (where the failure is to find a job with a perma-nent contract), for women younger than 40 years old, during the first three years, by benefit.
First of all we observe that the variable benefit has a small positive effect for men aged up to 40, during the third year. We remember that for this group the programme lasts up to one year (first vertical line), but it could lasts longer if workers experience temporary job. During the third year workers who receive benefits have a slightly higher probability to find a permanent job than workers who do not receive them. It means that there are some small positive effects of the programme after about one year from the end of LM.
Comparing the four graphs we notice that differences between receiving or not receiving benefits are smaller for workers aged up to 40 than for older workers. The entitlement to income support has a negative effect on the prob-ability of a permanent re-employment especially for older workers. Younger workers has a bigger probability to find a permanent job than older work-ers, probably because they are more attractive on the labour market and for the possible effect caused by different length of the programme between two groups.
Now we want to check if the programme has positive effects on some sub-groups. For this reason we consider only younger workers. In particular we want to understand if the programme has a positive effect on the probability