UNIVERSITY OF SALERNO
DEPARTMENTOFCIVILENGINEERING
PHD PROGRAMME IN:“RISK AND SUSTAINABILITY IN CIVIL,ARCHITECTURAL AND ENVIRONMENTAL ENGINEERING SYSTEMS”
CURRICULUM:“ADVANCED TECHNOLOGIES,INFRASTRUCTURES AND LAND PROTECTION FOR SUSTAINABLE DEVELOPMENT”
XXXICYCLE — NEW SERIES (2016-2018)
MONITORING STRATEGIES AND
WARNING MODELS FOR
WEATHER-INDUCED LANDSLIDES
(STRATEGIE DI MONITORAGGIO E MODELLI DI ALLERTA PER FRANE METEO-INDOTTE)
PhD candidate:GAETANOPECORARO
Supervisor:
PROF.MICHELECALVELLO
Coordinator:
PROF.FERNANDO FRATERNALI UN
In copertina: Chiura Obata: Landslide, 1941
MONITORING STRATEGIES AND WARNING MODELS FOR WEATHER-INDUCED LANDSLIDES
__________________________________________________________________ Copyright © 2019 Università degli Studi di Salerno – via Ponte don Melillo, 1 – 84084 Fisciano (SA), Italy – web: www.unisa.it
Proprietà letteraria, tutti i diritti riservati. La struttura ed il contenuto del presente volume non possono essere riprodotti, neppure parzialmente, salvo espressa autorizzazione. Non ne è altresì consentita la memorizzazione su qualsiasi supporto (magnetico, magnetico-ottico, magnetico-ottico, cartaceo, etc.).
Benché l’autore abbia curato con la massima attenzione la preparazione del presente volume, Egli declina ogni responsabilità per possibili errori ed omissioni, nonché per eventuali danni dall’uso delle informazioni ivi contenute.
INDEX
INDEX ... i
INDEX OF FIGURES ... v
INDEX OF TABLES ... xiii
ABSTRACT ... xv
SOMMARIO ... xvii
ACKNOWLEDGEMENTS ... xix
ABOUT THE AUTHOR ... xxi
1 INTRODUCTION ... 1
2 EWS FOR WEATHER-INDUCED LANDSLIDES... 5
2.1 Weather-induced landslides ... 5
2.1.1 Types of landslides and possible consequences ... 5
2.1.2 Structural and non-structural risk mitigation measures ... 8
2.2 Landslide early warning systems ... 10
2.2.1 Structure and main modules ... 10
2.2.2 The scale of analysis ... 12
2.3 Review on local landslide early warning systems ... 14
2.3.1 Location, period, and state of activity ... 14
2.3.2 Landslide model ... 19
2.3.3 Warning model ... 25
2.3.4 Warning system... 31
2.4 Reviews on territorial landslide early warning systems ... 37
2.4.1 Reviews on territorial landslide early warning systems ... 37
2.4.2 Regional LEWS operational in Italy ... 39
2.4.3 Rainfall thresholds for landslide occurrence ... 42
3 MONITORING STRATEGIES AND WARNING MODELS .. 45
3.1 Monitoring strategies within Lo-LEWS ... 45
3.1.1 Classification of monitoring instruments ... 45
3.1.2 Activities and parameters monitored ... 49
3.1.4 Monitoring strategies ... 54
3.2 Monitoring strategies and warning models within Te-LEWS .. 56
3.2.1 Monitoring strategies ... 56
3.2.2 Warning models ... 59
3.3 Open issues ... 64
4 THE PROPOSED METHODOLOGIES ... 67
4.1 Conceptual framework... 67
4.2 Probabilistic warning model ... 73
4.3 Multi-scalar warning model ... 75
5 APPLICATIONS OF PROBABILISTIC WARNING MODEL 79 5.1 Probabilistic warning model: workflow ... 79
5.2 Landslide database: the “Franeitalia” project ... 81
5.2.1 Methodology ... 81
5.2.2 Database structure ... 83
5.2.3 Database contents ... 88
5.3 Satellite rainfall measurements ... 90
5.3.1 Global Precipitation Measurement (GPM) mission ... 90
5.3.2 Analysis of rainfall data... 93
5.4 Bayesian probabilistic analysis ... 95
5.5 Case study 1: Emilia-Romagna region, Italy ... 97
5.5.1 Study area... 97
5.5.2 Territorial units and available datasets ... 99
5.5.3 Correlation between landslides and rainfall events ... 100
5.5.4 Calibration of the model ... 104
5.5.5 Comparison with other regional thresholds in Emilia-Romagna ... 106
5.6 Case study 2: Campania region, Italy ... 109
5.6.1 Study area... 109
5.6.2 Territorial units and available datasets ... 110
5.6.3 Correlation between landslides and rainfall events ... 112
5.6.4 Calibration of the model ... 116
5.6.5 Validation of the model ... 118
6 APPLICATION OF MULTI-SCALAR WARNING MODEL . 123 6.1 Multi-scalar warning model: workflow ... 123
6.2 Case study: Norway ... 125
6.2.2 The national LEWS ... 129
6.3 Territorial units and available datasets ... 132
6.4 Application of the regional warning model ... 137
6.5 Calibration of the multi-scalar warning model ... 139
6.5.1 Definition of the model ... 139
6.5.2 Calibration of the model parameters ... 142
6.6 Validation of the multi-scalar warning model ... 146
6.6.1 Performance criteria and indicators ... 146
6.6.2 Performance evaluation ... 148
7 CONCLUSIONS ... 153
REFERENCES ... 161
APPENDIX ... 177
A) Landslide events occurred in Emilia-Romagna and Campania regions ... 177
B) Example of a Google Earth Engine script for analyzing the satellite rainfall data ... 187
C) Fact sheets of the 30 Norwegian hydrological basins ... 189
INDEX OF FIGURES
Figure 2.1 Example of landslide classification scheme for early warning purposes proposed by Calvello (2017) ... 6 Figure 2.2 Schematic representation of the integrated risk management
process proposed by Fell et al. (2005) ... 8 Figure 2.3 Framework identifying the main modules of landslide early
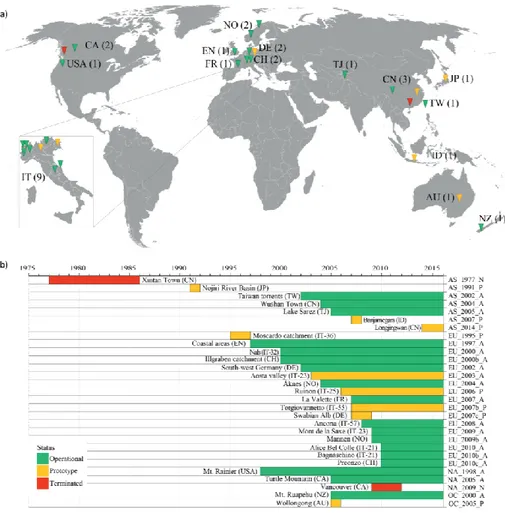
warning systems (modified from Calvello 2017) ... 12 Figure 2.4 Local landslide early warning systems: a) national distribution;
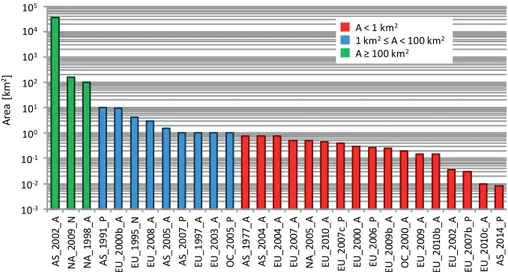
b) location and period of activity (Pecoraro et al. 2018) ... 15 Figure 2.5 Lo-LEWS reported in the literature ordered by covered area21 Figure 2.6 Schematic view (a) and cross section (b) of the Longjingwan
landslide (Ju et al. 2015) ... 22 Figure 2.7 Shenmu debris flow monitoring station, one of the 17 on-site
monitoring station located around Taiwan island (Yin et al.
2011) ... 23
Figure 2.8 Causes of landslides addressed within the Lo-LEWS reviewed by Pecoraro et al. (2018) ... 23 Figure 2.9 Coastal landslide occurred in Scarborough, south-eastern coast
of England (McInnes and Moore 2011) ... 24 Figure 2.10 Type of landslide under surveillance within the Lo-LEWS
reviewed herein. Total is higher than 29 because two different type of landslides are considered in EU_2010c_A (Pecoraro et
al. 2018)... 25
Figure 2.11 Map of the Preonzo 2012 trigger, propagation, and deposition areas. Elements at risk (industrial area of Sgrussa, cantonal road, A2 highway) are also shown (Loew et al. 2016) ... 25 Figure 2.12 Warning criteria adopted within the Lo-LEWS reviewed by
Pecoraro et al. (2018) ... 27
Figure 2.13 Example of extensometers data used for defining the thresholds in Torgiovannetto (Intrieri et al. 2012) ... 28 Figure 2.14 Failure time calculated from rate of movement in (a) Ruinon
(Crosta and Agliardi 2003) and (b) Preonzo (Loew et al. 2016)29
Figure 2.15 Number of warning levels adopted within the Lo-LEWS reviewed by Pecoraro et al. (2018) ... 30
Figure 2.16 Warning level transitions and switches that allow transitions from one warning level to another (Jakob et al. 2012) ... 31 Figure 2.17 Seismic measurements from a geophone installed in the
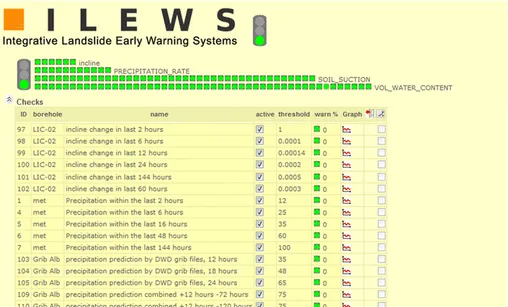
Moscardo catchment on 5 July 1995 (Arattano 1999) ... 33 Figure 2.18 ILEWS status control highlighting the parameters monitored
and the thresholds for issuing the daily alerts (Thiebes et al.
2014) ... 34
Figure 2.19 Organization of the structure designed for assessing the Ancona Landslide (Cardinaletti et al. 2011) ... 35 Figure 2.20 Home page of the website dedicated at spreading information
on landslides under surveillance in Wollongong (Flentje and
Chowdhury 2005) ... 35
Figure 2.21 Communication tools used (a) and their redundancy (b) within the Lo-LEWS reviewed by Pecoraro et al. (2018) ... 36 Figure 2.22 Downstream view of two radar sensors for measuring flow
depth as employed in the Illgraben catchment (Badoux et al.
2009) ... 37
Figure 2.23 Territorial landslide early warning systems operational worldwide: location and period of activity. Legend: red squares: dates of catastrophic landslide events; dark blue: period of activity, retrieved from reliable references; light blue: period of activity, assumed by authors (Piciullo et al. 2018) ... 38 Figure 2.24 Functional Centres in charge of designing and operating
regional LEWS in Italy (Pecoraro and Calvello 2016) ... 40 Figure 2.25 Geographical distribution of the analyzed rainfall thresholds.
Countries colored based on the number of published thresholds. In the inset in the bottom left, the number of papers per scientific journal in which they were published.
(Segoni et al. 2018a) ... 42
Figure 2.26 Bar chart showing the number of thresholds published in scientific journals from 2008 to 2016. Each year, the number of thresholds implemented in a LEWS (Yes), the preliminary thresholds (Preliminary), and thresholds not deemed to be part of a LEWS (No) are also shown by means of different colored bars (Segoni et al. 2018a) ... 43 Figure 3.1 Inventory of the parameters (a) and the activities (b) monitored
classification of Table 3.1 (modified from Pecoraro et al. 2018) ... 50 Figure 3.2 Monitored activities in relation to the type of landslide and to
the group of parameters according to the classification of Table 3.1; totals are higher than 29, i.e. the total number of reviewed Lo-LEWS, because multiple parameters are monitored in some systems and two different types of landslides are considered in EU_2010c_A (Pecoraro et al. 2018) ... 51 Figure 3.3 Inventory of the monitoring instruments (a) and methods (b)
employed within the 29 reviewed Lo-LEWS according to the classification of Table 3.1 (modified from Pecoraro et al. 2018) ... 52 Figure 3.4 Monitoring methods grouped in relation to the type of landslide
and to the group of instruments according to the classification of Table 3.1; totals are higher than 29, i.e. the total number of reviewed Lo-LEWS, because multiple monitoring methods are employed in some systems and two different types of landslides are considered in EU_2010c_A (Pecoraro et al. 2018) ... 53 Figure 3.5 a) Total number of monitored parameters composing the
monitoring networks and monitored parameters directly used to issue the warnings. b) Total number of instruments composing the monitoring networks and instruments directly used to issue the warnings (Pecoraro et al. 2018) ... 55 Figure 3.6 Monitored parameters (a) and monitoring methods (b)
employed within the 24 Te-LEWS operational worldwide . 57 Figure 3.7 Monitored parameters (a) and monitoring methods (b)
employed within the 21 regional LEWS operational in Italy ... 58 Figure 3.8 Sources of rainfall data used to define thresholds within the 45
Te-LEWS operational worldwide (modified from Segoni et al.
2018a). Legend: n.s.: not specified ... 58
Figure 3.9 a) Classification (following the schematization by Guzzetti et al.
2007) and b) number of thresholds employed in the 24
Te-LEWS operational worldwide (Piciullo et al. 2018) ... 60 Figure 3.10 a) Classification (following the schematization by Guzzetti et al.
2007) and b) number of thresholds employed in the 21
Figure 3.11 a) Information sources used to define the thresholds, b) methods used for drawing or defining the thresholds, c) classification (following the schematization by Guzzetti et al.
2007) and d) number of thresholds employed in the 45
Te-LEWS operational worldwide (modified from Segoni et al.
2018a). Legend: n.s.: not specified ... 63
Figure 4.1 Conceptual framework highlighting the main elements needed for the definition of a warning model for weather-induced landslides ... 68 Figure 4.2 Flowchart of the proposed methodology for the definition of a
probabilistic warning model for weather-induced landslides ... 74 Figure 4.3 Flowchart of the proposed methodology for the definition of a
multi-scalar warning model for weather-induced landslides 76 Figure 5.1 Flowchart of the proposed methodology for the definition of
the probabilistic warning models for rainfall-induced landslides applied to the Emilia-Romagna and Campania case studies ... 80 Figure 5.2 Structure of the “FraneItalia” landslide database (Calvello and
Pecoraro 2018)... 84
Figure 5.3 The “FraneItalia” landslide catalog for the period 01/01/2010– 31/12/2017: (a) SLE records; (b) ALE records (Calvello and
Pecoraro 2018). Legend: #L = Number of landslides ... 89
Figure 5.4 Number of landslides inventoried in the 20 Italian regions, differentiated per season (Calvello and Pecoraro 2018) ... 90 Figure 5.5 Constellation of satellites and international partners
participating in the GPM mission
(https://pmm.nasa.gov/GPM) ... 91 Figure 5.6 Components of the Earth Engine Code Editor at
https://code.earthengine.google.com/ ... 93
Figure 5.7 Methodology developed for analyzing the GPM rainfall data using GEE ... 94 Figure 5.8 Example of two-dimensional Bayesian analysis. (a) Rainfall
intensity-duration plot showing rainfall that did and did not result in landslides. (b) Histogram of conditional landslide probability for four different combinations of duration and cumulated rainfall ... 96 Figure 5.9 The eight warning zones of the Emilia-Romagna region. The
Figure 5.10 Shaded relief map of the eight warning zones of the Emilia-Romagna region showing the 102 rainfall-induced “FraneItalia” landslide records from March 2014 to December 2015, differentiated in single (red circles) and areal landslide events (blue squares). The inset shows the location of the Emilia-Romagna region in Italy ... 100 Figure 5.11 Example of the application of the standard algorithm for the
reconstruction of rainfall events. a) Detection of rainfall events (highlighted by blue-shaded areas) grouping hourly rainfall measurements (blue bars). b) Exclusion of irrelevant rainfall events (red bars). c) Identification of landslide events (highlighted by the warning sign). d) Differentiation between triggering and non-triggering rainfall events (highlighted by green-shaded areas) ... 102 Figure 5.12 Rainfall duration (D) vs. cumulated rainfall (E) in Emilia-Romagna from March 2014 to December 2015. Red circles are 78 ED rainfall conditions associated with the triggering of SLEs. Blue squares are the 24 ED rainfall conditions associated with the triggering of ALEs. Grey circles are 927
ED rainfall conditions for which information on triggered
landslides is not available. Data are in log-log coordinates 103 Figure 5.13 Histogram of posterior landslide probability, P(L|D,E) as a
function of duration (D) and cumulated rainfall (E) ... 104 Figure 5.14 Posterior landslide probabilities obtained considering the
rainfall events reported in Figure 5.12. Lines of equal probability are also drawn ... 105 Figure 5.15 Comparison between the probabilistic threshold (T15,P) and the
other rainfall thresholds reported in the literature for Emilia-Romagna in the log-log DE plane. Triggering and non-triggering rainfall conditions are also reported ... 108 Figure 5.16 Warning zones and weather stations of the Campania region ... 110 Figure 5.17 Shaded relief map of the eight warning zones of the Campania
region showing the 143 rainfall-induced “FraneItalia” landslide records from March 2014 to December 2017, differentiated in single (red circles) and areal landslide events (blue squares). The inset shows the location of the Campania region in Italy ... 111
Figure 5.18 Example of the application of the automated algorithm for the reconstruction of rainfall events. a) Collection of hourly rainfall measurements (blue bars). b) Exclusion of the irrelevant isolated rainfall events (red bars). c) Identification of the rainfall sub-events (highlighted by blue-shaded areas). d) Selection of irrelevant sub-events (red bars). e) Identification of rainfall events (highlighted by green-shaded areas) ... 114 Figure 5.19 Example of the application of the automated algorithm for the
reconstruction of rainfall events. a) Rainfall measurements (blue bars) and rainfall events identified by the first logical block of the algorithm (highlighted by green-shaded areas). b) Identification of landslide events (highlighted by the warning sign). c) Identification of the possible rainfall combinations for a triggering rainfall event (highlighted by green-shaded area). d) Identification of the possible rainfall combinations for two non-triggering rainfall events (highlighted by green-shaded areas) ... 115 Figure 5.20 Rainfall duration (D) vs. cumulated rainfall (E) in Campania
from March 2014 to December 2017. Red circles are 479 rainfall conditions associated with the triggering of SLEs. Blue squares are the 76 rainfall conditions associated with the triggering of ALEs. Grey circles are 2876 rainfall conditions for which information on triggered landslides is not available. Data are in log-log coordinates ... 116 Figure 5.21 Posterior landslide probabilities obtained considering the
rainfall events reported in Figure 5.20. Lines of equal probability are also drawn ... 118 Figure 5.22 ROC curve drawn considering the 6 employed thresholds.
Each POFD-POD pair (blue dot) corresponds to a threshold defined considering a given probability (label value). The “no gain” line and the perfect classification point (red dot, upper left corner) are also shown ... 120 Figure 6.1 Flowchart of the proposed methodology for the definition of a
multi-scalar warning model for weather-induced landslides applied to the Norwegian case study ... 124 Figure 6.2 Overview of quaternary deposits in Norway. Source:
Figure 6.3 Examples of weather-induced landslides in Norway. a) Debris slides and debris flows. Veikledalen, Kvam, June 2011. b) Debris flow. Mjåland, Rogaland, June 2016. c) Flash flood. Notodden, Telemark, July 2011. d) Slushflow. Troms, May 2010 (Krøgli et al. 2018) ... 128 Figure 6.4 Hydrometeorological hazard thresholds used in the Norwegian
national LEWS (Colleuille et al. 2010) ... 130 Figure 6.5 Conceptual framework of the national LEWS. Red arrows
indicate quantitative processes; blue arrows indicate qualitative processes (modified from Krøgli et al. 2018) ... 132 Figure 6.6 Landslides reported in the national landslide catalog (landslide
occurred in the period of analyses are marked in red) ... 134 Figure 6.7 Location of the 30 test areas ... 135 Figure 6.8 Example of application of the regional warning model to the
Horvereidelva basin: a) collection of 1-km2 meteorological gridded data and b) comparison of daily hydrometeorological indexes with the regional warning thresholds ... 138 Figure 6.9 Example of application of simple moving average to a pore
water pressure data series considering a time period of 2 days ... 141 Figure 6.10 Scheme of the methodology developed for analyzing pore
water pressure observations. The numbers to the right indicate the change from the original warning level (WL0) of the new warning model ... 141 Figure 6.11 Simple moving average differences calculated using time
periods (n) of 1, 2, 3, 4, 5, 6, 7, and 14 days ... 144 Figure 6.12 Comparison between Δu*
14,10,25 (a) and Δu*14,10,30 (b) considering number and level of transitions with respect to the regional warning model ... 146 Figure 6.13 Alert classification (a) and grade of correctenss (b)
performance criteria used for the analysis of the correlation matrix (modified from Calvello and Piciullo 2016) ... 147 Figure 6.14 Bar chart showing the values of success indicators for each
combination of thresholds. Efficiency index (Ieff), hit rate
(HRL), and positive predictive power (PPW) values are shown
as percentages (green bars). The absolute values for the odds ratio (OR) are also reported (brown bars, on secondary vertical axes in reverse order) ... 150
Figure 6.15 Bar chart showing the percentage values of error indicators for each combination of thresholds: missed alert rate (RMA), false alert rate (RFA), error rate (ER) and probability of serious errors (PSM). The latter two are reported on secondary vertical axes in reverse order ... 151
INDEX OF TABLES
Table 2.1 Local and territorial LEWS function of detection factors, lead time and warning characteristics (Calvello 2017) ... 14 Table 2.2 Location, country, managing institution, source of information,
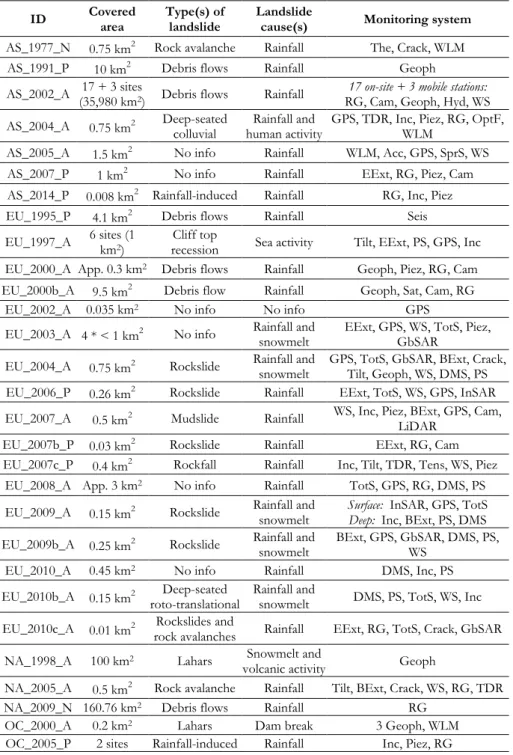
and year of most recent information of the Lo-LEWS reviewed by Pecoraro et al. (2018) ... 18 Table 2.3 Information on landslide model developed within the Lo-LEWS
reviewed by Pecoraro et al. (2018) ... 20 Table 2.4 Information on warning model developed within the Lo-LEWS
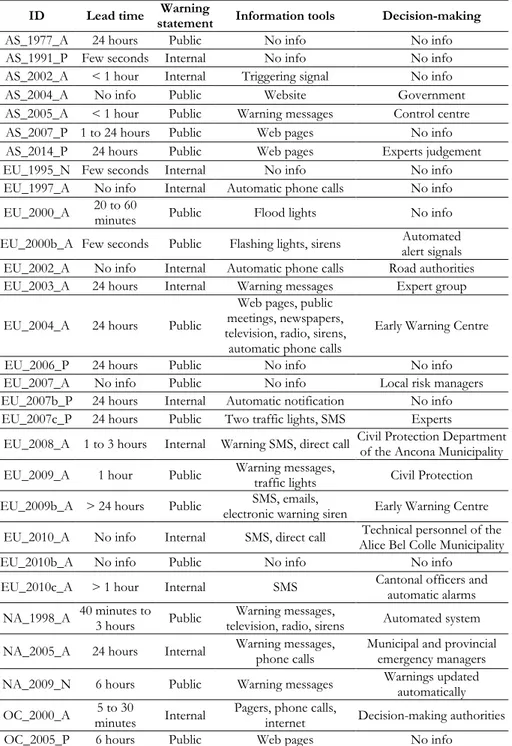
reviewed by Pecoraro et al. (2018). Legend: HM: Heuristic method; CL: Correlation law; PM: Probabilistic model ... 26 Table 2.5 Information on warning system of Lo-LEWS reviewed by
Pecoraro et al. (2018) ... 32
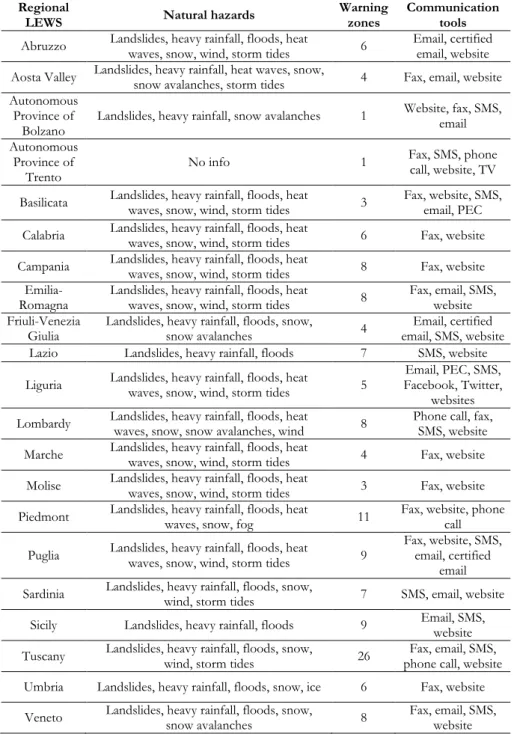
Table 2.6 Regional LEWS operational in Italy: natural hazards addressed; warning zones; communication tools (Pecoraro and Calvello
2016) ... 41
Table 3.1 Instruments used for landslide monitoring within LEWS, classified considering the parameters and the activities monitored and the monitoring methods (modified from
Calvello 2017) ... 48
Table 5.1 News aggregators used to populate FraneItalia from January 2010 to December 2017 (Calvello and Pecoraro 2018) ... 87 Table 5.2 Landslides inventoried in the “FraneItalia” catalog from 2010 to
2017 ... 88 Table 5.3 Technical characteristics of the GPM products used in this
research (Huffman et al. 2018) ... 92 Table 5.4 Environmental ED thresholds for the Emilia-Romagna region
defined by Peruccacci et al. (2017) ... 106 Table 5.5 Contingencies scores calculated for the probabilistic threshold
(T15,P) and for the other thresholds proposed in the literature
for Emilia-Romagna. Best values are shown in italics ... 108 Table 5.6 Parameters used for the application of the algorithm developed
Table 5.7 Contingencies (TP, FP, FN, TN) and skill scores (POD, POFD,
POFA, HK, δ) calculated for the probabilistic thresholds
defined herein. Best scores are shown in italics ... 121 Table 6.1 Name, area, loose sediments, landslides occurred, and
piezometers available within the 30 test areas ... 136 Table 6.2 Results obtained applying the regional warning model employed
in the national LEWS to the 30 test areas ... 139 Table 6.3 Number of uptrends (up), downtrends (down), and no trends
per each moving average difference considering warning events that resulted in landslides. The number of warning events issued for each warning level is reported in round brackets ... 143 Table 6.4 Number of uptrends (up), downtrends (down), and no trends
per each moving average difference considering warning events that did not resulted in landslides. The number of warning events issued for each warning level is reported in round brackets ... 144 Table 6.5 Correlation matrices computed for the regional warning model
(RM) and for six thresholds combinations... 145 Table 6.6 Performance indicators used for the analysis (modified from
Calvello and Piciullo 2016) ... 148
Table 6.7 Values of the correlation matrix elements in terms of “alert classification” (a) and “grade of accuracy” (b) criteria (Figure 6.13). Best values are shown in italics ... 149 Table 6.8 Performance indicators obtained for each the regional warning
model (RM) and for each combination of thresholds. Best values are shown in italics ... 150 Table A.1 Main information on ALEs occurred in Emilia-Romagna
between March 2014 and December 2015 ... 178 Table A.2 Main information on SLEs occurred in Emilia-Romagna
between March 2014 and December 2015 ... 179 Table A.3 Main information on ALEs occurred in Campania between
March 2014 and December 2017 ... 182 Table A.4 Main information on SLEs occurred in Campania between
March 2014 and December 2017 ... 183 Table A.5 Main variables and acronyms used in the text ... 250
ABSTRACT
Weather-induced landslides cause a large number of casualties as well as severe economic losses worldwide every year. Such a diffuse risk cannot be mitigated only by means of structural works, typically characterized by significant economic and environmental impacts. Therefore, landslide early warning systems (LEWS) are being increasingly applied as non-structural mitigation measures aiming at reducing the loss-of-life probability and other adverse consequences from landslide events by prompting people to act appropriately and in sufficient time to reduce the possibility of harm or loss. The systems can be distinguished, as a function of the scale of design and operation, in two different categories. Territorial systems (Te-LEWS), deal with multiple landslides over wide areas at regional scale, i.e. typically a basin, a municipality or a region; local systems (Lo-LEWS) address single landslides at slope scale.
In a preliminary phase of this study, a detailed review of Lo-LEWS operational worldwide is provided. The information has been retrieved from peer-reviewed articles published in scientific journals and proceedings of technical conferences, books, reports, and institutional web pages. The main characteristics of these systems have been summarized and described according to a scheme based on a clear distinction between three modules: landslide model, warning model and warning system. The monitoring strategies implemented therein have been presented and discussed, focusing on the monitored parameters and the monitoring instruments for each type of landslide. Subsequently, warning models developed within Te-LEWS for weather-induced landslides have been analyzed, pointing out that: their outputs are strongly dependent from the accurateness and reliability of the information on landslide occurrences; and only meteorological variables are considered in most of the cases, thus leading to an unavoidable uncertainty in the empirically defined thresholds. To overcome these issues, original procedures for defining warning models are herein proposed and tested on case studies in Campania and Emilia-Romagna regions (Italy) and in Norway. In Italy, a probabilistic approach has been developed to determine landslide conditional probabilities related to rainfall of specific intensity and
duration. The adopted Bayesian methodology allows to consider the uncertainty of the data and to provide a quantitative assessment of the reliability of the results. Data on landslide occurrences have been derived from a new landslide inventory, named “FraneItalia”, wherein data are retrieved from online journalistic news; the correlations between landslides and rainfall have been assessed by analyzing satellite-rainfall records within weather alert zones. On the other hand, the methodology proposed for Norway aims at integrating the hydro-meteorological variables employed within the regional model used by the national early warning system (i.e. combinations of relative water supply and relative soil water saturation degree) with monitoring data collected at local scale, specifically pore water pressure observations acquired by the Norwegian Geotechnical Institute for a variety of projects. The analyses are carried out on a number of hydrological basins (test areas) defined at national scale and selected considering the occurrence of landslides in loose soils from 2013 to 2017 and the availability of a significant number of pore water pressure measurements. For each basin, the alerts issued by the regional model are assessed by means of a 2-step analysis employing indicators derived from simple moving averages of the pore water pressure measurements.
The warning models developed herein were successfully applied to selected case studies. Therefore, the proposed methodologies can be considered valuable frameworks considering aspects that are crucial for improving the efficiency of the models, such as: the potential of non-conventional landslide inventories and remote sensing monitoring instruments to complement the traditional sources of data, the use of probabilistic techniques for defining more objective rainfall thresholds, and the additional contribution of the information derived from the local observations of pore water pressures.
SOMMARIO
Le frane meteo-indotte causano un numero elevato di vittime oltre a ingenti perdite economiche in tutto il mondo ogni anno. Un rischio tanto diffuso non può essere mitigato solamente attraverso opere strutturali, tipicamente contraddistinte da considerevoli impatti economici e ambientali. Di conseguenza, i sistemi di allerta da frana (LEWS) vengono sempre più applicati come misure di mitigazione di tipo non strutturale con lo scopo di ridurre la probabilità di perdita della vita e altre conseguenze avverse derivanti da eventi franosi inducendo le persone ad agire responsabilmente e in tempo utile per ridurre la possibilità di danno o perdita. Tali sistemi possono essere classificati in due differenti categorie, in funzione della scala a cui vengono progettati e applicati. I sistemi territoriali (Te-LEWS), si occupano di numerose frane su vaste aree a scala regionale, tipicamente un bacino idrografico, un comune o una regione; i sistemi locali (Lo-LEWS) operano su singole frane alla scala di pendio. In una fase preliminare di questo studio, è presentata una rassegna dettagliata dei sistemi di allerta locali operanti in tutto il mondo. Le informazioni sono state ricavate sia da articoli specializzati pubblicati in riviste, sia da atti di conferenze tecniche, libri, report e pagine web istituzionali. Le principali caratteristiche di questi sistemi sono state sintetizzate e descritte secondo uno schema basato su una chiara distinzione tra tre moduli: modello di franosità, modello di allerta e sistema di allerta. Le strategie di monitoraggio ivi implementate sono state presentate e discusse, concentrandosi particolarmente sui parametri monitorati e sugli strumenti di monitoraggio adottati per ciascun tipo di frana. Successivamente, sono stati analizzati i modelli di allerta sviluppati all’interno dei sistemi di allerta territoriali, rilevando che i loro rendimenti dipendono fortemente dall’accuratezza e dall’affidabilità delle informazioni sull’occorrenza delle frane e nella maggior parte dei casi sono considerate soltanto variabili meteorologiche, portando dunque a un’ineluttabile incertezza nelle soglie definite in via empirica. Al fine di risolvere queste problematiche, delle procedure originali per definire dei modelli di allerta sono proposte in questo lavoro e testate in casi di studio in Emilia-Romagna e Campania (Italia) e in Norvegia. In Italia, un
approccio probabilistico è stato sviluppato per determinare le probabilità condizionate relative a frane di specifica durata e intensità. La metodologia bayesiana adottata permette di considerare l’incertezza dei dati e di garantire una stima quantitativa dell’affidabilità dei risultati. Le informazioni sull’occorrenza delle frane sono state derivate da un nuovo inventario di frane, chiamato “FraneItalia”, i cui dati sono ricavati da articoli di stampa online; le correlazioni tra frane e piogge sono state valutate analizzando dati satellitari di pioggia all’interno di zone di allerta meteo. Invece, la metodologia proposta per la Norvegia mira ad integrare le variabili meteorologiche impiegate nel modello regionale utilizzato dal sistema nazionale di allerta (combinazioni di apporto idrico e grado di saturazione del suolo relativi) con dati di monitoraggio raccolti a scala locale, nello specifico misure di pressioni interstiziali acquisite dal Norwegian Geotechnical Institute per diversi progetti. Le analisi sono eseguite su una serie di bacini idrografici (aree di studio) definiti a scala nazionale e selezionati considerando l’occorrenza di frane in sedimenti sciolti dal 2013 al 2107 e la disponibilità di un numero significativo di misure di pressioni interstiziali. Per ogni bacino le allerte emanate dal modello regionale sono valutate attraverso un’analisi in due passi che impiega indicatori derivati da medie mobili semplici delle misure di pressioni interstiziali.
I modelli di allerta sviluppati in questo studio sono stati applicati con successo ai casi di studio selezionati. Di conseguenza, le metodologie proposte possono essere considerate degli utili schemi che tengono conto di aspetti cruciali per migliorare l’efficienza dei modelli di allerta, fra cui: il potenziale di inventari di frana non convenzionali e strumenti in telerilevamento nell’integrare le tradizionali fonti di dati, l’utilizzo di tecniche probabilistiche per definire soglie pluviometriche più obiettive e il contributo addizionale delle informazioni derivate da osservazioni locali di pressioni.
ACKNOWLEDGEMENTS
Giunto alla fine di questo percorso, sento il dovere di ringraziare le persone con le quali ho lavorato e interagito durante questi anni.
In primo luogo, un enorme ringraziamento lo devo a Michele, per essere stato un punto di riferimento sempre presente, per il costante supporto e per tutte le possibilità di crescita che mi hai offerto durante questi anni. Svolgere questo dottorato sotto la tua supervisione è stato per me un onore.
Ringrazio poi tutti i componenti del Laboratorio di Geotecnica “Giuseppe
Sorbino” per la loro professionalità, disponibilità e simpatia: a partire dal Prof. Leonardo Cascini, il Prof. Ferlisi, Dario e Sabatino e senza dimenticare i
tecnici: il sempre disponibile Vito e il “colonnello” Mauro.
Ringrazio tutto il gruppo del Norwegian Geotechnical Institute di Oslo, in particolare José, per avermi concesso l’opportunità di vivere un’indimenticabile esperienza di vita e di ricerca.
Un ringraziamento speciale va a tutti gli assegnisti e i dottorandi che hanno condiviso con me negli anni questa esperienza, partendo ovviamente da
Pooyan, con il quale ho iniziato questo percorso tre anni fa tra lamenti,
arrabbiature, discorsi incomprensibili in un mix di inglese, italiano e persiano ma anche tra risate, divertimento e soprattutto con sincera e profonda amicizia. Conserverò sempre un ricordo felice di questi anni trascorsi insieme, “fratello”.
Saluto e ringrazio per i consigli ricevuti nei primi mesi di questo percorso
Ilaria, Luca e Vittoria, che stanno vivendo nuove ed entusiasmanti
esperienze.
Un ringraziamento particolare va ai ragazzi che hanno dovuto sopportarmi nei travagliati mesi trascorsi a scrivere questa Tesi:
Gianfranco e Mariagiovanna, per i preziosi consigli e suggerimenti che solo
chi ha già vissuto questa esperienza può dare e per le distrazioni dalla scrittura della Tesi durante le pause caffè.
Antonio, per le tante perle di saggezza che hai dispensato in questi anni e
non solo) che mi hanno permesso di vivere con più leggerezza questo percorso.
Maria Grazia e Maria Rosaria, per l’allegria, la spensieratezza e la
spontaneità che avete portato nel laboratorio e che compensano in parte il “pessimismo cosmico” di qualcun altro.
Maria “Lella” per l’esuberanza e l’ottimismo che ti contraddistinguono, per
il tuo stile unico e inimitabile (per fortuna…) e per le tante volte in cui ti sei offerta (più o meno volontariamente) di ospitarmi per il pranzo sulla tua scrivania.
Angela, per la capacità di sintesi nei discorsi e per aver portato un po’ di
originalità nella stanza dottorandi tra tutte queste Marie.
A voi tutti, amici prima che colleghi auguro le migliori soddisfazioni sia personali che professionali.
Last but not least, desidero ringraziare la mia Famiglia, mio padre Egidio, mia madre Rosa e i miei fratelli Fausto e Daniele. A voi dedico questo elaborato finale con infinito affetto e con immensa gratitudine.
Un grazie a tutti, di cuore.
ABOUT THE AUTHOR
Gaetano Pecoraro graduated with 110/110 cum laude in Environmental and Territorial Engineering at the University of Salerno, Italy in December 2013 with a thesis on the definition and use of a landslide inventory for susceptibility and hazard analyses at regional scale. In 2015 he won a PhD scholarship at the same University to deal with the study of landslide early warning systems for weather-induced landslides. As a part of his PhD, he had the opportunity to spend a research period at the Norwegian Geotechnical Institute (NGI) in Oslo, Norway, where he collected widespread monitoring data and local observations to be employed for analyses on early warning scenarios. During his PhD, he developed innovative methodologies for the definition of warning models for weather-induced landslides. Some of the results obtained in this PhD thesis have been presented in National and International conferences and published in international scientific journals.
Gaetano Pecoraro si è laureato con 110/110 e lode in Ingegneria Civile per l’Ambiente ed il Territorio presso l’Università degli Studi di Salerno, Italia nel Dicembre 2013 con una tesi sulla definizione e l’utilizzo di un inventario di fenomeni franosi per analisi di suscettibilità e pericolosità a scala regionale. Nel 2015 ha vinto una borsa di dottorato presso la stessa Università finalizzata allo studio di sistemi di allerta per frane meteo-indotte. Nell’ambito del Dottorato di Ricerca, ha avuto l’opportunità di svolgere un periodo di ricerca presso il Norwegian Geotechnical Institute (NGI) ad Oslo in Norvegia, dove ha raccolto dati da monitoraggio diffuso e osservazioni locali per analisi su scenari di allerta. Nel corso del Dottorato di ricerca, ha sviluppato metodologie innovative per la definizione di modelli di allerta per frane meteo-indotte. Alcuni dei risultati ottenuti in questa Tesi di dottorato sono stati presentati in conferenze nazionali e internazionali e pubblicati in riviste scientifiche internazionali.
1 INTRODUCTION
Problem statement
Weather-induced landslides are widespread and destructive natural phenomena occurring all around the world that may cause severe human and economic losses. The continuous urbanization process in landslide prone areas and the increasing number of extreme atmospheric phenomena have drastically raised, worldwide, the exposure of people affected by weather-induced landslides. Landslide risk can be reduced by adopting different mitigation methods, such as: active measures reducing the probability of occurrence of landslides, engineering works decreasing the vulnerability of the elements at risk, and non-structural actions. Among the latter, landslide early warning systems (LEWS) certainly constitute a significant option available to the authorities in charge of risk management and governance. LEWS aim at reducing the loss-of-life probability and other adverse consequences from landslide events by informing individuals, communities, and organizations threatened by landslides to prepare and to act appropriately and in sufficient time to reduce the possibility of harm or loss (UNISDR 2006). LEWS have been recognized as important tools for landslide risk reduction and community resilience in many recent international initiatives (e.g., Sendai Framework for Disaster Risk Reduction 2015-2030, UN Agenda 2030 for sustainable development, European Climate Adaptation Platform). Therefore, in recent years scientists, governmental agencies and NGOs have shown an increasing interest in LEWS.
LEWS can be designed and employed at two different reference scales (e.g., Thiebes et al. 2012; Calvello 2017). Systems addressing single landslides at slope scale can be referred to as local systems (Lo-LEWS). Systems dealing with multiple landslides over wide areas at regional scale can be referred to as territorial systems (Te-LEWS), i.e., they can be employed over a basin, a municipality, a region, or a nation (Piciullo et al. 2018).
Many literature contributions describe LEWS operational at both local and regional scale dealing with weather-induced landslides. Yet, standard
requirements for the definition of an efficient LEWS still do not exist, thus crucial aspects may be neglected by systems developers and managers. The efficiency of LEWS strongly depends on the monitoring strategies adopted and the method developed for the definition of the warning model. Indeed, monitoring strategies play a central role, both in the design and in the operational phase of a LEWS, as suitable parameters to monitor must be identified and the most appropriate monitoring instruments need to be selected according to a set of criteria, such as simplicity, robustness, reliability, and cost. Another crucial issue is the definition of an appropriate warning methodology that considers the quantity and the quality of the input data and the expected outputs of the model.
Objectives
This PhD thesis aims at defining and testing original methodologies for improving the performance of warning models employed within LEWS for weather-induced landslides.
In the following, the main research questions and the respective objectives are summarized.
How to improve quantity and quality of landslide data?
• Definition and population of a landslide inventory from online news
• Analyses on landslide occurrences at regional scale
How to best incorporate remote sensing data into current land-based monitoring networks?
• Collection of meteorological monitoring data from satellite observations
• Analysis of remote sensing data at regional scale
• Integration between widespread meteorological monitoring data and local observations
How to define rainfall thresholds in an objective and reproducible way?
• Definition of probabilistic thresholds for landslide occurrence • Development and implementation of a probabilistic warning
model
How can local observations be profitably used within warning models implemented at regional scale?
• Identification of the most appropriate parameters to be monitored at local scale in relation to the types of landslide under surveillance
• Development and implementation of a multi-scalar warning model
Thesis Outline
Chapter 2 presents the main characteristics of the landslide phenomena addressed herein, their possible consequences in terms of human and economic losses, and the mitigation measures available for landslide risk management. Regarding non-structural options, LEWS are introduced by describing their structure and by summarizing the findings of literature contributions on Lo-LEWS and Te-LEWS operational all around the world. Concerning Lo-LEWS, the information refers to 29 systems for which the main characteristics are analyzed considering three main modules: landslide model, warning model, and warning system (Pecoraro et al. 2018). Information on Te-LEWS are derived from three recent literature reviews reporting 24 Te-LEWS operational worldwide for rainfall-induced landslides (Piciullo et al. 2018), 21 regional LEWS operational in Italy (Pecoraro and Calvello 2016), and rainfall thresholds employed within 45 Te-LEWS operational worldwide (Segoni et al. 2018a).
In Chapter 3 the monitoring strategies adopted within the reviewed Lo-LEWS and the Te-Lo-LEWS are discussed and analyzed in terms of monitored parameters and monitoring instruments. Moreover, the main characteristics of the warning models employed within the Te-LEWS are also reported. These analyses allow highlighting some relevant aspects that need to be taken into account in order to improve the efficiency of LEWS: the definition of objective and reproducible warning models; the availability of reliable landslide records and monitoring data; the integration of local geotechnical observations within warning models. Chapter 4 introduces a framework highlighting the steps necessary for the definition of a warning model for weather-induced landslides: collection of the input data; delimitation of the warning zones; identification of the landslide events; selection of the warning parameters; spatial-temporal correlation between landslide events and weather events; calibration and validation of the warning model. Following this framework, two original methodologies are proposed for the definition of warning models for weather-induced landslides: a probabilistic warning model, developed by applying a Bayesian approach to determine the conditional probability of landslide occurrence; and a multi-scalar warning model, integrating
widespread meteorological monitoring data and geotechnical observations collected at local scale.
In Chapter 5 the probabilistic warning model is tested in two Italian regions, Emilia-Romagna and Campania, adopting as territorial units the weather warning zones defined by the two regional civil protection agencies. Data on landslide occurrences are derived from the “FraneItalia” catalog, a landslide inventory based on information retrieved from online Italian news (Calvello and Pecoraro 2018). Rainfall measurements are derived from the satellite-based NASA Global Precipitation Measurement (GPM) database, and are elaborated through Google Earth Engine, a cloud-platform for planetary-scale environmental data analysis. Triggering and non-triggering rainfall events are differentiated considering the spatial-temporal distribution of landslide events within each territorial unit. A Bayesian framework is applied to determine the probability of landslide occurrence associated to each combination of rainfall parameters and to define the warning levels within the model. The two probabilistic models are validated using two different validation procedures.
In Chapter 6, the multi-scalar warning model is applied considering 30 Norwegian hydrogeological basins starting from the nationwide Te-LEWS currently operational in Norway. These territorial units have been identified considering information available at national scale according to two selection criteria. The warning events issued by the national system, which only takes into account gridded monitoring data (i.e., rainfall and normalized values of water supply and soil water content), are assessed considering trends of local pore water pressure observations. The warning model is defined looking at the results of parametric analyses so as to identify the best-performing parameters to be employed. The multi-scalar warning model is finally validated employing statistical performance indicators.
Finally, in Chapter 7 the results achieved are discussed and analyzed in order to evaluate the potential of the proposed methodologies in improving the performance of warning models for weather-induced landslides.
2 EWS
FOR
WEATHER-INDUCED
LANDSLIDES
Weather-induced landslides are widespread phenomena, representing a significant risk for people, structures and infrastructures in many parts of the world. Such a diffuse risk cannot be mitigated only by means of structural measures, thus landslide early warning systems (LEWS) are being increasingly applied as non-structural risk mitigation measures. Section 2.1 introduces the main features and the possible consequences of the weather-induced landslides, also reporting the structural and non-structural risk mitigation measures. Section 2.2 focuses on landslides early warning systems, presenting their main structure and differentiating between local systems (Lo-LEWS) and territorial systems (Te-LEWS). Section 2.3 presents a literature review on Lo-LEWS and an analysis of their main characteristics considering three main modules: landslide model, warning model, and warning system. Finally, Section 2.4 summarizes information on Te-LEWS gathered from three recent literature contributions: Piciullo et al. (2018) described and analysed the main characteristics of territorial LEWS operational worldwide; Pecoraro and Calvello (2016) presented a review on regional LEWS for weather-induced landslides in Italy; Segoni et al. (2018a) investigated the procedures for defining rainfall thresholds for landslide occurrence.
2.1 W
EATHER-
INDUCED LANDSLIDES2.1.1 Types of landslides and possible consequences
According to Cruden (1991), a landslide can be defined as “a movement of a
mass of rock, debris or earth down a slope” activated or triggered by causes that
can be either external or internal. However, the generic term “landslide” includes a variety of different phenomena, which are not perfectly repeatable, thus it is not possible to develop a taxonomic classification.
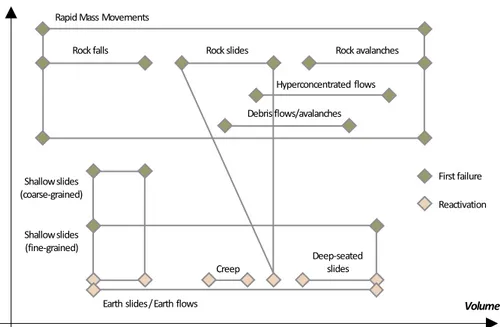
Therefore, since the early decades of the last century several classification schemes considering several discriminating factors have been proposed (e.g., Skempton 1953; Varnes 1958; Blong 1973; Varnes 1978; Hutchinson 1988: Cruden and Varnes 1996; Leroueil et al. 1996; Hungr et al. 2001: and Hungr et al. 2014). For instance, the classification proposed by Varnes (1978) distinguishes among three types of materials (i.e., rock, debris, and earth) and five types of movements (i.e., fall, topple, slide, lateral spread, and flow). An additional class (i.e., the complex movements) is introduced by the author in order to define any combination of more than one movement. Cruden and Varnes (1996) allows differentiating between slow- and fast-moving landslides on the basis of seven velocity classes, each of them associated to a probable destructive significance. Hungr et al. (2014) state that simple term assigned to a landslide type (or a specific case) should reflect the particular focus of the researcher. Following this approach, Calvello (2017) proposes that for early warning purposes a landslide should be classified on the basis of its propagation phase and taking into account four main characteristics: i) type of movement and material, ii) activity phase, iii) velocity, and iv) volume (Figure 2.1).
Figure 2.1 Example of landslide classification scheme for early warning purposes proposed by Calvello (2017)
Rapid Mass Movements
Earth slides / Earth flows
Rock slides Rock avalanches
Hyperconcentrated flows Debris flows/avalanches Shallow slides (coarse-grained) Creep Shallow slides (fine-grained) Deep-seated slides Rock falls First failure Reactivation Velocity Volume
This thesis addresses weather-induced landslides occurring in shallow soil layers as first failure phenomena. They comprise a wide range of slope movements of limited size that mainly develop in soil layers up to a maximum of a few meters, such as shallow slides, debris slides, debris flows, debris avalanches, and hyperconcentrated flows. The main triggering mechanism for these landslides typically consists of rain or snow infiltration in shallow soil layers, resulting in an increase of the pore water pressure and a decrease of the soil shear strength (Caine 1980), as well as in the loss of the apparent cohesion in partially saturated soils (Fredlund 1987). The triggering process is characterized by a nearly totally absence of warning signs. Although the triggering volume is often limited, the landslide mass may incorporate the soil material lying along the slope in the propagation phase, increasing significantly the volume. Moreover, in steep channels shallow slides may evolve into debris flows, destructive phenomena characterized by extremely high velocities (Hungr et al. 2014). Shallow weather-induced landslides can occur frequently and often simultaneously over large areas, thus they represent a widespread risk for local communities, structures, and infrastructures in many parts of the world (Calvello 2017). Recently, several different global databases (e.g., the EM-DAT International Disaster Database, the NASA Global Landslide Catalogue, and the Global Fatal Landslide Database) provided data on the societal impact of these landslides. However, information is generally related to all type of landslides and global databases generally underestimate the landslides impact on society, as landslide events are often incorporated in other major climate-related natural disasters (Petley 2012; Kirschbaum et al. 2015). Nevertheless, their analysis allows some general considerations on human and economic losses of weather-induced landslides, their spatial distribution and possible future trends. For instance, the EM-DAT database suggested that weather-induced landslides account for 5.2% of natural climate-related disaster events, resulting in 18,418 deaths and about 8 billion EUR of economic losses (Guha-Sapir et al. 2018). Moreover, Froude and Petley (2018) demonstrated that the majority of the 4862 fatal landslide events reported in the Global Fatal Landslide Database between 2004 and 2016 were triggered by rainfall or snowmelt (79%) and were mainly concentrated in: Central America, the Caribbean islands, Andes mountains, East Africa, the Himalayan Arc, China, and the European Alps. Finally, Haque et al. (2016) reported that 1.3 to 3.6 million Europeans live in landslide prone areas and 8000 to 20,000 km of roads and railways are highly exposed to landslides.
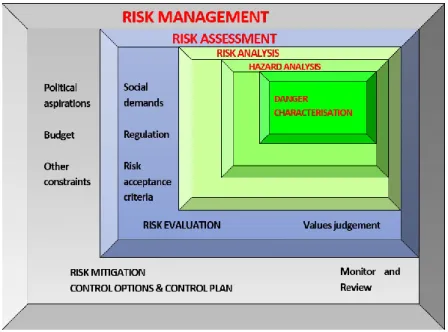
2.1.2 Structural and non-structural risk mitigation measures The awareness of the possible catastrophic consequences of landslides, in terms of victims and social-economic impacts, led the technical and scientific community to the adoption of a rigorous approach aimed at an efficient and effective prevention, mitigation and control of landslide risk. To this aim, Fell et al. (2005) proposed an integrated logical framework for landslide risk management, including three phases: risk analysis, risk assessment, and risk management (Figure 2.2).
Figure 2.2 Schematic representation of the integrated risk management process proposed by Fell et al. (2005)
Within this framework, risk analysis represents the basic level of risk management process and it is essentially aimed at the estimation of the current or potential level of risk in a specific area affected by a given landslide phenomenon. Risk analysis generally contains the following steps: definition of scope, danger (threat) identification, estimation of probability of occurrence to estimate hazard, evaluation of the vulnerability of the element(s) at risk, consequence identification, and risk estimation.
In general terms, landslide risk (R) can be expressed through the widely accepted formula of Varnes (1984):
𝑅 = 𝐻 × 𝐸𝑅× 𝑉 (2.1)
where: H (hazard) is the probability that a particular landslide phenomenon occurs within a certain area in a given period of time; ER (elements at risk) are people, building, engineering works, infrastructures, environmental features and economic activities in the area affected by a landslide; V (vulnerability) is the degree of loss to a given element or a set of elements within the area affected by a landslide, expressed on a scale from 0 (no loss) to 1 (total loss).
Risk assessment is the process of making a decision or recommendation on whether existing risks are tolerable and present risk control measures are adequate, and if not, whether alternative risk control measures are justified or will be implemented. To this aim, the outputs from the risk analysis are compared against values judgements and risk tolerance criteria determined taking account of political, legal, environmental, regulatory and societal factors.
Finally, risk management represents the systematic application of management policies, procedures and practices in order to identify, analyze, assess, and in case mitigate and monitor landslide risk. The risk management process is iterative, requiring consideration of the risk mitigation options and the results of the implementation of the mitigation measures and of the monitoring.
According to UNISDR (2006), mitigation measures can be classified into two main groups: structural measures (i.e., any physical construction to reduce or avoid possible impacts of landslides, or the application of engineering techniques or technology to achieve landslide resistance and resilience in structures or systems) and non-structural measures (i.e., mitigation strategies not involving physical construction which use knowledge, practice or agreement to reduce disaster risks and impacts, in particular through policies and laws, public awareness raising, training and education).
Following equation (2.1), structural measures mainly address either hazard (e.g., reduction of the general slope angle, modification of geometry and/or mass distribution, surface drains) or vulnerability (e.g., diversion channels, re-modelling of the slope, planting and vegetation of the slope, catch trenches). Conversely, non-structural measures usually address
elements at risk (e.g., land-use planning, early warning, public preparedness).
Within these frameworks, landslide early warning systems (LEWS) may be considered a non-structural passive mitigation option to be employed in areas where risk, occasionally, rises above defined acceptability levels (Calvello 2017).
2.2 L
ANDSLIDE EARLY WARNING SYSTEMS 2.2.1 Structure and main modulesLEWS are being increasingly applied worldwide, mainly because of: their lower economic costs and environmental impact compared to structural measures (e.g., Intrieri et al. 2012; Thiebes and Glade 2016); the continuous development of new technologies for landslide monitoring (e.g., Chae et al. 2017; Crosta et al. 2017); and increasing availability of reliable databases to calibrate the warning models (e.g., Haque et al. 2016; Calvello and Pecoraro 2018). LEWS aim at reducing the loss-of-life probability and other adverse consequences from landslide events by informing individuals, communities, and organizations threatened by landslides to prepare and to act appropriately and in sufficient time to reduce the possibility of harm or loss (UNISDR 2006).
The types of landslides and the mechanisms responsible of their occurrence or reactivation, as well as the early warning conditions that might be detected before a paroxysmal phase of movements, vary widely depending on the geo-environmental context. Therefore, it is necessary for managers of LEWS to adapt the design of the systems to the particular conditions at the locations where these systems will be operational. To this aim a certain degree of flexibility is required during the implementation, while at the same time universal standards should be defined so that uniformity in the development of such systems and improvement of community resilience in landslide prone areas can be obtained.
In 2006 UNISDR defined a simple list of the main elements and actions that national governments or community organizations can refer to when developing or evaluating people-oriented early warning systems for natural hazards. The checklist is structured around four key components: i) risk
knowledge, i.e., systematic assessment of hazards and vulnerabilities; ii) monitoring and warning service, i.e., accurate and timely forecasting of hazards using reliable, scientific methods and technologies; iii) dissemination and communication, i.e., clear and timely distribution of warnings to all those at risk; iv) response capability, i.e., national and local capacities and knowledge to act correctly when warnings are communicated. Di Biagio and Kjekstad (2007) focus on EWS for landslides and introduce a block diagram describing the four main activities that should be implemented in: monitoring, analysis of data and forecasting, warning and response. The framework proposed by Sassa et al. (2009) in the context of the project “Early Warning of Landslide” is divided into three main flows. The central flow contains the monitoring of triggering factors and the development of landslide risk maps and early warning technologies. The left flow represents an aspect of technology for site and time prediction of landslides. Finally, the right flow refers to the social aspects, including the risk communication and the evacuation systems. Intrieri et al. (2013) point out that an EWS may suffer from the imbalance among their components; for instance, often some of them may lack in the social/communication aspects. The authors describe landslide EWS as the balanced combination of four main activities: design, monitoring, forecasting and education. Recently, the scheme proposed by Piciullo et al. (2018) identifies the main components necessary to design a territorial EWS for rainfall-induced landslides, highlighting the importance of both technical and social aspects. For this purpose, the conceptual model is organized as a jigsaw puzzle, based on four main modules of the warning system: i) setting, ii) correlation law, iii) decisional algorithm, and iv) warning management.
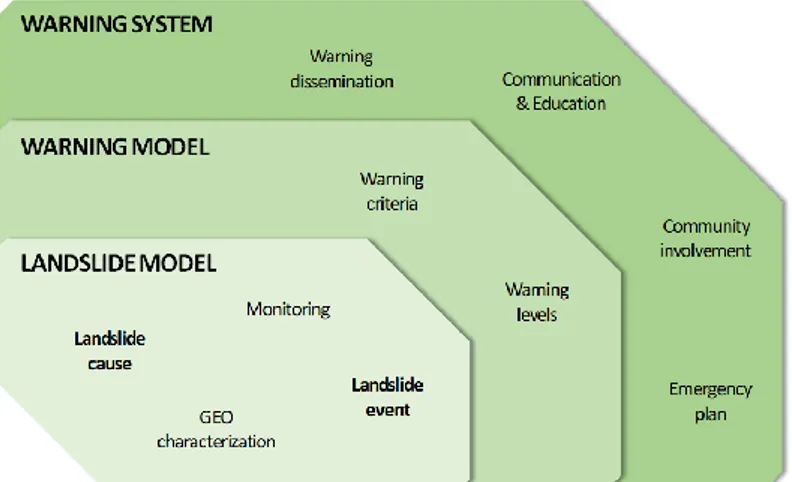
Although the proposed schemes and the described elements correctly represent LEWS, a more detailed and representative conceptual model for LEWS is herein provided. For this purpose, Figure 2.3 introduces a scheme modified from a similar framework developed by Calvello (2017) for weather-induced landslides. The proposed layout clearly differentiates among three main modules: landslide model, warning model and warning system. Within this framework, a landslide model is one the components of a warning model and the latter is one of the components of an early warning system. A landslide model may be described as a functional relationship between landslide causes (e.g., weather, geomorphological, anthropic) and landslide events, taking into account the geological, geomorphological and hydrogeological features of the slope and the data
provided by monitoring instruments. A warning model includes the landslide model as well as warning criteria and warning levels. Warning criteria are represented by the decision-making procedures necessary for issuing the warnings and for establishing a connection between the outputs of the landslide model to a set of warning levels. Each warning level is associated to the state of activity of the landslide, to the possible consequences and, of course, to the expected actions from the actors involved (e.g., EW managers, politicians, scientist, stakeholders, citizens). The number of levels adopted by the model can vary from a minimum of two⎯i.e., warning, no warning⎯to five or more. Finally, a warning model is part of a warning system, whose other four components are: warning dissemination, communication and education, community involvement and an emergency plan. On this issue, it is important to stress the role of the community and the social aspects in general, at times neglected by technicians, but still essential, as well as other components, for LEWS to be effective.
Figure 2.3 Framework identifying the main modules of landslide early warning systems (modified from Calvello 2017)
2.2.2 The scale of analysis
LEWS can be designed and employed at two different reference scales (e.g., Thiebes et al. 2012; Calvello and Piciullo 2016). Systems addressing single landslides at slope scale can be named as local (Lo-LEWS). Systems dealing with multiple landslides over wide areas at regional scale are
referred to as territorial systems (Te-LEWS), i.e., they can be employed over a basin, a municipality, a region, or a nation (Piciullo et al. 2018). The main aim of Lo-LEWS is the temporary evacuation of people from areas where, at specific times, the risk level to which they are exposed is considered to be intolerably high. They typically implement a network of instruments to monitor the parameters most relevant for early warning purposes, considering predisposing and triggering factors. Their design and operation are strongly influenced by numerous constraints and factors, from time to time different, depending on the characteristics (e.g., size, possible precursors, potential velocity) of the landslide under surveillance.
On the other hand, Te-LEWS are used to provide generalized warnings to authorities, civil protection personnel and the population over appropriately-defined homogeneous warning zones of relevant extension. Typically, these systems address weather-induced landslides through the monitoring and prediction of meteorological parameters.
A key difference between local and territorial LEWS is represented by the definition of a “landslide event”. Regarding local LEWS, a landslide event may be represented either by: a single active or dormant phenomenon; a potential slope instability, due to a first failure of a soil or rock mass. Differently, for territorial LEWS a landslide event may be defined as a series of landslides grouped on the basis of their characteristics, so as to implicitly evaluate the numerosity of a set of multiple phenomena occurring in a given area within a given time period.
The scale of analysis of a LEWS also inevitably influences the stakeholders involved as well as most of its operational characteristics, including: the model adopted to characterize a landslide event; the criteria to issue the warnings and their meaning; the lead time; the tools used to disseminate the warnings; the definition of the emergency plan.
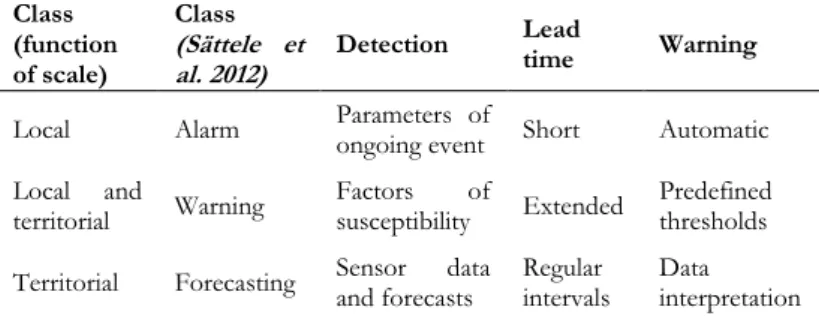
Recently, Sättele et al. (2012) and Stähli et al. (2015) distinguished among three classes of EWS for natural hazards: i) alarm systems, detecting process parameters of a phenomena already in progress; ii) warning systems, monitoring triggering factors before the beginning of a landslide event; and iii) forecasting systems, predicting the level of danger of a landslide process. According to the authors, they can be differentiated considering: the area under surveillance, the lead time, the parameter monitored, the number of warning levels, and the degree of automation. Calvello (2017) presented a scheme combining the two categories of
LEWS defined on the basis of their scale of analysis with the classification proposed by Sättele et al. (2012) and Stähli et al. (2015). Local LEWS are indeed typically implemented as either alarm or warning systems; whereas territorial LEWSs are generally used as either warning or forecasting systems (Table 2.1).
Table 2.1 Local and territorial LEWS function of detection factors, lead time and warning characteristics (Calvello 2017)
Class (function of scale) Class (Sättele et al. 2012) Detection Lead time Warning
Local Alarm Parameters of ongoing event Short Automatic Local and
territorial Warning Factors susceptibility of Extended Predefined thresholds Territorial Forecasting Sensor and forecasts data Regular intervals Data interpretation
Many LEWS operational all around the world and reported in the scientific literature deal with weather-induced landslides. Comprehensive reviews of systems operational at both local and regional scale are presented in Sections 2.3 and 2.4, respectively.
2.3 R
EVIEW ON LOCAL LANDSLIDE EARLY WARNING SYSTEMS(based on Pecoraro et al. 2018)
2.3.1 Location, period, and state of activity
Figure 2.4 presents a summary of the location and the period of activity of 29 Lo-LEWS operational all around the world. The majority of them (22) are currently active both as prototypes (4) and as operational systems (18). On the other hand, in five cases prototype systems were designed at operating for relatively limited periods of time: Nojiri River basin, Japan
(AS_1991_P); Moscardo catchment, Italy (EU_1995_P); Wollongong, Australia (OC_2005_P); Banjarnegara, Indonesia (AS_2007_P); and Swabian Alb, Germany (EU_2007c_P). Only two of the operational systems described herein are no longer active: Xintan Town, China (AS_1977_N) and North Vancouver, Canada (NA_2009_N). Among the 29 Lo-LEWS reported herein, only few applications have been gathered before the 2000s.
Figure 2.4 Local landslide early warning systems: a) national distribution; b) location and period of activity (Pecoraro et al. 2018)
The oldest system was designed in Xintan Town, China (AS_1977_N) in 1977 for addressing a large rock avalanche on the northern bank of the