Harmonic and supercontinuum generation in
quadratic and cubic nonlinear optical media
S. Wabnitz*and V. V. Kozlov
Dipartimento di Ingegneria dell’Informazione, Università di Brescia, Via Branze 38, 25123 Brescia, Italy
*Corresponding author: [email protected] Received April 14, 2010; revised July 9, 2010; accepted July 13, 2010;
posted July 13, 2010 (Doc. ID 127036); published August 5, 2010
We present numerical simulations by means of the generalized nonlinear envelope equation of harmonic and supercontinuum generation induced by femtosecond pump pulses in optical media with both quadratic and third-order nonlinearities. Application examples to higher harmonic generation in periodically poled lithium niobate and optical parametric generation of a mid-infrared continuum in gallium arsenide are discussed.
© 2010 Optical Society of America
OCIS codes: 190.2620, 190.5530, 190.7110, 320.6629, 190.4410.
1. INTRODUCTION
In recent years there has been a great deal of interest in
research on high-order harmonic generation (HHG) [1]
and supercontinuum (SC) [2] in nonlinear optical media
for the control of light fields on time scales of the order of the optical carrier period. In particular, it has been shown that the generalized nonlinear envelope equation (GNEE)
approach [3–5] is capable of modeling the sub-cycle
dy-namics in cubic nonlinear media with an accuracy which is comparable to the direct solution of Maxwell’s
equa-tions [6]. In recent years efficient HHG has been
pre-dicted to occur in quadratic nonlinear media by means of
numerical simulations [7], whereas SC [8–10] has been
experimentally observed in both quadratic and cubic non-linear media. However, theoretical modeling of these SC experiments has not yet been performed. Therefore inter-esting questions remain to be answered, for example, to which extent the observed SC generation is due to the quadratic or to the cubic (possibly through cascading ef-fects) contributions to the nonlinear response of the ma-terial.
In this work we perform such a modeling based on the
extension of the GNEE approach of Genty et al. [3] to the
case of a non-centrosymmetric nonlinear medium with both second- and third-order contributions to the nonlin-ear polarization. This approach enables us to carry out numerical simulations that describe optical parametric
amplification [11] or quasi-phase-matched second
har-monic generation (SHG) in periodically poled crystals
[12,13] by means of a single equation for the total field
en-velope. Note that these well-known phenomena have been previously described in terms of separate equations for each of the interacting fields.
In Section 2 of this paper we present the theoretical derivation from the scalar wave equation of the GNEE equation for the field envelope (containing in principle ar-bitrarily fast temporal variations) subject to the effects of linear dispersion as well as both quadratic and cubic con-tributions to the nonlinear polarization. In Section 3 we
validate the GNEE approach in the presence of a qua-dratic nonlinearity only and in the absence of linear dis-persion, by comparing its solution with the direct solution of Maxwell’s equations by means of the so-called
pseu-dospectral spatial domain (PSSD) method [5]. We have
considered here the rather extreme situation of a single cycle pulse. Finally, in Section 4 we present different ex-amples of practical applications of the GNEE approach to describe frequency generation based on quasi-phase-matching (QPM), whereby phase-quasi-phase-matching between the fundamental harmonic and the second harmonic (SH) is obtained by periodically poling the second-order
nonlin-ear susceptibility [12,13]. First, we simulated higher
har-monic and SC generation in periodically poled lithium
niobate (PPLN) [9]. Next, we modeled the generation by
optical parametric mixing of a mid-infrared (MIR)
con-tinuum in orientation-patterned gallium arsenide [10].
2. EQUATIONS
Let us consider the propagation of linearly polarized ul-trashort pulses in a nonlinear medium exhibiting both quadratic and cubic nonlinearities, i.e., the total
nonlin-ear polarization can be written as PNL= PNL共2兲+ PNL共3兲
=0共共2兲E2+共3兲E3兲. In the frequency domain, the scalar
wave equation reads as
关z 2+ k2共兲兴E˜ 共z,兲 = − 02P˜NL共z,兲, 共1兲 where k2共兲 = 共兲2/c2, E˜ 共z,兲 =
冕
−⬁ +⬁ E共z,t兲exp共it兲dt, P˜NL共z,兲 =冕
−⬁ +⬁ PNL共z,t兲exp共it兲dt,共兲 = 共n共兲 + i␣共兲c/2兲2,
n is the refractive index, and ␣ is the linear loss coeffi-cient. By using analytical methods such as the Green’s
function approach [14], one may transform Eq.(1)in the
two coupled (via nonlinearity) first-order equations,
关z⫿ ik共兲兴E˜±共z,兲 = ± i0
2
2k共兲P
˜
NL共z,兲, 共2兲
for the forward, E˜+共z,兲, and backward, E˜−共z,兲,
propa-gating components of the field E˜ 共z,兲⬅E˜+共z,兲+E˜−共z,兲.
Whenever the nonlinear polarization represents a rela-tively weak perturbation to the linear dielectric suscepti-bility, it is possible to neglect the coupling between
counter-propagating waves [15–17]. This means that we
may separately consider the first of Eqs.(2)that describes
the evolution of the forward field component alone. By
ex-pressing this field as E共z,t兲⬅共A共z,t兲exp共−i0t兲+c.c.兲/2
(dropping for simplicity the plus index), where 0 and
A共z,t兲 are an arbitrary carrier frequency and an envelope
function, one obtains
关z− ik共兲兴A˜共z,兲 = i0 2 2k共兲p˜NL共z,,A˜兲, 共3兲 where A ˜ 共z,兲 =
冕
−⬁ +⬁ A共z,t兲exp兵i共 − 0兲t其dt, p ˜NL共z,兲 =冕
−⬁ +⬁ pNL共z,t兲exp兵i共 − 0兲t其dt, PNL共z,t兲 ⬅ 共pNL共z,t兲exp共− i0t兲 + c.c.兲/2, and pNL= pNL共2兲+ pNL共3兲. Moreover,pNL共2兲共z,t兲 = 0共2兲共2兩A兩+2exp共i0t兲 + A2exp共− i0t兲兲/2,
pNL共3兲共z,t兲 = 0共3兲共3兩A兩2A + A3exp共− 2i0t兲兲/4,
where 兩A兩+2 only contains frequency components with
ⱖ0. Therefore Eq.(3)can be written as
冋
z− i共兲 +␣
2
册
A˜ 共z,兲 = i共兲p˜NL共z,,A˜兲, 共4兲where k共兲=n共兲/c+␣共兲/2⬅共兲+␣共兲/2 and 共兲
⬅/2n共兲c0, and we neglected the contribution of the
loss coefficient␣ with respect to the propagation constant
 in the denominator of the right-hand side of Eq.(4). By
performing a Taylor expansion of and around a carrier
frequency0, one may transform Eq.(4) in the time
do-main and obtain the GNEE for the evolution of A共z,t兲,
冋
z− D +␣
2
册
A共z,t兲 = NpNL共z,t,A兲, 共5兲where the dispersion operator D is formally written as
D =
兺
mⱖ0 im+1 m!冉
m m冊
=0 m tm,and the nonlinearity operator N is
N =
兺
mⱖ0 im+1 m!冉
m m冊
=0 m tm,where the series is typically truncated to the first-order term so that
N⬵ i0共1 + ish /t兲,
where0⬅0/ 2n0c0, n0= n共0兲, and
sh⬅ 1/0−兵关ln共n共兲兲兴/其=0.
Equation (5) may be easily numerically solved by
means of the standard split-step Fourier method, where the action of the dispersive step is computed as a phase shift in the frequency domain, and the nonlinear step is computed by a simple integration in the time domain. The strengths of the second- and third-order nonlinearities
are typically measured in terms of deff=共2兲/ 2 and the
nonlinear refractive index n2= 3共3兲/ 8n0, respectively.
3. MODEL VALIDATION
In order to verify the accuracy of the GNEE(5), we
com-pared its solution with the direct PSSD integration of
Maxwell’s equations [5]. For the sake of simplicity, we
ne-glect dispersion and set P⬅PNL共2兲=0共2兲E2, with共2兲= 0.02.
We consider the initial 1 cycle pulse E共z=0,t兲
= cos共pt兲sech共0.3pt兲 (with, e.g., p= 2c/p= 830 nm).
Figure 1(a) compares the PSSD (solid curves) and
GNEE (empty dots) solutions for the electric field after
6m, which indeed agrees with the prediction of Eq.(2)
of [7]: this point corresponds to a carrier wave shock
[6,18,19], i.e., a vertical trailing edge for the central
car-rier oscillation; whereas Fig.1(b)compares the associated
spectral intensities showing HHG (of the carrier
fre-quency p). As can be seen, there is a relatively good
agreement between the solution of the GNEE(5)and the
PSSD simulations. In all GNEE simulations, we only
used n = 211sampling points in the physical spectral
win-dow, compared with at least 214data points for the PSSD
−20 −10 0 10 20 −1 0 1 Time (fs) Electric Field (a.u.) 0 1 2 3 4 5 Frequencyω/ωp Spectral Amplitude (10 dB/div.) PSSD GNEE (a) (b)
Fig. 1. Carrier wave shock induced by共2兲: comparison of PSSD (solid curves) and GNEE (empty dots) solutions for (a) the elec-tric field and (b) the spectral amplitude of 1 cycle pulse at 830 nm at the carrier wave shock point as predicted by Eq.(2)of [7].
runs. For better numerical stability with a quadratic non-linearity, we applied Oszag’s 2/3 rule by padding with n / 3 zeros the upper and lower parts of the spectral range. The
GNEE simulation in Fig.1only took 100 s when running
MATLAB on a laptop personal computer. Clearly, a main advantage of the GNEE approach is that it permits one to include in a straightforward manner the
frequency-dependent linear propagation constant共兲 in the
model-ing of short pulse propagation.
4. APPLICATION EXAMPLES
As examples of practical application of the single-equation description of wave propagation in quadratic and cubic nonlinear materials which is provided by the
GNEE (5), let us consider in this section the two main
parametric mixing processes leading to either frequency doubling or frequency-difference generation in quasi-phase-matched crystals. Indeed, recent experiments by
Langrock et al. [9] demonstrated dramatic SHG and HHG
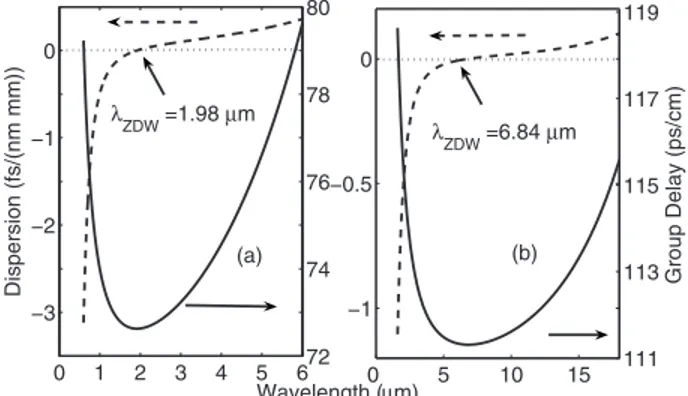
in PPLN. Figure2(a) shows the wavelength dependence
of both the group delay and the group velocity dispersion D for light propagating along the extraordinary axis in
LiNbO3[20]. In the solution of Eq.(5), we used a
square-wave spatial modulation of the second-order nonlinear
co-efficient from +deff to −deffwith a QPM period D, where
deff= 25.2 pm/ V and n2= 5.3⫻10−15cm2W−1, and we
com-pared the propagation of a 32 fs 2 GW/ cm2pump pulse at
either 2.4m (Fig.3) or 1.58m (Figs.4and5).
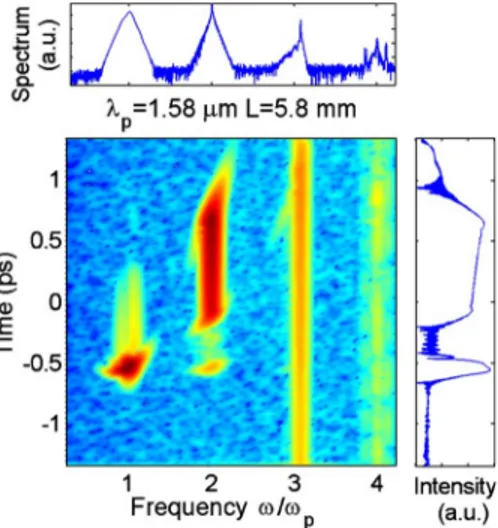
Figure3 illustrates the spectrogram, the amplitude of
the field envelope, and the spectral intensity profile gen-erated after 5.8 mm of PPLN from the input 4 cycle pulse
at 2.4m, where the QPM period of D=34.5 m was
ob-tained from the dispersion curve in Fig.2. The
spectro-gram in Fig.3reveals the details of the temporal
struc-ture of the HHG process: a few-cycle SH pulse is generated with the same intensity and similar duration as the pump, along with a time-compressed weaker third-harmonic pulse, whereas the fourth third-harmonic presents a continuous-wave radiation peak. The formation of a few-cycle SH pulse is facilitated by the fact that the funda-mental harmonic and the SH are located on opposite sides
of the zero dispersion wavelength ofZDW= 1.98m [see
Fig.2(a)], which leads to the reduced group-velocity
mis-match (GVM)-induced delay of 60 fs/mm. We have
propa-gated the field up to 17.5 mm and observed a total 500 fs temporal walk-off between the fundamental and the SH pulses, which is half the value of that predicted from Fig.
2(a). The discrepancy results from the nonlinear trapping
of the pump and SH pulses over the first 8 mm of propa-gation.
On the other hand, Figs.4and5show that for an input
pump pulse at 1.58m the GVM is so large that no
mu-tual trapping with the SH is possible: as a result, the SH (and third-harmonic) energy is uniformly distributed in
relatively long pulses. In the simulation in Fig. 4 the
pump pulse duration and intensity were the same as in
Fig.3. Moreover, we kept the QPM period unchanged at
34.5m as in Fig.3so that no phase-matching occurs
be-tween the pump and its SH. Still, it is quite remarkable to note that broadband higher harmonic generation is ob-served even for a strongly mismatched situation, albeit with a largely reduced peak efficiency. Clearly (as shown
in Fig. 5) the SHG conversion efficiency is substantially
improved whenever the QPM period is reduced to
−3 −2 −1 0 Dispersion (fs/(nm mm)) Wavelength (µm) 0 1 2 3 4 5 672 74 76 78 80 −1 −0.5 0 0 5 10 15 111 113 115 117 119 Grou p Dela y( p s/cm ) λZDW=1.98µm λZDW=6.84µm (a) (b)
Fig. 2. Plot of dispersion and group delay versus wavelength for propagation along (a) the extraordinary axis of LiNbO3or (b) in
GaAs.
Fig. 3. (Color online) Display of the spectrogram (with a 25 fs gate function), field envelope, and spectral amplitude profiles showing QPM-SHG of a 32 fs 2 GW/ cm2pump pulse at 2.4m
after 5.8 mm of PPLN. The QPM period is 34.5m.
19.9m so that the pump at 1.58 m and its SH wave-length are now phase-matched.
Next we modeled by means of Eq.(5)the recently
ob-served optical parametric generation of a MIR continuum
in orientation-patterned GaAs [10], whose dispersion is
il-lustrated in Fig.2(b)[20]. Figure6shows the MIR SC
ex-tending from 5 to 10m that results from the mixing of a
500 fs 1 GW/ cm2pump pulse centered at 3.31m with a
100 fs 20 MW/ cm2signal pulse at 5.5m, after
propaga-tion through 4 mm of QPM-GaAs with deff= 69 pm/ V, n2
= 1.5⫻10−13cm2W−1 [10], and the QPM period of
163m. As shown in Fig. 2(b), in GaAs the signal at
5.5m and the parametrically generated idler at 9.5 m
are on opposite sides of the zero dispersion wavelength
ZDW= 6 . 84m, and the resulting broadband GVM
matching leads to wideband SC generation.
5. CONCLUSIONS
In conclusion we derived, validated, and provided appli-cation examples of an effective approach based on a single
GNEE describing the evolution of the arbitrarily fast op-tical field envelope. This method enables the efficient nu-merical study of ultrashort pulse propagation and fre-quency conversion in both quadratic and cubic nonlinear optical media.
ACKNOWLEDGMENTS
We acknowledge enlightening discussions with D. Mo-dotto, M. Conforti, B. Kibler, and J. M. Dudley. This work was carried out with support from the Fondazione Cariplo grant No. 2009-2730.
REFERENCES
1. F. Krausz and M. Ivanov, “Attosecond physics,” Rev. Mod. Phys. 81, 163–234 (2009).
2. J. M. Dudley, G. Genty, and S. Coen, “Supercontinuum gen-eration in photonic crystal fiber,” Rev. Mod. Phys. 78, 1135– 1184 (2006).
3. G. Genty, P. Kinsler, B. Kibler, and J. M. Dudley, “Nonlin-ear envelope equation modelling of sub-cycle dynamics and harmonic generation in nonlinear waveguides,” Opt. Ex-press 15, 5382–5387 (2007).
4. G. Genty, B. Kibler, P. Kinsler, and J. M. Dudley, “Har-monic extended supercontinuum generation and carrier en-velope phase dependent spectral broadening in silica nano-wires,” Opt. Express 16, 10886–10893 (2008).
5. P. Kinsler, “Optical pulse propagation with minimal ap-proximations,” Phys. Rev. 81, 013819 (2010).
6. J. C. A. Tyrrell, P. Kinsler, and G. H. C. New, “Pseudospec-tral spatial-domain: a new method for nonlinear pulse propagation in the few-cycle regime with arbitrary disper-sion,” J. Mod. Opt. 52, 973–986 (2005).
7. S. B. P. Radnor, L. E. Chipperfield, P. Kinsler, and G. H. C. New, “Carrier-wave steepened pulses and gradient-gated high-order harmonic generation,” Phys. Rev. A 77, 033806 (2008).
8. N. K. M. Naga Srinavas, S. Sree Harsha, and D. N. Rao, “Femtosecond supercontinuum generation in a quadratic nonlinear medium (KDP),” Opt. Express 13, 3224–3229 (2005).
9. C. Langrock, M. M. Fejer, I. Hartl, and M. E. Fernmann, “Generation of octave-spanning spectra inside reverse-proton-exchanged periodically poled lithium niobate waveguides,” Opt. Lett. 32, 2478–2480 (2007).
10. P. S. Kuo, K. L. Vodopyanov, M. M. Fejer, D. M. Si-manovskii, X. Yu, J. S. Harris, B. Bliss, and D. Weyburne, “Optical parametric generation of a mid-infrared con-tinuum in orientation-patterned GaAs,” Opt. Lett. 31, 71–73 (2006).
11. R. A. Baumgartner and R. L. Byer, “Optical parametric am-plification,” IEEE J. Quantum Electron. 15, 432–444 (1979).
12. M. M. Fejer, G. A. Magel, D. H. Jundt, and R. L. Byer, “Quasi-phase matched second harmonic generation: tuning and tolerances,” IEEE J. Quantum Electron. 28, 2631–2654 (1992).
13. D. S. Hum and M. M. Fejer, “Quasi-phasematching,” C. R. Phys. 8, 180–198 (2007).
14. A. Ferrando, M. Zacares, P. F. de Cordoba, D. Binosi, and A. Montero, “Forward-backward equations for nonlinear propagation in axially invariant optical systems,” Phys. Rev. E 71, 016601 (2005).
15. A. I. Maimistov and A. M. Basharov, Nonlinear Optical Waves (Kluwer, 1999), Chap. 4, p. 137.
16. R. K. Bullough, P. M. Jack, P. W. Kitchenside, and R. Saun-ders, “Solitons in laser physics,” Phys. Scr. 20, 364–381 (1979).
17. J. C. Eilbeck and R. K. Bullough, “The method of character-Fig. 5. (Color online) Same as Fig.4, with the QPM period of
19.9m that is adapted for SHG with a pump pulse at 1.58m.
Fig. 6. (Color online) Same as Fig.3, showing QPM-induced SC from the mixing of a 500 fs 1 GW/ cm2pump at 3.31m and a
istics in the theory of resonant or nonresonant nonlinear optics,” J. Phys. A 5, 820–829 (1972).
18. G. Rosen, “Electromagnetic shocks and the self-annihilation of intense linearly polarized radiation in an ideal dielectric material,” Phys. Rev. 139, A539–A543 (1965).
19. R. G. Flesch, A. Pushkarev, and J. V. Moloney, “Carrier wave shocking of femtosecond optical pulses,” Phys. Rev. Lett. 76, 2488–2491 (1996).
20. Dispersion data taken from Optical Society of America, Michael Bass, ed., Handbook of Optics, 2nd ed. (McGraw-Hill, 1994), Vol. 2.