EXPLAINING CUSTOMER LOYALTY TO
RETAIL STORES IN U.S. HISPANIC MARKETS
Received: August 1, 2013 Accepted:
Explaining customer store loyalty in emerging markets, in particular Hispanic markets, is the main purpose of this paper. Acknowledging that there have been many attempts to be understand customer store loyalty, this study employs an explanation chain and, thus, a model describing key relationships in the generation of customer loyalty, from initial customer satisfaction to trust, to commitment, to loyalty. Additional variab
moderators of the relationships taking place within the explanation chain. Using both SPSS and SEM analyses, the results support a strong explanation chain of customer store loyalty with moderators adding less than 5% explained varianc
research limitations are also examined.
Keywords: Retail customer; Hispanic Consumers
1. Introduction
This study aims at examining the process store customers follow in developing loyalty to a store. Examining this process is important in a context of a growing market in which store choices are numerous and continue to multiply. Moreover, explaining the
of store loyalty is crucial when a) the phenomenon becomes more complex as population grows and more stores enter the markets, and b) existing conceptual frameworks offer limited empirical support.
Thus, the following research questions
RQ1. What are the critical components of an explanation chain of customer loyalty? RQ2. What are the significant moderators of the relationships taking place in the
explanation chain?
RQ3. How similar or different are Hispanic consumer
the stores they patronize?
EXPLAINING CUSTOMER LOYALTY TO
RETAIL STORES IN U.S. HISPANIC MARKETS
ARTURO Z. VASQUEZ
MIGUEL
The University of Texas-Pan American, U.S.A.
Accepted: January 27, 2014 Online Published:
Abstract
Explaining customer store loyalty in emerging markets, in particular Hispanic markets, is the main purpose of this paper. Acknowledging that there have been many attempts to be understand customer store loyalty, this study employs an explanation chain and, thus, a model describing key relationships in the generation of customer loyalty, from initial customer satisfaction to trust, to commitment, to loyalty. Additional variables are explored as moderators of the relationships taking place within the explanation chain. Using both SPSS and SEM analyses, the results support a strong explanation chain of customer store loyalty with moderators adding less than 5% explained variance. Managerial implications and research limitations are also examined.
Customer store loyalty; Trust; Commitment
This study aims at examining the process store customers follow in developing loyalty to a store. Examining this process is important in a context of a growing market in which store choices are numerous and continue to multiply. Moreover, explaining the
of store loyalty is crucial when a) the phenomenon becomes more complex as population grows and more stores enter the markets, and b) existing conceptual frameworks offer limited
Thus, the following research questions guide the study:
. What are the critical components of an explanation chain of customer loyalty? What are the significant moderators of the relationships taking place in the
How similar or different are Hispanic consumers in the way they become loyal to the stores they patronize?
EXPLAINING CUSTOMER LOYALTY TO
RETAIL STORES IN U.S. HISPANIC MARKETS
ASQUEZ-PARRAGA
IGUEL A. SAHAGUN
Pan American, U.S.A.Online Published: February 12, 2014
Explaining customer store loyalty in emerging markets, in particular Hispanic markets, is the main purpose of this paper. Acknowledging that there have been many attempts to better understand customer store loyalty, this study employs an explanation chain and, thus, a model describing key relationships in the generation of customer loyalty, from initial customer les are explored as moderators of the relationships taking place within the explanation chain. Using both SPSS and SEM analyses, the results support a strong explanation chain of customer store loyalty e. Managerial implications and
ommitment; Satisfaction; U.S.
This study aims at examining the process store customers follow in developing loyalty to a store. Examining this process is important in a context of a growing market in which store choices are numerous and continue to multiply. Moreover, explaining the formation process of store loyalty is crucial when a) the phenomenon becomes more complex as population grows and more stores enter the markets, and b) existing conceptual frameworks offer limited
. What are the critical components of an explanation chain of customer loyalty? What are the significant moderators of the relationships taking place in the
The purpose of this research is to attempt an explanation of customer store loyalty by testing an explanation chain of the key relationships taking place in the process of generating customer loyalty. In addition, this research explores the effects of significant moderators in the relationships defining the explanation chain. Research results are based on data gathered from consumers in Hispanic markets in the U.S.
The remaining of the paper addresses the components of explanation chain and the reason why such an explanation is a parsimonious approach to customer store loyalty. Next, the methods and results of the research are explained and discussed along with the research implications of the most important findings. The conclusions of the study are presented last.
2. Explaining Customer Store Loyalty
Both research and practitioners are interested in a parsimonious explanation of customer store loyalty. Several factors have been identified as predictors or influential attributes of customer loyalty in a retail context. Some factors were generated by the retailer, such as service quality (Fullerton, 2005; Wong & Sohal, 2003a) or perceived quality (Mitchell & Kiral, 1998), process brand –the experience that retailers provide—(Davies, 1992), brand differentiation (Tuckey, 2001), private-label use (Ailawadi, Pauwels, & Steemkamp, 2008), incentives offered by retailers (Beeler, 2000), and positive encounters at the store (Wong & Sohal 2003b). Other factors have been identified on the basis of studies of customer behavior, such as budget spent at the store (Knox & Denison, 2000), shoppers’ individual needs (Barlow, 2000), cross-shopping (Stark & Ebenkamp, 1999), emotional satisfaction (Wong, 2004), and uncertainty avoidance a la Hofstede (Straughan & Albers-Miller, 2001). In addition, website information and perceived value were positively associated to customer loyalty intentions towards apparel retail websites (Kim & Niehm, 2009).
2.1. The Role of Customer Satisfaction, Trust, and Commitment on Customer Store Loyalty
Satisfaction and loyalty have been key concepts in understanding customer behavior outcomes. At the center of attention, however, is the actual role of customer satisfaction in the achievement of customer loyalty. Some authors assert that loyalty is the result of obtaining customer satisfaction (Hallowell, 1996; Heskett, Jones, Loveman, Sasser, & Schlesinger, 1994), including moderating effects (Chen, Wang, Wang, & Tsai, 2010) and various antecedents (De Wulf, Odekerken-Schroeder & Iacobucci, 2001; Juhl, Kristensen & Ostergaard, 2002; Kristensen, Juhl & Ostergaard, 2001; Murgulets, Eklof, Dukeov, & Selivanova, 2002; Piron, 2001). In contrast, other authors empirically conclude that store loyalty cannot be generated by customer satisfaction alone or that both satisfaction and loyalty are only indirectly related (Miranda, Konya & Havrila, 2005; Reichheld, 1996; Sivadas & Baker-Prewitt, 2000; Vasquez-Parraga & Alonso, 2000).
Yet, accepting that customer satisfaction and loyalty are indirectly related, the key question is which mediating variables are in between satisfaction and loyalty. Authors differ on which mediating variables are relevant. Trust, commitment, word-of-mouth communication are some mediatory variables identified in previous research (Sivadas & Baker-Prewitt, 2000). More specifically, some alternatives were proposed to explore or explain customer store loyalty, such as the means-end chain (Lee, Chang & Liu, 2010) and the role of retail format in observable loyalty patterns in a market (Bustos-Reyes & Gonzalez-Benito, 2008).
We adopt a framework that appears to be more rational and complete to explain how customer loyalty is generated and sustained when adopting consumer services, the V-A approach (Vasquez-Parraga & Alonso, 2000; Zamora, Vasquez-Parraga, Rodriguez, & Gonzalez, 2011). This approach offers important advantages as a conceptual framework.
First, it adopts “true” loyalty (see Dick
attitudinal characteristics. Second, it includes transactional satisfaction, not only product satisfaction, for a more thorough measurement of customer satisfaction. Third, it
the importance of three core variables
explanation of loyalty. These variables have a sequential impact on loyalty starting in a satisfactory experience with both the product and the transaction. Such
generates trust, which in turn produces commitment, which in turn results in loyalty. This sequence of satisfaction, trust, commitment, and loyalty is the explanation chain (Hunt, 2010) and attempts to represent a parsimonious explanat
loyalty is defined as the end result of trust and commitment between the client and the provider through multiple encounters, building up a satisfactory relationship in the long (Bravo, Vasquez-Parraga, & Zamora
Zamora, Vasquez-Parraga, Morales, & Cisternas
2.2. The Role of Other Factors on Customer Store Loyalty
Unlike Oliver (1997, 1999), Sawmong
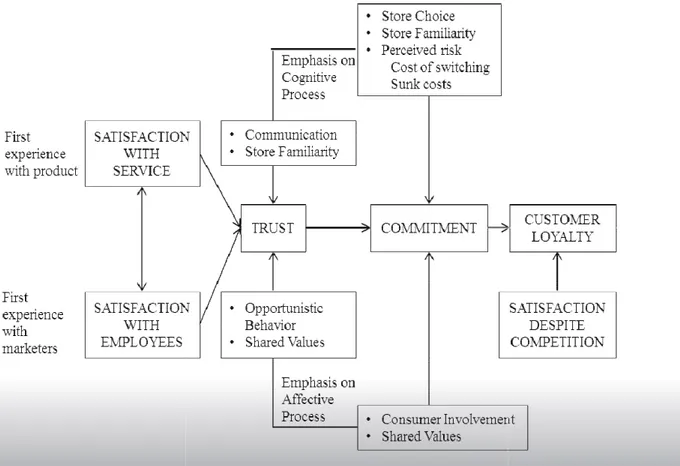
(2006), who study loyalty under conditions of cognitive, affective, conative, and action evaluations, the V-A approach examines the entire process of generating loyalty under both essential conditions, cognitive and affective, and thus identifies and test
moderating effects on either the role of trust or the role of commitment on the basis of two attitude sources, cognitive and affective. The cognitive effects derive from attitudes such as customer perceived risk, store familiarity, store choi
influences derive from attitudes such as customer opportunistic propensity, consumer involvement, and shared values with the service provider. Both, the cognitive and affective attitudes moderate the effect of either
shown in Figure 1.
Figure 1 – Antecedents of Customer Loyalty ( 2000)
pts “true” loyalty (see Dick & Basu, 1994), which includes both behavioral and attitudinal characteristics. Second, it includes transactional satisfaction, not only product satisfaction, for a more thorough measurement of customer satisfaction. Third, it
the importance of three core variables—satisfaction, trust, and commitment
explanation of loyalty. These variables have a sequential impact on loyalty starting in a satisfactory experience with both the product and the transaction. Such positive experience generates trust, which in turn produces commitment, which in turn results in loyalty. This sequence of satisfaction, trust, commitment, and loyalty is the explanation chain (Hunt, 2010) and attempts to represent a parsimonious explanation of customer loyalty. Thus, customer loyalty is defined as the end result of trust and commitment between the client and the provider through multiple encounters, building up a satisfactory relationship in the long
Parraga, & Zamora, 2005; Torres, Vasquez-Parraga, & Barra, Parraga, Morales, & Cisternas, 2004).
2.2. The Role of Other Factors on Customer Store Loyalty
Unlike Oliver (1997, 1999), Sawmong & Omar (2004), and Evanschitzky
(2006), who study loyalty under conditions of cognitive, affective, conative, and action A approach examines the entire process of generating loyalty under both essential conditions, cognitive and affective, and thus identifies and test
moderating effects on either the role of trust or the role of commitment on the basis of two attitude sources, cognitive and affective. The cognitive effects derive from attitudes such as customer perceived risk, store familiarity, store choice, and communication. The affective influences derive from attitudes such as customer opportunistic propensity, consumer involvement, and shared values with the service provider. Both, the cognitive and affective attitudes moderate the effect of either trust on commitment or commitment on loyalty, as
Antecedents of Customer Loyalty (Adapted from Vasquez-Parraga & Alonso, Basu, 1994), which includes both behavioral and attitudinal characteristics. Second, it includes transactional satisfaction, not only product satisfaction, for a more thorough measurement of customer satisfaction. Third, it underscores satisfaction, trust, and commitment—in the explanation of loyalty. These variables have a sequential impact on loyalty starting in a positive experience generates trust, which in turn produces commitment, which in turn results in loyalty. This sequence of satisfaction, trust, commitment, and loyalty is the explanation chain (Hunt, 2010) ion of customer loyalty. Thus, customer loyalty is defined as the end result of trust and commitment between the client and the provider through multiple encounters, building up a satisfactory relationship in the long-term Parraga, & Barra, 2009;
Omar (2004), and Evanschitzky & Wunderlich (2006), who study loyalty under conditions of cognitive, affective, conative, and action A approach examines the entire process of generating loyalty under both essential conditions, cognitive and affective, and thus identifies and tests a number of moderating effects on either the role of trust or the role of commitment on the basis of two attitude sources, cognitive and affective. The cognitive effects derive from attitudes such as ce, and communication. The affective influences derive from attitudes such as customer opportunistic propensity, consumer involvement, and shared values with the service provider. Both, the cognitive and affective trust on commitment or commitment on loyalty, as
In addition, we examine the role of some demographic characteristics, such as income and education, besides the core explanatory variables of loyalty and the corresponding moderating effects on trust and commitment. No hypotheses were posited because the research reported here is formative in the area of customer store loyalty; nonetheless, the results are reflective in the study of loyalty using the V-A approach.
3. Methodology
Following a previous application of a survey research designed to test the explanation chain with transportation users (Zamora et al., 2011), this study adapted the questions and measures related to the eight core constructs and eight moderating factors used. The eight core constructs representing the process leading to loyalty and the explanation chain are cognitive loyalty, affective loyalty, behavioral loyalty, trust, commitment, satisfaction with service, satisfaction with employees, and satisfaction despite competition. The eight moderating factors of the effects of trust on commitment and the effects of commitment on loyalty are store choice, store familiarity, company opportunism, communication between the customer and the company, perceived risk, consumer involvement with the service, shared personal values, and shared management values, as listed in Table 1.
Table 1 – Confirmatory Factor Analysis
Constructs and Items Factor
Loading Inner Behavioral Loyalty (α = .853, AVE = 61.647%)
Even though grocery stores are available in many brands, I always use the same one. If I like a grocery store, I rarely switch from it just to try something different. I have been with my favorite store for a long time.
I plan to continue relying on my favorite store for a long time.
.665 .564 .871 .846
Outer Behavioral Loyalty (α = .843, AVE = 86.616%)
I say positive things about my favorite store to others. I encourage friends and relatives to use my favorite store.
.877 .770
Affective Loyalty (α = .877, AVE = 59.492%)
Once I get used to a store, I hate to switch. I feel a strong loyalty to my favorite store.
I have developed some sort of emotional connection with my favorite store. Continued service from my favorite store gives me peace of mind.
I’d like my current favorite store to be my permanent store.
.744 .837 .745 .752 .774
Cognitive Loyalty (α = .800, AVE = 45.562%)
Once I get to know a grocery store, I tend to use that store more often. For the time being, I am not looking for an alternative store.
When I decide to stay with a store, I make sure that the store is a competent one. I am loyal to my grocery store because personnel at this store are very knowledgeable. Client loyalty in grocery stores is based on good reasons or experiences.
.539 .617 .790 .704 .697 Commitment (α = .905, AVE = 66.430%)
I am proud to be a client of my favorite grocery store. I feel a sense of belonging to my store.
As far I am concerned no one could choose a better grocery store. I am very confident about the success of my store.
I feel that I have a personal relationship with my grocery store.
.857 .892 .814 .765 .737 α = Cronbach coefficient alpha.
Table 1 – Confirmatory Factor Analysis
Trust (α = .900, AVE = 60.716%)
I have complete faith in the integrity of the
I feel quite confident that my store will always try to treat me fairly. My grocery store has been frank in dealing with me.
My store would never try to gain an advantage by deceiving its clients. My grocery store is trustworthy.
I am sure that the offerings at my favorite grocery store are valuable ones.
Opportunism (α = .865, AVE = 57.097%)
To accomplish its own objectives, my store might not provide me with the best benefits available.
To accomplish its own objectives, my store sometimes promises to do things without actually delivering them
My grocery store sometimes pretends that a service is of value to me, when in fact the store is looking out for itself.
I think that my store does not care about
M y grocery store only cares about the money I pay.
Familiarity (α = .861, AVE = 53.865%)
Compared to other people, I know a lot about grocery stores. Compared to most of my friends, I know a lot about grocery stores. I am familiar with many products offered by my favorite store.
I know a lot about selecting products and services made available by grocery stores.
I have a clear idea about what grocery stores should offer for me to get maximum satisfaction.
Risk (α = .848, AVE = 53.981%)
I am concerned about making a mistake in choosing a grocery store. The decision to choose a grocery store involves high risk.
If I have to switch my current store, I might lose some benefits I have already I think that there is a hidden cost if I switch my current store.
Switching among stores involves a cost in terms of time and effort.
Communication (α = .853, AVE = 54.661%)
My store keeps me informed of new products.
My store clearly explains the product features when I ask.
When I make suggestions, the personnel working at my store always listen to my suggestions. If I want to, I can have detailed conversations regarding products and prices with personnel from my store.
As far as I know, my store cares about receiving feedback from its customers.
Involvement (α = .889, AVE = 62.035%)
I have great interest in grocery stores. Grocery stores are fascinating.
I have a compulsive need to know more about grocery stores. I like to make comparisons between grocery stores.
I like to talk to my friends about grocery stores.
Shared Personal Values (α = .774, AVE = 81.578%)
In this business, unethical behaviors shouldn’t be
In this business, using unethical advertising cannot be justified. α = Cronbach coefficient alpha.
AVE = average variance extracted
Confirmatory Factor Analysis (Continued) Constructs and Items = .900, AVE = 60.716%)
I have complete faith in the integrity of the personnel at my store. I feel quite confident that my store will always try to treat me fairly. My grocery store has been frank in dealing with me.
My store would never try to gain an advantage by deceiving its clients. m sure that the offerings at my favorite grocery store are valuable ones.
= .865, AVE = 57.097%)
To accomplish its own objectives, my store might not provide me with the best benefits its own objectives, my store sometimes promises to do things without actually My grocery store sometimes pretends that a service is of value to me, when in fact the store is I think that my store does not care about me.
M y grocery store only cares about the money I pay.
= .861, AVE = 53.865%)
Compared to other people, I know a lot about grocery stores. Compared to most of my friends, I know a lot about grocery stores.
am familiar with many products offered by my favorite store.
I know a lot about selecting products and services made available by grocery stores.
I have a clear idea about what grocery stores should offer for me to get maximum satisfaction.
I am concerned about making a mistake in choosing a grocery store. The decision to choose a grocery store involves high risk.
If I have to switch my current store, I might lose some benefits I have already earned. I think that there is a hidden cost if I switch my current store.
Switching among stores involves a cost in terms of time and effort.
= .853, AVE = 54.661%)
My store keeps me informed of new products.
store clearly explains the product features when I ask.
When I make suggestions, the personnel working at my store always listen to my suggestions. If I want to, I can have detailed conversations regarding products and prices with personnel As far as I know, my store cares about receiving feedback from its customers.
= .889, AVE = 62.035%)
I have great interest in grocery stores.
I have a compulsive need to know more about grocery stores. e to make comparisons between grocery stores.
I like to talk to my friends about grocery stores.
α = .774, AVE = 81.578%)
In this business, unethical behaviors shouldn’t be tolerated. In this business, using unethical advertising cannot be justified.
Factor Loading .786 .849 .780 .810 .807 .625
To accomplish its own objectives, my store might not provide me with the best benefits its own objectives, my store sometimes promises to do things without actually My grocery store sometimes pretends that a service is of value to me, when in fact the store is
.658 .716 .846 .811 .731
I have a clear idea about what grocery stores should offer for me to get maximum satisfaction.
.904 .915 .609 .666 .473 .714 .829 .793 .746 .562
When I make suggestions, the personnel working at my store always listen to my suggestions. If I want to, I can have detailed conversations regarding products and prices with personnel
.585 .738 .798 .846 .702 .849 .879 .783 .641 .764 .989 .608
Table 1 – Confirmatory Factor Analysis (Continued)
Constructs and Items Factor
Loading Shared Management Values (α = .725, AVE = 41.815%)
In this business, unethical behaviors shouldn’t be tolerated. In this business, using unethical advertising cannot be justified. The way opportunistic stores try to get new customers is unethical.
It is unethical to call a competitor’s customers and try to convince them to switch stores.
.752 .815 .499 .439
Satisfaction with Service (α = .908, AVE = 72.680%)
This is one of the best experiences with a grocery store I have ever had. This grocery store is exactly what I need.
This grocery store has worked out as well as I thought it would. This grocery store has adequately fulfilled my expectations.
.729 .907 .902 .860
Satisfaction with Employees (α = .876, AVE = 64.131%)
Employees at my current grocery store give me personal attention. Employees at my current grocery store know what they are doing.
Employees at my grocery store are never too busy to respond to client requests promptly. Employees from my favorite grocery store are polite.
.809 .794 .839 .760
Satisfaction Despite Competition (α = .896, AVE = 68.407%)
Compared to the other stores, my grocery store offers the best products. Compared to the other stores, my grocery store has the best reputation.
Compared to the other stores, my stores gives customers the best satisfaction overall. I am satisfied with my decision to choose this store over all the other stores.
.822 .828 .860 .797 α = Cronbach coefficient alpha.
AVE = average variance extracted
In order to apply the framework to store users in line with the purpose of this research, adult consumers were approached in a geographical area where 1) consumers have access to grocery stores carrying either national or local or both types of brands, 2) different requirements to get customer satisfaction in the short-term and gain customer loyalty, trust and commitment in the long-term can be scrutinized, and 3) consumers predominantly share a Hispanic ethnic background.
Numbering more than 50 million people, Hispanic consumers are the largest minority, approximately 16% of the U.S. population. Hispanic consumers represent several countries of origin in Latin America, in particular Mexico as well as countries in Europe and Asia. Despite the range of national origin, common demographics and similar ethnic traits are the basis for the official U.S. government designation of this large demographic segment as “Hispanic.” Consumer researchers have generally studied Hispanics on the basis of the strong impact of cultural heritage on consumer behavior (Wadia, 1967), the constraints that the social majority imposes on minority ethnic groups to limit both consumption and opportunities for self-fulfillment and psychological well-being (Hirschman, 1985), and the situational effects, such as social surroundings and product type, that moderate the relationship between felt ethnicity and consumer behavior (Stayman & Deshpande, 1989). We assume in this study that Hispanic consumers may demonstrate social and situational differences in the way they get customer satisfaction, trust others in the society, commit to others, and become loyal customers.
Only heads of households and/or adults who acknowledged having shopping experience were interviewed. The actual sample included 362 store customers. Table 2 summarizes the sample profile. About 62% are women, 45% married, and 41% older than 30 years.
Table 2 Characteristics Gender Males Females Marital Married Single Divorced or Separated Age 20 years or less Between 21 Between 31 Between 41 50 years or more
4. Results and Discussion
4.1 Results on the Measures Used
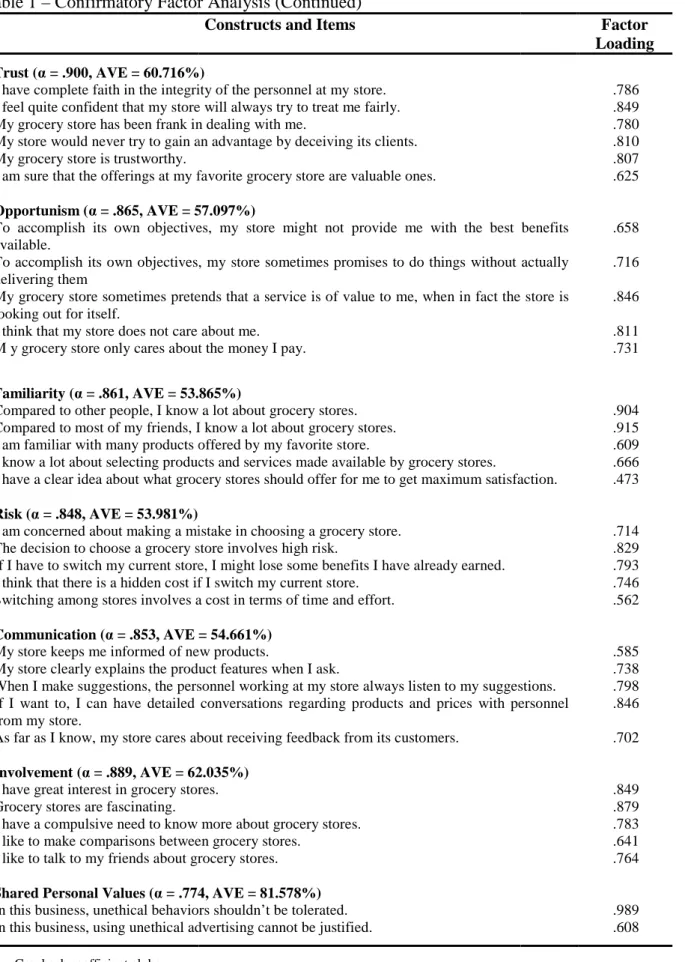
Table 1 shows all the constructs measured including the items used, their factor loadings, their reliability coefficients (α), and the average variance explained (AVE). The items representing
cognitive, affective, and behavioral loyalty loaded as expected in corresponding constructs, with a minor exception. Behavioral loyalty reflected two components, an inner and an outer tendency of behavioral loyalty as best described by the items themselves (see Table 1). A four constructs reflecting customer loyalty show high reliability coefficients (above .80) and significant average variances explained. As a result, customer loyalty is a second
derived from four constructs. Similarly, the items representin
the three types of satisfaction (with the service, with employees, and with the competition) loaded as expected with reliability coefficients above .85 and average variance explained above 67%. Customer satisfaction is a second
Both sets of constructs, loyalty and satisfaction were further analyzed using structural equation modeling to obtain corresponding second
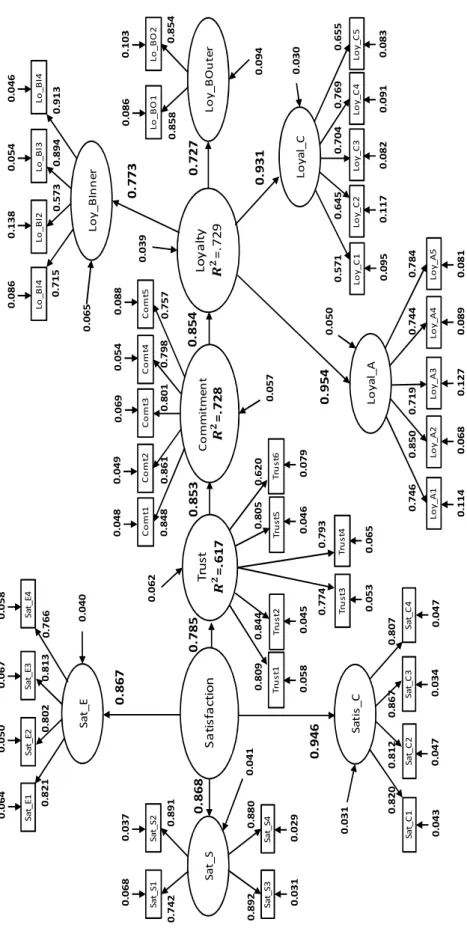
model. Figure 2 shows the well
satisfaction and the resulting overall fit of the model representing the explanation chain. Table 2 – Sample Profile
Characteristics Percentages Gender Males 38.3 Females 61.7 Marital Status Married 44.8 Single 46.4 Divorced or Separated 8.8 20 years or less 4.7 Between 21-30 years 54.2 Between 31-40 years 15.8 Between 41-50 years 15.0 50 years or more 10.3
Discussion
4.1 Results on the Measures Used
Table 1 shows all the constructs measured including the items used, their factor loadings, their ), and the average variance explained (AVE). The items representing ive, and behavioral loyalty loaded as expected in corresponding constructs, with a minor exception. Behavioral loyalty reflected two components, an inner and an outer tendency of behavioral loyalty as best described by the items themselves (see Table 1). A four constructs reflecting customer loyalty show high reliability coefficients (above .80) and significant average variances explained. As a result, customer loyalty is a second
Similarly, the items representing customer commitment and trust and the items reflecting the three types of satisfaction (with the service, with employees, and with the competition) loaded as expected with reliability coefficients above .85 and average variance explained
mer satisfaction is a second-order factor derived from three constructs. Both sets of constructs, loyalty and satisfaction were further analyzed using structural equation modeling to obtain corresponding second-order factors and a simultaneous fit of the odel. Figure 2 shows the well-fitted second-order constructs of customer loyalty and satisfaction and the resulting overall fit of the model representing the explanation chain.
Table 1 shows all the constructs measured including the items used, their factor loadings, their ), and the average variance explained (AVE). The items representing ive, and behavioral loyalty loaded as expected in corresponding constructs, with a minor exception. Behavioral loyalty reflected two components, an inner and an outer tendency of behavioral loyalty as best described by the items themselves (see Table 1). All four constructs reflecting customer loyalty show high reliability coefficients (above .80) and significant average variances explained. As a result, customer loyalty is a second-order factor g customer commitment and trust and the items reflecting the three types of satisfaction (with the service, with employees, and with the competition) loaded as expected with reliability coefficients above .85 and average variance explained
order factor derived from three constructs. Both sets of constructs, loyalty and satisfaction were further analyzed using structural
order factors and a simultaneous fit of the order constructs of customer loyalty and satisfaction and the resulting overall fit of the model representing the explanation chain.
Figure 2 – Customer Store Loyalty: Explanation Chain - SEM Results T ru s t = . 6 1 7 L o y a lt y = .7 2 9 S a ti s fa c ti o n 0 . 7 8 5 0 . 9 4 6 0 . 8 5 4 0 . 8 6 7 0 . 9 3 1 0 . 9 5 4 0 . 8 5 3 S a t_ E 0 .7 6 6 0 .8 1 3 0 .8 0 2 0 .8 2 1 S a t_ E 1 S a t_ E 2 S a t_ E 3 S a t_ E 4 S a ti s _ C 0 .8 2 0 0 .8 1 2 0 .8 6 7 0 .8 0 7 S a t_ S 0 .8 8 0 0 .8 9 1 0 .7 4 2 0 .8 9 2 S a t_ S 3 S a t_ S 1 S a t_ S 2 S a t_ S 4 0 . 8 6 8 T ru s t6 T ru s t4 T ru s t3 T ru s t1 0 .8 0 9 0 .7 7 4 0 .7 9 3 0 .6 2 0 T ru s t2 T ru s t5 0 .8 4 4 0 .8 0 5 C o m m it m e n t = . 7 2 8 0 .7 5 7 0 .7 9 8 0 .8 6 1 0 .8 4 8 C o m t1 C o m t2 C o m t4 C o m t5 C o m t3 0.8 0 1 L o y _ A 1 L o y a l_ A 0 .7 4 6 0 .8 5 0 0 .7 1 9 0 .7 4 4 0 .7 8 4 L o y a l_ C 0 .5 7 1 0 .6 4 5 0 .7 0 4 0 .7 6 9 0 .6 5 5 L o y _ B In n e r 0 .9 1 3 0 .8 9 4 0 .5 7 3 0 .7 1 5 0 . 7 7 3 0 .8 5 4 L o y _ B O u te r L o _ B O 1 0 . 7 2 7 0 .8 5 8 S a t_ C 1 S a t_ C 2 S a t_ C 3 S a t_ C 4 L o y _ A 2 L o y _ A 3 L o y _ A 4 L o y _ A 5 L o y _ C 1 L o y _ C 2 L o y _ C 3 L o y _ C 4 L o y _ C 5 L o _ B O 2 L o _ B I4 L o _ B I3 L o _ B I2 L o _ B I4 0 .0 6 8 0 .0 3 7 0 .0 3 1 0 .0 2 9 0 .0 4 9 0 .0 6 9 0 .0 5 4 0 .0 8 8 0 .0 4 8 0.1 1 4 0 .0 9 5 0 .1 1 7 0 .0 8 2 0 .0 9 1 0 .0 8 3 0 .0 6 8 0 .1 2 7 0 .0 8 9 0 .0 8 1 0 .1 0 3 0 .0 8 6 0 .0 8 6 0 .1 3 8 0 .0 5 4 0 .0 4 6 0 .0 7 9 0 .0 4 6 0 .0 6 5 0 .0 5 3 0 .0 4 5 0 .0 5 8 0 .0 4 7 0 .0 3 4 0 .0 4 7 0 .0 4 3 0 .0 6 4 0 .0 5 0 0 .0 6 7 0 .0 5 8 0 .0 6 2 0 .0 5 7 0 .0 3 9 0 .0 6 5 0 .0 9 4 0 .0 3 0 0 .0 5 0 0 .0 3 1 0 .0 4 0 0 .0 4 1
Table 3 reports on the model fit measures including CFI = .920, NFI= .863, Chi Squared (692) = 1,520.621 at p = .000, RMSEA= .058, and SRMR= .073. These are all plausible goodness of fit results. Both Figure 2 and Table 3 also show the explained variances
(R2 = .617), Commitment (R
explanation, before additional variables are considered in the model. In contrast, data from a sample of non
shows slightly weaker explanatory results for Trust (R Loyalty (R2 = .687).
4.2. Results on the Loyalty Process
Tables 4 and 5 quantify the loyalty process relationships charted in Figure 1. Table 4 shows the mutual relationships among all constructs. All core variables are highly and positively related at p < 0.01 level. Similarly, all moderating factors are significantly related at p < 0.01, except for 4 relationships (commitment
shared personal values – store familiarity; shared manager values significant at p < 0.05, and 6 relationships out of 29 (opportunism values; opportunism - shared personal values; opportunism
personal values - communication; shared personal values values - consumer involvement) that are not significant.
Finally, all core variables are significantly related, though not always positi
moderating factors at p < 0.01. Opportunism is negatively related to all core variables signifying the counter-effect of an "egoist" trait to the relational properties of loyalty, commitment, trust and satisfaction.
Table 5 shows the joint eff
loyalty, using hierarchical moderated regression analysis with one
when testing for the various effects. Three models are used in order to observe the separate effects of groups of variables starting with the core variables (Model 1), following with the moderating variables (Model 2), and finishing with simple interaction terms between a core variable and a moderating variable (Model 3).
Notably, the core variables ex
loyalty to the store (Table 5, Model 1) whereas the moderating variables impact loyalty only to some extent (∆ R2 is .017) as seen in Model 2. With that advantage, the interaction terms increase the coefficients to .637 (
presence of sub processes in the overall process of generating and sustaining customer store loyalty.
The moderating effects of shared personal values interacting with trust
particularly notable. Shared personal values significantly and negatively interact with customer trust. When shared personal values are present, the role of trust becomes reduced. The more personal value is shared by the customer, the le
customer.
In contrast, data from a sample of non
shows similar results although the impact of the core variables on customer loyalty is slightly lower (.555); the additional ef
a greater increase in effects (∆
is little (R2 = .597) despite a significant interaction Trust which produced a slightly greater increase in overall effects (
Table 3 reports on the model fit measures including CFI = .920, NFI= .863, Chi Squared (692) = 1,520.621 at p = .000, RMSEA= .058, and SRMR= .073. These are all plausible goodness of fit results. Both Figure 2 and Table 3 also show the explained variances
= .617), Commitment (R2 = .728), and Loyalty (R2 = .729), denoting high levels of explanation, before additional variables are considered in the model.
In contrast, data from a sample of non-Hispanic consumers (not reported in this paper) ows slightly weaker explanatory results for Trust (R2 = .567), Commitment (R
4.2. Results on the Loyalty Process
Tables 4 and 5 quantify the loyalty process relationships charted in Figure 1. Table 4 shows ationships among all constructs. All core variables are highly and positively related at p < 0.01 level. Similarly, all moderating factors are significantly related at p < 0.01, except for 4 relationships (commitment – opportunism; commitment - shared pe
store familiarity; shared manager values – perceived risk) that are significant at p < 0.05, and 6 relationships out of 29 (opportunism - shared management shared personal values; opportunism – consumer involvement; shared communication; shared personal values - perceived risk; shared personal consumer involvement) that are not significant.
Finally, all core variables are significantly related, though not always positi
moderating factors at p < 0.01. Opportunism is negatively related to all core variables effect of an "egoist" trait to the relational properties of loyalty, commitment, trust and satisfaction.
Table 5 shows the joint effects of the independent variables on the dependent variable, loyalty, using hierarchical moderated regression analysis with one-tailed test for significance when testing for the various effects. Three models are used in order to observe the separate ts of groups of variables starting with the core variables (Model 1), following with the moderating variables (Model 2), and finishing with simple interaction terms between a core
moderating variable (Model 3).
Notably, the core variables explain a relatively high R2 coefficient (.607) for customer loyalty to the store (Table 5, Model 1) whereas the moderating variables impact loyalty only is .017) as seen in Model 2. With that advantage, the interaction terms he coefficients to .637 (∆ R2 = .015) as shown in Model 3, indicating a minor presence of sub processes in the overall process of generating and sustaining customer store
The moderating effects of shared personal values interacting with trust
particularly notable. Shared personal values significantly and negatively interact with customer trust. When shared personal values are present, the role of trust becomes reduced. The more personal value is shared by the customer, the less trusting to the store is the
In contrast, data from a sample of non-Hispanic consumers (not reported in this paper) shows similar results although the impact of the core variables on customer loyalty is slightly lower (.555); the additional effect of the moderating factors is also weaker (R
a greater increase in effects (∆ R2 is .027); and the additional effect of meaningful interactions = .597) despite a significant interaction Trust – Shared Personal Values (
which produced a slightly greater increase in overall effects (∆ R2 is .015).
Table 3 reports on the model fit measures including CFI = .920, NFI= .863, Chi Squared (692) = 1,520.621 at p = .000, RMSEA= .058, and SRMR= .073. These are all plausible goodness of fit results. Both Figure 2 and Table 3 also show the explained variances of Trust = .729), denoting high levels of Hispanic consumers (not reported in this paper) = .567), Commitment (R2 = .708), and
Tables 4 and 5 quantify the loyalty process relationships charted in Figure 1. Table 4 shows ationships among all constructs. All core variables are highly and positively related at p < 0.01 level. Similarly, all moderating factors are significantly related at p < 0.01, shared personal values; perceived risk) that are shared management consumer involvement; shared perceived risk; shared personal Finally, all core variables are significantly related, though not always positively, to all moderating factors at p < 0.01. Opportunism is negatively related to all core variables effect of an "egoist" trait to the relational properties of loyalty, ects of the independent variables on the dependent variable, tailed test for significance when testing for the various effects. Three models are used in order to observe the separate ts of groups of variables starting with the core variables (Model 1), following with the moderating variables (Model 2), and finishing with simple interaction terms between a core coefficient (.607) for customer loyalty to the store (Table 5, Model 1) whereas the moderating variables impact loyalty only is .017) as seen in Model 2. With that advantage, the interaction terms = .015) as shown in Model 3, indicating a minor presence of sub processes in the overall process of generating and sustaining customer store The moderating effects of shared personal values interacting with trust in Model 3 are particularly notable. Shared personal values significantly and negatively interact with customer trust. When shared personal values are present, the role of trust becomes reduced.
ss trusting to the store is the Hispanic consumers (not reported in this paper) shows similar results although the impact of the core variables on customer loyalty is slightly fect of the moderating factors is also weaker (R2 = .582) despite is .027); and the additional effect of meaningful interactions Shared Personal Values (-.072***)
Table 3 – Fitting of Results to the A-V Explanation Chain (see Fig. 2)
Measurement Parameter Estimates (Standardized)
Factor Loadings Error Variances
λSat_E1 .821*** λLo_BI1 .715*** εSat_E1 .064*** εLo_BI1 .086***
λSat_E2 .802*** λLo_BI2 .573*** εSat_E2 .050*** εLo_BI2 .138***
λSat_E3 .813*** λLo_BI3 .894*** εSat_E3 .067*** εLo_BI3 .054***
λSat_E4 .766*** λLo_BI4 .913*** εSat_E4 .058*** εLo_BI4 .046***
λSat_S1 .742*** λLo_BO1 .858*** εSat_S1 .068*** εLo_BO1 .086***
λSat_S2 .891*** λLo_BO2 .854*** εSat_S2 .037*** εLo_BO2 .103***
λSat_S3 .892*** λLo_A1 .746*** εSat_S3 .031*** εLo_A1 .114***
λSat_S4 .880*** λLo_A2 .850*** εSat_S4 .029*** εLo_A2 .068***
λSat_C1 .820*** λLo_A3 .719*** εSat_C1 .043*** εLo_A3 .127***
λSat_C2 .812*** λLo_A4 .744*** εSat_C2 .047*** εLo_A4 .089***
λSat_C3 .867*** λLo_A5 .784*** εSat_C3 .034*** εLo_A5 .081***
λSat_C4 .807*** λLo_C1 .571*** εSat_C4 .047*** εLo_C1 .095***
λTrust1 .809*** λLo_C2 .645*** εTrust1 .058*** εLo_C2 .117***
λTrust2 .844*** λLo_C3 .704*** εTrust2 .045*** εLo_C3 .082***
λTrust3 .774*** λLo_C4 .769*** εTrust3 .053*** εLo_C4 .091***
λTrust4 .793*** λLo_C5 .655*** εTrust4 .065*** εLo_C5 .083***
λTrust5 .805*** εTrust5 .046*** λTrust6 .620*** εTrust6 .079*** λComt1 .848*** εComt1 .048*** λComt2 .861*** εComt2 .049*** λComt3 .801*** εComt3 .069*** λComt4 .798*** εComt4 .054*** λComt5 .757*** εComt5 .088***
Structural parameter estimates Gamma (γγγγ 's)
γSatisfaction-Trust .785***
γTrust-Commitment .853***
γCommitment-Loyalty .854***
Second order factors
Second order factors Gamma (γγγγ 's)
γLoyalty-Loy_BInner .773*** γSatisfaction-Sat_E .867***
γLoyalty-Loy_BOuter .727*** γSatisfaction-Sat_S .868***
γLoyalty-Loyal_A .954*** γSatisfaction-Sat_C .946***
γLoyalty-Loyal_C .931***
Explained variances: R2Trust = .617*** R2Commitment = .728*** R2Loyalty = .729***
Goodness of fit X2(692) = 1520.621, p = .000 RMSEA = .058 SRMR = .073 NFI = .863 CFI = .920 TLI = .914 *** p<.001 (two-tailed)
Table 4 – Correlations Matrix Variable 1 2 1. Loyalty 1.00 2. Commitment .751** 1.00 3. Trust .681** .757** 4. Satisfaction .620** .639** 5. Opportunism -.154** -.135* 6. Shared P. Values .152** .107* 7. Shared M. Value .148** .194** 8. Communication .478** .518** 9. Store Familiarity .529** .540** 10. Store Choice .323** .404** 11. Perceived Risk .215** .329** 12. C. Involvement .333** .471** **Correlation is significant at the 0.01 level (2 *
Correlation is significant at the 0.05 level (2
Table 5 – Regression Results: Explanation Chain and Moderating Factors Dependent Variable: Customer Loyalty Constant Commitment Trust Satisfaction Opportunism
Shared Personal Values Shared Management Values Communication Familiarity Product Choice Perceived Risk Consumer Involvement Trust x Opportunism Trust x Shared P. Values Trust x Shared M. Values Trust x Communication Trust x Familiarity
Commitment x C. Involvement Commitment x Shared M. Values Commitment x Familiarity Commitment x Product Choice Commitment x Perceived Risk
R2 F ∆∆∆∆R2
a
Core variable effects
b Moderating variable effects
c Two-way interaction effects
*
p<.10, **p<.05, ***p<.01 (one-tailed test for hypothesized relationships).
3 4 5 6 7 8 9 1.00 .709** 1.00 -.281** -.263** 1.00 .219** .243** -.083 1.00 .228** .296** -.082 .369** 1.00 .544** .636** -.259** .097 .274** 1.00 .481** .551** -.078 .128* .155** .482** 1.00 .381** .310** .162** .197** .205** .262** .342** .169** .257** .243** .016 .131* .302** .324** .310** .369** .048 .001 .198** .535** .520**
Correlation is significant at the 0.01 level (2-tailed). Correlation is significant at the 0.05 level (2-tailed).
Regression Results: Explanation Chain and Moderating Factors
MODEL 1a MODEL 2b b t-value b t-value 18.190*** 5.761 16.033*** 3.615 1.414*** 9.803 1.426*** 9.047 .461*** 3.082 .412*** 2.647 .262*** 3.520 .178** 2.283 .083 .832 .192 .955 -.146 -1.231 .149 1.064 .442*** 3.351 -.168 -.772 -.080 -.782 -.175* -1.631 .607 .624 184.241 52.894 .017
tailed test for hypothesized relationships).
9 10 11 12 1.00 .342** 1.00 .324** .140** 1.00 .520** .203** .548** 1.00 MODEL 3c b t-value -3.974 -.202 1.243* 1.814 1.255 1.557 .163** 2.043 .204 .366 1.620* 1.778 -.501 -.813 .625 1.118 .007 .010 -.447 -.599 -.052 -.106 .558 1.173 -.004 -.275 -.050* -1.707 .027 .954 -.017 -.939 -.014 -.530 -.029 -1.567 -.019 -.671 .036 1.426 .014 .470 .000 -.024 .637 28.371 .013
5. Conclusions
In response to the first research question—What are the critical components of an explanation
chain of customer loyalty?—this research found that the impact of satisfaction, trust, and
commitment on customer loyalty is sequential in the form of an explanation chain. A satisfactory experience with the store services and employees generates customer trust, which in turn produces relationship commitment between the customer and the store, which in turn results in customer loyalty in the long term. By testing an explanation chain, this study contributed an account of how store users become loyal to the store. It was found that the process of providing customer satisfaction and generating customer loyalty in stores is dependent on the core factors of the V-A approach used, in particular commitment and trust, the necessary mediating variables of the satisfaction-loyalty link.
In response to the second research question—What are the significant moderators of the
relationships taking place in the explanation chain?—the effect of trust can be mildly reduced
by the prevalence of shared personal values in customers’ behavior. Yet, an attempt to uncover other moderating effects using the other seven potential factors did not result in additional explanation. The results show that many other variables affecting customer loyalty may be mild at the best, not directly but indirectly, and not to the level of effects caused by the core variables, satisfaction, trust, and commitment in this sequential order.
In response to the third research question—How similar or different are Hispanic
consumers in the way they become loyal to the stores they patronize?—this study shows
non-significant differences in the way the process of generating and maintaining customer loyalty takes place. Both Hispanic consumers and non-Hispanic consumers become loyal customers following the path suggested by the explanation chain; however, Hispanic consumers reflect higher levels of satisfaction, trust, commitment, and loyalty than those reported for non-Hispanic consumers. For both groups of consumers, the core variables significantly impact the generation of customer loyalty while other variables, such as the moderating variables explored in this research, have a negligible impact.
There are practical consequences of this research on the understanding of loyalty formation among store customers and the management of the store seeking to develop long-term relationships with buyers. Customer satisfaction alone will not result in customer loyalty, unless managers are complacent about repeated purchase (spurious loyalty) in a context of little or no competition. In today's environment of increasing competition among stores, earning "true" customer loyalty is required; additionally, attaining customer trust and commitment is an essential component in the path to reach customer loyalty in the long term.
This study is limited by the sample and the use of eight moderating factors. More representative sampling and additional moderating variables may capitalize on the properties of the V-A approach to a greater extent to explain "true" loyalty more fully and, at the same time, understand customer store loyalty more thoroughly.
References
Ailawadi, K. L., Pauwels, K., & Steenkamp, J loyalty. Journal of Marketing
Barlow, R. (2000). Retailers’ invisible customers are crying out for recognition. 41 (15), 54-55.
Beeler, A. (2000). Heavy reward for loyalty.
Bravo, M., Vasquez-Parraga, A. Z., & Zamora, J. (2005).
fictitious factors in the formation of loyalty of airline passengers. S
Perspectives in Tourism, 14 (2), 101
Bustos-Reyes, C. A. & Gonzalez based on budget allocation.
Chen, Y. H., Wang, X., Wang, Y. Y., & Tsai, S. image on customers’ satisfaction
International Conference on Service Systems and Service Management (ICSSSM), Taichung, Taiwan: Asia University.
Davies, G. (1992). The two ways in which retailers can be brands.
Retail and Distribution Management
De Wulf, K., Odekerken-Schroder, G., & Iacobucci, D. (2001). Investments in consumer relationships: A cross-country and cross
(October), 33-50.
Dick, A. S. & Basu, K. (1994). Customer loyalty: Toward an integrated conceptual framework. Journal of the Academy of Marketing Science
Evanschitzky, H. & Wunderlich, M. (2006). An examination of moderator effects in stage loyalty model. Journal of
Fullerton, G. (2005). The service quality
commitment matter? Journal of Retailing and Consumer Services
Hallowell, R. (1996). The relationships of customer satisfaction, customer loyalty, and profitability: An empirical study.
7 (4), 27-42.
Heskett, J. L., Jones, T. O., Gary W. Loveman, G. W., Sasser, W.E (1994). Putting the service profit chain to work.
April).
Hirschman, E. C. (1985). Marketing, minorities, and consumption: Traditional and neo Marxist perspective. Journal of Policy and Marketin
Hunt, S. D. (2010). Marketing Theory: Foundations, Controversy, Strategy, Resource
Advantage Theory. Armonk, New York: M.E. Sharpe.
Juhl, H. J., Kristensen, K., & Ostergaard, P. (2002). Customer satisfaction in European food retailing. Journal of Retailing and Consumer Services
Kim, H. & Niehm, L. S. (2009). The impact of website quality on information quality, value, and loyalty intentions in apparel retailing.
Knox, S. D. & Denison, T. J. (2000). Store loyalty: Its impact on retail revenue. An empirical study of purchasing behavior in the U.K.
(1), 33-45.
Kristensen, K., Juhl, H. J., & Ostergaard, P. (2001). Customer satisfaction: European retailing. Total Quality Management
Lee, W. I., Chang, C. Y., & Liu, Y. means-end chain approach.
Miranda, M. J., Konya, L., & Havrila, I. (2005).
key to store loyalty. Marketing Intelligence and Planning
Ailawadi, K. L., Pauwels, K., & Steenkamp, J-B. E. M. (2008).
Private-Journal of Marketing, 72, 19-30.
Barlow, R. (2000). Retailers’ invisible customers are crying out for recognition. Beeler, A. (2000). Heavy reward for loyalty. Advertising Age, 71 (34), 8.
Parraga, A. Z., & Zamora, J. (2005). Loyalty in the air: Real and fictitious factors in the formation of loyalty of airline passengers. S
14 (2), 101-126.
& Gonzalez-Benito, O. (2008). Store and store format loyalty measures based on budget allocation. Journal of Business Research, 61, 1015-1025.
, Wang, X., Wang, Y. Y., & Tsai, S. C. (2010). The moderating effect of retailer image on customers’ satisfaction-loyalty link. Paper presented at the 2010 7 International Conference on Service Systems and Service Management (ICSSSM), Taichung, Taiwan: Asia University.
Davies, G. (1992). The two ways in which retailers can be brands. International
tribution Management, 20 (2) 70-76.
Schroder, G., & Iacobucci, D. (2001). Investments in consumer country and cross-industry exploration. Journal of Marketing
(1994). Customer loyalty: Toward an integrated conceptual
Journal of the Academy of Marketing Science, 22(Spring), 99
Evanschitzky, H. & Wunderlich, M. (2006). An examination of moderator effects in
Journal of Service Research, 8(4), 330-345.
Fullerton, G. (2005). The service quality-loyalty relationship in retail services: Does
Journal of Retailing and Consumer Services, 12 (2), 99
Hallowell, R. (1996). The relationships of customer satisfaction, customer loyalty, and profitability: An empirical study. International Journal of Service Industry Management Heskett, J. L., Jones, T. O., Gary W. Loveman, G. W., Sasser, W.E., Jr., & Schlesinger, L. A.
(1994). Putting the service profit chain to work. Harvard Business Review
C. (1985). Marketing, minorities, and consumption: Traditional and neo
Journal of Policy and Marketing, 4, 179-193.
Marketing Theory: Foundations, Controversy, Strategy, Resource
. Armonk, New York: M.E. Sharpe.
Juhl, H. J., Kristensen, K., & Ostergaard, P. (2002). Customer satisfaction in European food
nal of Retailing and Consumer Services, 9 (6), 327-334.
Kim, H. & Niehm, L. S. (2009). The impact of website quality on information quality, value, and loyalty intentions in apparel retailing. Journal of Interactive Marketing
enison, T. J. (2000). Store loyalty: Its impact on retail revenue. An empirical study of purchasing behavior in the U.K. Journal of Retailing and Consumer Services Kristensen, K., Juhl, H. J., & Ostergaard, P. (2001). Customer satisfaction:
Total Quality Management, 12 (7&8), 890-897.
Lee, W. I., Chang, C. Y., & Liu, Y. L. (2010). Exploring customers’ store loyalty using the end chain approach. Journal of Retailing and Consumer Services,
Miranda, M. J., Konya, L., & Havrila, I. (2005). Shoppers’ satisfaction levels are not the only
Marketing Intelligence and Planning, 23 (2)
220--label use and store Barlow, R. (2000). Retailers’ invisible customers are crying out for recognition. Brandweek,
Loyalty in the air: Real and fictitious factors in the formation of loyalty of airline passengers. Studies and . (2008). Store and store format loyalty measures
1025.
C. (2010). The moderating effect of retailer link. Paper presented at the 2010 7th. International Conference on Service Systems and Service Management (ICSSSM),
International Journal of
Schroder, G., & Iacobucci, D. (2001). Investments in consumer
Journal of Marketing, 65
(1994). Customer loyalty: Toward an integrated conceptual , 22(Spring), 99-113.
Evanschitzky, H. & Wunderlich, M. (2006). An examination of moderator effects in the four-loyalty relationship in retail services: Does
, 12 (2), 99-111.
Hallowell, R. (1996). The relationships of customer satisfaction, customer loyalty, and
International Journal of Service Industry Management,
., Jr., & Schlesinger, L. A.
Harvard Business Review,
(March-C. (1985). Marketing, minorities, and consumption: Traditional and
neo-Marketing Theory: Foundations, Controversy, Strategy,
Resource-Juhl, H. J., Kristensen, K., & Ostergaard, P. (2002). Customer satisfaction in European food 334.
Kim, H. & Niehm, L. S. (2009). The impact of website quality on information quality, value,
Journal of Interactive Marketing, 23, 221-233.
enison, T. J. (2000). Store loyalty: Its impact on retail revenue. An empirical
Journal of Retailing and Consumer Services, 7
Kristensen, K., Juhl, H. J., & Ostergaard, P. (2001). Customer satisfaction: Some results for L. (2010). Exploring customers’ store loyalty using the
Journal of Retailing and Consumer Services, 17, 395-405.
Shoppers’ satisfaction levels are not the only -232.
Mitchell, V. W. & Kiral, R. H. (1998). Primary and secondary store loyal customer perceptions of grocery retailers. British Food Journal, 100 (7), 312-319.
Murgulets, L., Eklof, J., Dukeov, I., & Selivanova, I. (2002). Customer satisfaction and retention in transition economies. Total Quality Management, 12 (7&8), 1037-1046. Piron, F. (2001). Effects of service and communication initiatives on retail grocery
consumers’ loyalty. Singapore Management Review, 45-60.
Oliver, R. L. (1997). Satisfaction: A Behavioral Perspective on the Consumer. Boston: Richard D. Irwin/McGraw-Hill.
Oliver, R. L. (1999). Whence consumer loyalty? Journal of Marketing, 63 (Special Issue), 33-44.
Reichheld, F. F. (1996). The Loyalty Effect. Boston: Harvard Business School Press.
Sawmong, S. & Ogenyy, O. (2004). The store loyalty of the U.K.’s retail consumers. The
Journal of American Academy of Business, Cambridge, September, 503-509.
Sivadas, E. & Baker-Prewitt, J. L. (2000). An examination of the relationship between service quality, customer satisfaction, and store loyalty. International Journal of Retail and
Distribution Management, 28 (2), 73-82.
Stark, M. & Ebenkamp, B. (1999). Brandweek, 40 (28), 16-17.
Stayman, D. M. & Deshpande, R. (1989). Situational ethnicity and consumer behavior.
Journal of Consumer Research, 16 (December), 361-371.
Straughan, R. D. & Albers-Miller, N. D. (2001). An International Investigation of Cultural and Demographic Effects on Domestic Retail Loyalty. International Marketing Review, 18 (5) 521-541.
Torres, E., Vasquez-Parraga, A. Z., & Barra, C. (2009). The path of patient loyalty and the role of doctor reputation. Health Marketing Quarterly, 26 (3): 183-197.
Tuckey, B. (2001), Luxury loyalty. BRW, 23 (17), 48.
Vasquez-Parraga, A. Z. & Alonso, S. (2000). Antecedents of customer loyalty for strategic intent. In J. P. Workman, Jr. & W. D. Perreault (Eds.) Marketing Theory and
Applications. Chicago: American Marketing Association.
Wadia, M. S. (1967). The concept of culture in the analysis of consumers. In R. Moyer (Ed.)
Changing Marketing Systems…Consumer, Corporate, and Government Interface, Winter Conference AMA Proceedings. Chicago: American Marketing Association.
Wong, A. & Sohal, A. (2003a). Service quality and customer loyalty perspectives on two levels of retail relationships. Journal of Services Marketing, 17 (5), 495-513.
Wong, A. & Sohal, A. (2003b). A critical incident approach to the examination of customer relationship management in a retail chain: An exploratory study. Qualitative Marketing
Research: An International Journal, 6 (4), 248-262.
Wong, A. (2004). The role of emotional satisfaction in service encounters. Managing Service
Quality, 14 (5), 365-376.
Zamora, J., Vasquez-Parraga, A. Z., Morales, F., & Cisternas, C. (2004). Formation process of guest loyalty: Theory and an empirical test. Studies and Perspectives in Tourism, 13 (3-4): 197 - 221.
Zamora, J., Vasquez-Parraga, A. Z., Rodriguez, A., & Gonzalez, A. (2011). Road travelers' motivations and loyalty: Train versus bus services. Journal of Travel and Tourism