UNIVERSITÀ DEGLI STUDI DI SASSARI
CORSO DI DOTTORATO DI RICERCA
Scienze Agrarie
Produttività delle piante coltivate
Ciclo XXIX
Anno accademico 2015- 2016
PAST EXPERIENCE SUPPORTS FUTURE CHOICES FOR CROPPING
SYSTEMS MANAGEMENT: THE ITALIAN LONG-TERM
AGRO-ECOSYSTEM EXPERIMENTS (LTAEs) THROUGH THE IC-FAR NETWORK
Ileana Iocola
Coordinatore del Corso
Prof. Antonello Cannas
Referente di Curriculum
Prof. Giovanna Attene
T
ABLE OF CONTENTS
Introduction……….1-4
Chapter1. Long effects of tillage practices and N fertilization in rainfed Mediterranean
cropping systems: durum wheat, sunflower and maize grain yield………5-32
Chapter 2. Conservation tillage can mitigate climate change impacts in Mediterranean
cereal systems: an integrated SOC assessment using long term experimental data
……….……….………..33-65
Ileana Iocola - Past experience supports future choices for cropping systems management: the Italian long-term agro-ecosystem experiments (LTAEs) through the IC-FAR network– Tesi di Dottorato in Scienze Agrarie – Curriculum “Produttività delle Piante Coltivate” –Ciclo XXIX
Università degli Studi di Sassari
Anno Accademico 2015- 2016 1
Introduction
The field experiments have always been considered of fundamental importance for agro-ecosystem understanding. But, although there are several long-term agroecosystem experiments (LTAE), short-term studies are much more common (Tilman 1989) because it is very difficult to sustain long-term experiments over the time. Furthermore, LTAEs are more susceptible to be interrupted because they required more organization and collaboration among scientists of different generations (Richter, 2007). The principal difference existing between long and short-term experiments is that LTAEs can provide insight into causes and magnitudes of changes occurring over the long-term processes, while short-term studies are mostly focused on the initial trajectories of the processes (Alan et al., 2012). For instance, the stock of soil organic carbon (SOC) changes very slowly because it is influenced by long-term processes and it can be detected with a 90% level of confidence after at least 6-10 years (Smith, 2004). Thus, data from long-term experimental sites are the only reliable ground proof for assessing these changes. Other than for understanding and linking short-term processes with longer temporal dynamics, data coming from LTAEs can be also considered reliable instruments to inform and validate mechanistic models for assessing the resilience of cropping systems and predict these dynamics across time or space.
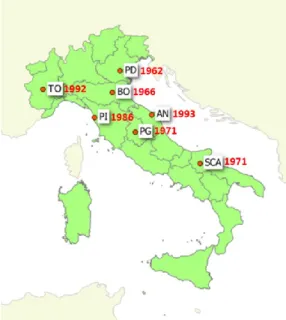
The three years (2013-2016) research project IC-FAR – “llnking long term observatories with Crop systems modeling For a better understanding of climate change impact and Adaptation stRategies for Italian cropping systems” (www.icfar.it), funded by the Italian Ministry of Education, University and Research (MIUR), was designed with the idea to ensure continuity to the Italian LTAEs and evaluate if the old LTAEs, designed many years ago, can provide opportunities to address nowadays research questions and challenges that were not part of the original motivation of the experiment (Roggero, 2016). Furthermore, the main objective of the IC-FAR project was to connect the LTAEs managers with the crop and climate modelling communities in order to create an ideal platform for model calibration and validation using the long term datasets and for better understanding of how cropping system management can adapt to and mitigate the impacts of climate changes. The IC-FAR project provided answers to these questions by collecting data and analyzing sixteen LTAEs located in six different locations (Fig. 1) over a Nord-South transect across Italy. These experiments were originally designed for a variety of different purposes, principally for studying the long term effects of different agronomic management strategies (i.e, tillage practices, type and rate of nitrogen fertilization, crop rotation schemes) on crop yield and SOC and nitrogen dynamics.
A common database (Ginaldi et al., 2016) was created to harmonize, assemble, ensure comparability and quality of data and make information readily available to the wider research community. The IC-FAR
Ileana Iocola - Past experience supports future choices for cropping systems management: the Italian long-term agro-ecosystem experiments (LTAEs) through the IC-FAR network– Tesi di Dottorato in Scienze Agrarie – Curriculum “Produttività delle Piante Coltivate” –Ciclo XXIX
Università degli Studi di Sassari
Anno Accademico 2015- 2016 2
database was designed in a way to be compatible with other international databases for model inter-comparison protocols proposed by international research modelling communities (i.e., AgMIP, Macsur) to which IC-FAR is linked. In fact, the IC-FAR partnership was composed by several Italian research teams (10 Universities - Basilicata, Bologna, Firenze, Marche, Padova, Perugia, Pisa, Sassari, Torino, Udine, the National Research Council - CNR Ibimet of Rome and the Agricultural Research Coucil - CRA SCA of Foggia) organized in a network with multiple international institutions from Europe and United States.
Fig. 1. Location of IC-FAR sites. The years of the establishment of the experiments are reported as labels
This PhD thesis was entirely developed in the IC-FAR framework, thus benefiting from the presence of numerous expertise in climate data management, advanced statistical analysis and crop modelling. Using the long-term experimental data of the IC-FAR project and integrating different methodological approaches such as data mining, multi model ensemble and future climate scenarios, it was evaluated the relevance of the long term datasets in generating new knowledge and understanding on processes that act at different temporal scales and how these processes interact with the environment and the agronomic management practices.
The work is divided into two chapters which in fact represent two different scientific papers. The first chapter reports a study that has been published during the PhD course on the European Journal of Agronomy (Seddaiu et al., 2016). In this study, using data from the LTAE located in Ancona and a recursive partitioning analysis (Strobl et al., 2009), we explored how long term tillage practices, N fertilization rate and their interaction with some meteorological factors (monthly temperatures and precipitations) can
Ileana Iocola - Past experience supports future choices for cropping systems management: the Italian long-term agro-ecosystem experiments (LTAEs) through the IC-FAR network– Tesi di Dottorato in Scienze Agrarie – Curriculum “Produttività delle Piante Coltivate” –Ciclo XXIX
Università degli Studi di Sassari
Anno Accademico 2015- 2016 3
explain the crop inter-annual yield variability in a cereal two-year rotation under rainfed Mediterranean conditions. The identification of the main key factors driving crop yields can be useful to target further research and to support adaptive crop management responses to climate variability and to design policy interventions for rainfed cropping systems in the Mediterranean areas. In particular in this work, the PhD student has contributed to design and contextualize the analysis of the data using the recursive repartition approach, to write the manuscript and to discuss the results.
The second chapter reports a study on SOC stock dynamics which has been already submitted to the European Journal of Agronomy. Conservation tillage practices are frequently proposed as mitigation strategies, because they can contribute to increase SOC compared to conventional mouldboard ploughing. We assessed the long-term effects of different tillage management practices on crop yield and SOC stock dynamics in Mediterranean rainfed cereal cropping systems under current and future climate scenarios, using two LTEs dataset (AN and PI2) taken from the IC-FAR database and an ensemble of four crop models (APSIM, DSSAT, EPIC, SALUS). The multi-model mean was able to better reproduce and with less uncertainty the SOC dynamics than each single model, hence better SOC predictions are also expected to occur in the future assessment. In this study, the PhD student has given a substantial contribution to the conception, design, analysis, interpretation of data, perform the simulations with DSSAT and SALUS models, and write the manuscript.
The different methodologies used in this thesis for the analysis of the available IC-FAR datasets have underlined the relevance and opportunities that LTAEs can provide in identifying the relevant factors (weather, management and their interaction) influencing the inter-annual variability of crop yields and in understanding the processes controlling agroecosystem long term dynamics of sustainability indicators such as SOC content in the topsoil. The long term datasets also showed to be an invaluable source of information for cropping system modelling approaches, as they allow a robust calibration of model simulations of the long-term sustainability of cropping systems. Crop models are the only available tools to predict and effectively assess the potential for adaptation/mitigation responses in addressing the resilience of agroecosystems to climate change pressures. Obviously, the longer an experiment is conducted, the more valuable it becomes as it can provide more variable conditions (e.g. weather extremes, pathogens) capturing also some infrequent extreme events. The changes of the environmental conditions over time could also support and produce new ideas and insights and feed new inspiring experiments.
Last but not least, the modelling approaches applied to the LTAEs datasets provided an opportunity for harmonizing the data collection protocols, which is a prerequisite for the networking of the experimental
Ileana Iocola - Past experience supports future choices for cropping systems management: the Italian long-term agro-ecosystem experiments (LTAEs) through the IC-FAR network– Tesi di Dottorato in Scienze Agrarie – Curriculum “Produttività delle Piante Coltivate” –Ciclo XXIX
Università degli Studi di Sassari
Anno Accademico 2015- 2016 4
sites and the further development of the fruitful interactions between the agronomic communities of modelers and LTAE managers.
References
Alan K. K., Smith D. M., Hobbie S.E., Collins S. L., Fahey T.J., Hansen G.J.A., Landis D.A., La Pierre K. J., Melillo J.M., Seastedt, T.R., Shaver G. R., Webster J.R., 2012. Past, Present, and Future Roles of Long-Term Experiments in the LTER Network. BioScience 62 (4), 377-389. doi: 10.1525/bio.2012.62.4.9
Ginaldi F., Bindi M., Dalla Marta A., Ferrise R., Orlandini S., Danuso F., 2016. Interoperability of agronomic long term experiment databases and crop model intercomparison: the Italian experience, Eur. J. Agron, 77, 209-222
Richter, D. deB., M. Hofmockel, M. A. Callaham, D. S. Powlson, and P. Smith. 2007. Long-Term Soil Experiments: Keys to Managing Earth's Rapidly Changing Ecosystems. Soil Sci. Soc. Am. J. 71:266-279. doi:10.2136/sssaj2006.0181
Roggero P.P., 2016. Introduction to the EJA special issue on "IC-FAR - Linking long term observatories with crop system modelling for a better understanding of climate change impact and adaptation strategies for Italian cropping systems". Eur. J. Agron, 77: 136-137
Seddaiu G., Iocola I., Farina R., Orsini R., Iezzi G., Roggero P.P., 2016. Long term effects of tillage practices and N fertilization in rainfed Mediterranean cropping systems: durum wheat, sunflower and maize grain yield. Eur. J. Agron, 77:166-178
Smith, P. 2004. How long before a change in soil organic carbon can be detected?. Global Change Biology, 10, 1878–1883. doi:10.1111/j.1365-2486.2004.00854.x
Strobl, C., Malley, J., Tutz, G., 2009. An Introduction to Recursive Partitioning: Rationale, Application, and Characteristics of Classification and Regression Trees, Bagging, and Random forests. Psychol. Methods. 14(4), 323-348.
Tilman D., 1989. Ecological experimentation: Strengths and conceptual problems. Likens GE, ed. Long-Term Studies in Ecology. Springer, 136–1
Ileana Iocola - Past experience supports future choices for cropping systems management: the Italian long-term agro-ecosystem experiments (LTAEs) through the IC-FAR network– Tesi di Dottorato in Scienze Agrarie – Curriculum “Produttività delle Piante Coltivate” –Ciclo XXIX
Università degli Studi di Sassari
Anno Accademico 2015- 2016 5
Ileana Iocola - Past experience supports future choices for cropping systems management: the Italian long-term agro-ecosystem experiments (LTAEs) through the IC-FAR network– Tesi di Dottorato in Scienze Agrarie – Curriculum “Produttività delle Piante Coltivate” –Ciclo XXIX
Università degli Studi di Sassari
Anno Accademico 2015- 2016 6
Long term effects of tillage practices and N fertilization in rainfed Mediterranean
cropping systems: durum wheat, sunflower and maize grain yield
Giovanna Seddaiua,b,∗, Ileana Iocolab, Roberta Farinac, Roberto Orsinid, Giuseppe Iezzid,Pier Paolo Roggeroa,b
a
Dipartimento di Agraria, University of Sassari, Viale Italia 39, 07100 Sassari, Italy; bNucleo di Ricerca sulla Desertificazione-NRD, University of Sassari,Viale Italia 39, 07100 Sassari, Italy; cCentro di ricerca per lo studio delle relazioni tra pianta e suolo, Consiglio per la Ricerca in Agricoltura, via della Navicella 2-4, Rome, Italy; dDipartimento di Scienze Agrarie Alimentari e Ambientali, Università Politecnica delle Marche, via Brecce Bianche, 60131 Ancona, Italy.
http://doi.org/10.1016/j.eja.2016.02.008
Abstract
Long term investigations on the combined effects of tillage systems and other agronomic practices such as mineral N fertilization under Mediterranean conditions on durum wheat are very scanty and findings are often contradictory. Moreover, no studies are available on the long term effect of the adoption of conservation tillage on grain yield of maize and sunflower grown in rotation with durum wheat under rainfed Mediterranean conditions. This paper reports the results of a 20-years experiment on a durum wheat-sunflower (7 years) and durum wheat–maize (13 years) two-year rotation, whose main objective was to quantify the long term effects of different tillage practices (CT = conventional tillage; MT = minimum tillage; NT = no tillage) combined with different nitrogen fertilizer rates (N0, N1, N2 corresponding to 0,45 and 90 kg N ha−1 for sunflower, and 0, 90 and 180 kg N ha−1 for wheat and maize) on grain yield, yield components and yield stability for the three crops. In addition, the influence of meteorological factors on the interannual variability of studied variables was also assessed. For durum wheat, NT did not allow substantial yield benefits leading to comparable yields with respect to CT in ten out of twenty years. For both sunflower and maize, NT under rainfed conditions was not a viable options, because of the unsuitable (i.e., too wet) soil conditions of the clayish soil at sowing. Both spring crops performed well with MT. No significant N × tillage interaction was found for the three crops. As expected, the response of durum wheat and maize grain yield to N was remarkable, while sunflower grain yield was not significantly influenced by N rate. Wheat yield was constrained by high temperatures in January during tillering and drought in April during heading. The interannual yield variability of sunflower was mainly associated to soil water deficit at flowering and air temperature during seed filling. Heavy rains during this latter phase strongly constrained sunflower grain yield. Maize grain yield was negatively affected by high temperatures in June and drought in July, this latter factor was particularly important in the fertilized maize. Considering both yield and yield stability, durum wheat and sunflower performed better under MT andN1 while maize performed better
Ileana Iocola - Past experience supports future choices for cropping systems management: the Italian long-term agro-ecosystem experiments (LTAEs) through the IC-FAR network– Tesi di Dottorato in Scienze Agrarie – Curriculum “Produttività delle Piante Coltivate” –Ciclo XXIX
Università degli Studi di Sassari
Anno Accademico 2015- 2016 7
under both CT and MT and with N2 rates. The results of this long term study are suitable for supporting policies on sustainable Mediterranean rainfed cropping systems and also for cropping system modelling.
Keywords: No tillage; Minimum tillage; Silty-clay soil; Yield stability; Recursive partitioning analysis; Rainfed
cropping systems
1. Introduction
Rainfed cereal cropping systems based on rotations between wheat and a spring crop are widespread in Mediterranean Europe. In the southern Mediterranean countries, winter cereals are grown as monoculture or in rotation with other autumn–spring crops such as pulses, fallow pasture, hay crops or other minor cereals. In the northern Mediterranean countries, the rainfall regime and the high water holding capacity of the arable soils allow the cultivation ofspring-summer crops such as sunflower, sorghum or maize under rainfed conditions. Conservation agricultural practices (CA) such as reduced or no tillage, characterized by a low disturbance of soil, coupled with crop residues retention, are increasingly widespread for cultivating cereals and industrial crops in the regions with dry Mediterranean climate (Kassam et al., 2012). CA in the Mediterranean dry areas can have positive effects on crop productivity due to increased soil moisture and nutrient availability (López-Garrido et al., 2011) and can contribute to reduce soil erosion, nitrate leaching, greenhouse gas emissions and fuel costs (Kassam et al., 2012). Site specific effects of CA (i.e., related to soil and climate types) on soil water retention (e.g., De Vita et al., 2007), soil aggregation stability (e.g.,Hernanz et al., 2002), microbial activity (Pastorelli et al., 2013) and weed dynamics (De Sanctis et al., 2012) can largely explain the various impacts of CA on crop yields. However, evidences on long term effects of CA practices on crop yield and stability are less frequent and sometimes contradictory. More than 50% of durum wheat cultivated worldwide lies in the Mediterranean region (Bozzini, 1988) where it represents one of the most important crops in rainfed cropping systems. In these areas, wheat grain yield is characterized by a high interannual variability due to erratic seasonal weather patterns, particularly irregular rainfall distribution and high temperatures during thegrain filling stage (Lopez-Bellido et al., 1996). Under rainfed semi-arid Mediterranean conditions, Amato et al. (2013) and Ruisi et al.(2014) showed that durum wheat yield was higher under no tillage than conventional tillage only when water stress was high and that N fertilizer requirements increase with no tillage compared with conventional tillage, because of changes in N cycling that lead to are duction in plant-available soil N. Sunflower, together with other oilseed crops, is recently drawing a renewed commercial and scientific attention because of its role as energy crop in the cereal-based cropping systems (Barontini et al., 2015 and references therein). Under Mediterranean
Ileana Iocola - Past experience supports future choices for cropping systems management: the Italian long-term agro-ecosystem experiments (LTAEs) through the IC-FAR network– Tesi di Dottorato in Scienze Agrarie – Curriculum “Produttività delle Piante Coltivate” –Ciclo XXIX
Università degli Studi di Sassari
Anno Accademico 2015- 2016 8
rainfed conditions, sunflower production is heavily constrained by summer water stress, hence it is practiced as a rainfed crop only in the clayey soil of the northern areas, where the spring-summer rainfall regime is favorable and soil water holding capacity can buffer crop water availability. Under Mediterranean rainfed conditions in southern Spain, CA did not exert a beneficial influence on sunflower grain yields (López-Bellido et al., 2003;Murillo et al., 1998), although a high interannual variability was observed, mainly influenced by soil water conditions throughout the crop cycle.CA practices may have site-specific impacts on rainfed grain maize yields. CA practices in well drained soils and under high N fertilization inputs and crop rotation may improve maize yield, and yield stability seems to be not significantly affected by reduced tillage (Rusinamhodzi et al., 2011). Rainfall was confirmed as the most important determinant of maize yield under rainfed conditions. The meta-analysis of Rusinamhodzi et al. (2011) clearly revealed that the success of CA in improving maize yields depends on the adoption of other good agronomic practices such as targeted site-specific fertilizer application, timely weeding and crop rotations. To our knowledge, no studies are available on the long term effect of conservation tillage on the productivity of rainfed maize and sunflower under Mediterranean conditions. The duration of such studies on sunflower ranged from one (Lopez-Garrido et al.,2014) to four years (López-Bellido et al., 2003). In the case of grain maize, the available long term studies on the role of tillage systems on yields are referred to a range of climate conditions, from a typical Northern-Central USA climate (Karlen et al., 2013), to the subhumid temperate climate in the Pampas of Argentina (Diaz-Zorita et al., 2002), to the semi-arid, subtropical climate of highlands of Central Mexico (Verhulst et al., 2011) and to the cold semi-arid and humid subtropical climate of Northern China (Wang et al., 2012), none of which comparable to the Mediterranean climate type. The long-term impact of conservation tillage practices for durum wheat under Mediterranean conditions was instead analysed by several scholars (e.g., Amato et al., 2013; Lopez-Bellido et al., 1996, 2000, 2001; Mazzoncini et al., 2008). However, findings were often contradictory due to differences among the experimental sites in terms of climatic conditions, soil type, management practices, agronomic history and duration of experiments. Hence the effectiveness of various tillage systems is highly site specific and the impact of yield-limiting factors may vary significantly depending on the environmental conditions and on the interactions between them and the management practices (Subedi and Ma, 2009). Moreover, very few long term investigations have been conducted to study the combined effects of tillage systems and other agronomic practices such as mineral N fertilization under Mediterranean conditions (Lopez-Bellido et al., 1996, 2001). In the context of rainfed cereal cropping systems of the clayey hills of central Italy, in approximately 300,000 ha of arable hill-slope land, the rotation of wheat and a spring-summer crop such as sunflower or maize implies about 8–9 months of intercropping period between the wheat harvest (early
Ileana Iocola - Past experience supports future choices for cropping systems management: the Italian long-term agro-ecosystem experiments (LTAEs) through the IC-FAR network– Tesi di Dottorato in Scienze Agrarie – Curriculum “Produttività delle Piante Coltivate” –Ciclo XXIX
Università degli Studi di Sassari
Anno Accademico 2015- 2016 9
July) and the seeding of sunflower (March) or maize (April). Because of the high soil clay content (up to 50%) and the seasonal rainfall/evapotranspiration regime, the main tillage under the conventional practice (i.e.,30–40 cm deep ploughing) is made in the summer, in order to exploit the structuring effect of thermal and water regimes in the soil during autumn–winter. Moreover, tillage practices during autumn may be difficult due to the high plasticity of the clayey soils when autumn is wet. Further harrowing is practiced during inter-cropping to prepare the maize or sunflower seedbed. Therefore, the conventional practice exposes the bare soil to erosion (Roggero and Toderi, 2002) and nitrate leaching (De Sanctis et al., 2009) during the wet and cool season. CA techniques including no tillage and reduced N fertilization rates can provide options to mitigate such undesirable processes, but are considered by farmers as not reliable enough to ensure yield targets and stability, particularly in the case of the spring–summer crops. In this paper we explore the implications for adopting CA practices from a Long Term Experiment (LTE) based on a two-year rotation of durum wheat and sunflower or maize under rainfed Mediterranean conditions and heavy clayey soils. The aims of this study were to (i) assess the long term influence of tillage systems and N fertilization rates on yield, yield components and stability of durum wheat, sunflower and maize under Mediterranean rainfed conditions of the hilly areas of Central Italy and (ii) analyse at what extent the meteorological factors can influence the interannual variability of yield for the three crops.
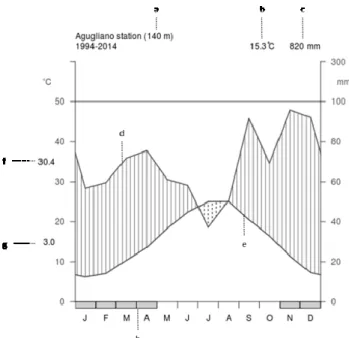
Fig. 1. Walter and Lieth climate diagram of Agugliano weather station. Period of observation: 1994–2014. (a) Elevation, (b) annual
average of temperature, (c) annual average of precipitation, (d) monthly mean temperatures, (e) monthly mean precipitation, (f) mean daily maximum temperature of the warmest month, (g) mean daily minimum temperature of the coldest month, (h) indication of potential frost periods (months with absolute monthly minimum temperature below 0◦C). Vertical lines: humid period, dotted area: dry period.
Ileana Iocola - Past experience supports future choices for cropping systems management: the Italian long-term agro-ecosystem experiments (LTAEs) through the IC-FAR network– Tesi di Dottorato in Scienze Agrarie – Curriculum “Produttività delle Piante Coltivate” –Ciclo XXIX
Università degli Studi di Sassari
Anno Accademico 2015- 2016 10 2. Materials and methods
2.1. Experimental site
The LTE is located at the “Pasquale Rosati” experimental farm of the Polytechnic University of Marche in Agugliano, Italy (43◦32_N,13◦22_E, 100 m a.s.l.), on a silty-clay soil classified as Calcaric Gleyic Cambisols (FAO, 2006), almost free of gravel, with a high clay (49%) and calcium carbonate (31%) content, pH of 8.3, a low soil organic carbon (SOC) content (0.7%) and a slope of about 10%. The climate of the experimental site is Mediterranean (Fig. 1), with a mean annual rainfall of 820 mm, mostly distributed in the autumn and winter (54%) and in the spring (24%). The mean air temperature is 15.3◦C, with monthly means ranging from 6.2◦C in January to 25◦C in August. The mean annual evapotranspiration (ET0), estimated at daily basis over the 20-years period with the FAO Penman–Monteith formula by using the computer tool ET0Calculator (Annandale et al., 2002), was 1068 mm (standard deviation (SD) = 75 mm), producing an average aridity index(Rain/ETo) of 0.76 (SD = 0.16).
2.2. Experimental design and crop management
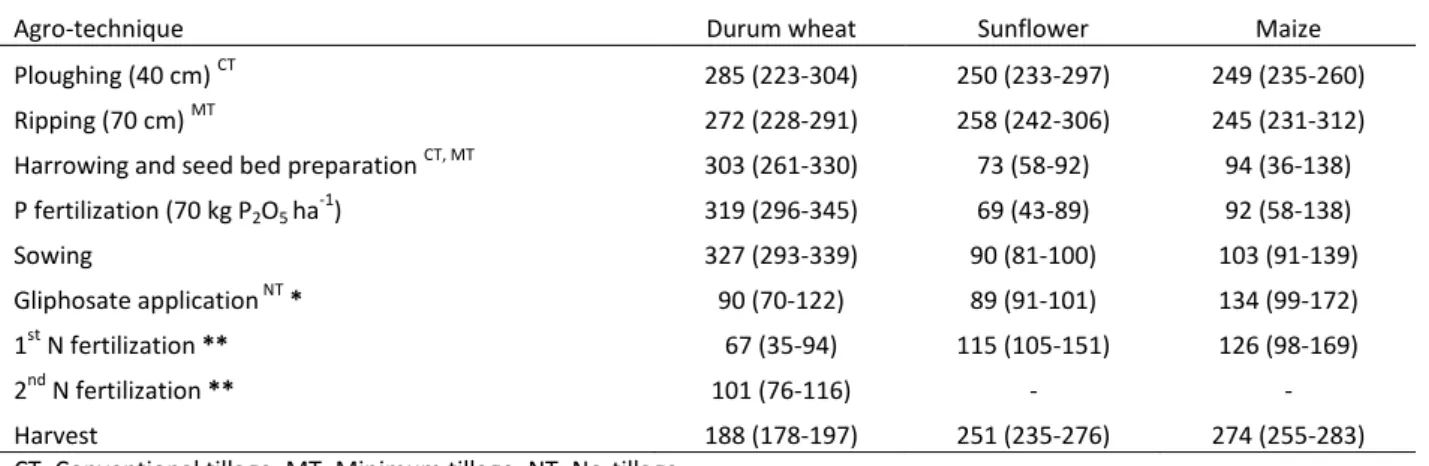
The LTE was established in 1994 and is still on-going consisting on a rainfed 2-years rotation with durum wheat (Triticum durum L. cv. Grazia, ISEA) in rotation with sunflower (Helianthus annuus L.,cv. Starsol, ISEA) until 2001 or maize (Zea mays L., DK440 hybrid, Dekalb Monsanto, FAO class 300) from 2002 onwards. The crop rotation was duplicated in two adjacent fields to allow for all crops to be present each year. Within each field, three tillage (T, main plot,1500 m2) and three nitrogen fertilizer (N, sub-plot, 500 m2) treatments were repeated in the same plots every year and arranged according to a split plot experimental design with two replications. The conventional tillage (CT), that is representative of the business as usual tillage practice in the study area, and the minimum tillage (MT) plots were ploughed along the maximum slope every year by a mouldboard (with 2 plows) at a depth of 40 cm or a chisel at a depth of 25 cm respectively in autumn for wheat and in summer for maize. The seedbed was prepared with double harrowing before the sowing date. The no tillage (NT) soil was left undisturbed except for crop residues and weed chopping and total herbicide spraying prior to direct seed drilling. The three N fertilizer treatments (N0,N1 and N2) corresponded to 0, 90 and 180 kg N ha−1 distributed in two rates for wheat and at seeding for maize, while sunflower received 0, 45 and 90 kg N ha−1 about one month after sowing. The N1 treatment was compliant with the agri-environmental measures adopted within the Rural development Plans at local scale. The N2 treatment was the business as usual N rates in the study area at the start of the experiment. The N0 treatment was chosen as a control. Dates of the agronomic management practices for all the three crops are reported in Table 1.
Ileana Iocola - Past experience supports future choices for cropping systems management: the Italian long-term agro-ecosystem experiments (LTAEs) through the IC-FAR network– Tesi di Dottorato in Scienze Agrarie – Curriculum “Produttività delle Piante Coltivate” –Ciclo XXIX
Università degli Studi di Sassari
Anno Accademico 2015- 2016 11 2.3. Measurements
At crop maturity, grain yield for all the studied crops was measured in each plot through combine harvesters and it was expressed on a dry matter content basis. Twenty (1995–2014), seven (1995–2001) and thirteen (2002–2014) years of grain yield data were collected respectively for durum wheat, sunflower and maize. Yield components were determined on thirteen (1995–2001, 2007–2008, 2011–2014), seven (1995–2001) and nine (2002–2003, 2006–2008, 2011–2014) years respectively for durum wheat, sunflower and maize. For durum wheat, the number of spikes m−2 was determined by counting the number of spikes along two adjacent 1-m long rows. The grain weight per spike and the 100 grains weight were estimated on 30 spikes randomly collected per subplot. For sunflower and maize, yield components were assessed on three random samples per subplot of 10 plants each for a total of 30 plants sampled in each subplot.
Table 1. Number of days from the first of January (median, minimum and maximum) of the agronomic management practices
adopted during the experimental years.
Agro-technique Durum wheat Sunflower Maize
Ploughing (40 cm) CT 285 (223-304) 250 (233-297) 249 (235-260) Ripping (70 cm) MT 272 (228-291) 258 (242-306) 245 (231-312) Harrowing and seed bed preparation CT, MT 303 (261-330) 73 (58-92) 94 (36-138) P fertilization (70 kg P2O5 ha -1 ) 319 (296-345) 69 (43-89) 92 (58-138) Sowing 327 (293-339) 90 (81-100) 103 (91-139) Gliphosate application NT * 90 (70-122) 89 (91-101) 134 (99-172) 1st N fertilization ** 67 (35-94) 115 (105-151) 126 (98-169) 2nd N fertilization ** 101 (76-116) - - Harvest 188 (178-197) 251 (235-276) 274 (255-283)
CT: Conventional tillage; MT: Minimum tillage; NT: No-tillage
*at a rate of 2.25 l ha-1
** for durum wheat 50 % of N distribution for each date
For each plant the grains weight per inflorescence and the 100 grains weight were determined. Plant density of sunflower and maize was determined by counting the number of plants along two adjacent 10-m long rows. Meteorological data were obtained from the Agugliano (43◦32_N, 13◦22_E, elevation: 140 m) weather station of the Agrometeorological Regional Service of Marche (ASSAM) that is located nearby the experimental site. E-OBS dataset (Haylock et al.,2008) from the EU-FP6 project ENSEMBLES (http://ensembles-eu.metoffice.com) was used for retrieval of the missing data related to daily precipitations, minimum and maximum temperatures.
Ileana Iocola - Past experience supports future choices for cropping systems management: the Italian long-term agro-ecosystem experiments (LTAEs) through the IC-FAR network– Tesi di Dottorato in Scienze Agrarie – Curriculum “Produttività delle Piante Coltivate” –Ciclo XXIX
Università degli Studi di Sassari
Anno Accademico 2015- 2016 12 2.4. Data analyses
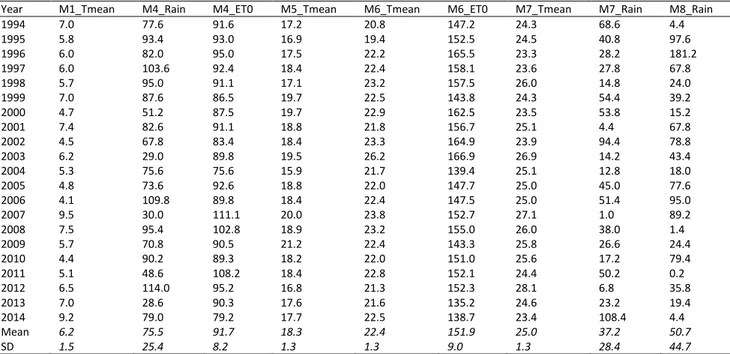
All data were submitted to the PROC MIXED procedure in SAS (SAS Institute, 1999), suitable for analyzing mixed effects and repeated measures with non-constant variance and any covariance structure models. The independence assumption on the error terms required for the ANOVA of a factorial model (Montgomery, 1997) was in fact likely not met. The appropriate mixed model was built following Onofri et al., 2016 and considering “year” as a repeated factor and for each year, tillage (T) and N fertilisation (N) as randomised treatment factors. The appropriate variance–covariance structure for this particular model was selected fitting all possible models and making an ‘a posteriori’ selection, based on those statistics which put a penalty on ‘complexity’, such as the Akaike Information Criterion (AIC: Akaike, 1974). For assessing the yield stability over the experimental years, the Shukla’s (1972) stability variance was calculated by applying the R code reported by Onofri et al., 2016. The closer to zero is the Shukla’s stability variance the more stable is the yield. We tested the null hypothesis of any grain yield trend over time associated to the repeated T and N fertilization treatments by fitting a simple linear regression of yield vs. years as suggested by Piepho et al. (2014) The treatment (T × N) effect was regarded as fixed as well as the treatment-dependent slopes, while the year effect and the year × treatment interactions as random. The robustness of this analysis increases with the duration of the experiment (Onofri et al., 2016), hence is higher for the durum wheat experiment than for maize (13-years trial). For this reason, this analysis was not performed for sunflower. For all the studied crops, three agro-meteorological variables were calculated and analysed on monthly basis starting from sowing until crop harvest: mean temperature (Tmean), rainfall amount (Rain) and cumulated reference evapotranspiration (ET0). Linear correlation coefficients (Pearson r) were then used to determine the effect of each meteorological variable on yields considering both yields of all treatments and yields related to each singular management factor (CT, MT, NT and N0, N1, N2). Only the meteorological variables that were statistically significant in at least one treatment, together with the categorical factors T and N, were submitted as inputs in a recursive partitioning analysis. The inter-annual variability of these variables is shown in Table 2. The recursive partition explores the structure of a dataset, developing decision rules for predicting a categorical (classification tree) or continuous (regression tree) variable (Rokach and Maimon, 2008; Strobl et al., 2009). In our study, we used the regression tree function
ctree available in the party R package (Hothorn et al., 2006) to explore the variation of yield as influenced
by several explanatory (meteorological and management) variables. Regression trees are constructed by recursively splitting the response variable (i.e., grain yield) into two groups on the basis of the explanatory variables (Tmean, Rain, ET0) so as to minimize variability within a group and maximizing variability between groups. At the end, the terminal node (leaves) is characterized by the mean values of the response variable.
Ileana Iocola - Past experience supports future choices for cropping systems management: the Italian long-term agro-ecosystem experiments (LTAEs) through the IC-FAR network– Tesi di Dottorato in Scienze Agrarie – Curriculum “Produttività delle Piante Coltivate” –Ciclo XXIX
Università degli Studi di Sassari
Anno Accademico 2015- 2016 13 Ctree function bases its node splitting on statistical tests providing a P value for the significance of its
splitting. Although ctree was used in this study just to explore the interactions among explanatory variables and not as a predictive tool, we estimated anyway the performance of the regression using the root-mean-square error (RMSE) and the mean absolute error (MAE).
RMSE was calculated as:
n y y RMSE n i obsi modeli
1 2 , , ) (and MAE was given by:
n y y MAE n i obsi modeli
1| , , |where yobs is the observed crop yield, ymodel is the modelled yield at yeari and n is the number of observations.
Table 2. Annual variability of the monthly statistically significant meteorological variables selected by ctree tool for the three
studied crops. Period of observation: 1994-2014.
Year M1_Tmean M4_Rain M4_ET0 M5_Tmean M6_Tmean M6_ET0 M7_Tmean M7_Rain M8_Rain
1994 7.0 77.6 91.6 17.2 20.8 147.2 24.3 68.6 4.4 1995 5.8 93.4 93.0 16.9 19.4 152.5 24.5 40.8 97.6 1996 6.0 82.0 95.0 17.5 22.2 165.5 23.3 28.2 181.2 1997 6.0 103.6 92.4 18.4 22.4 158.1 23.6 27.8 67.8 1998 5.7 95.0 91.1 17.1 23.2 157.5 26.0 14.8 24.0 1999 7.0 87.6 86.5 19.7 22.5 143.8 24.3 54.4 39.2 2000 4.7 51.2 87.5 19.7 22.9 162.5 23.5 53.8 15.2 2001 7.4 82.6 91.1 18.8 21.8 156.7 25.1 4.4 67.8 2002 4.5 67.8 83.4 18.4 23.3 164.9 23.9 94.4 78.8 2003 6.2 29.0 89.8 19.5 26.2 166.9 26.9 14.2 43.4 2004 5.3 75.6 75.6 15.9 21.7 139.4 25.1 12.8 18.0 2005 4.8 73.6 92.6 18.8 22.0 147.7 25.0 45.0 77.6 2006 4.1 109.8 89.8 18.4 22.4 147.5 25.0 51.4 95.0 2007 9.5 30.0 111.1 20.0 23.8 152.7 27.1 1.0 89.2 2008 7.5 95.4 102.8 18.9 23.2 155.0 26.0 38.0 1.4 2009 5.7 70.8 90.5 21.2 22.4 143.3 25.8 26.6 24.4 2010 4.4 90.2 89.3 18.2 22.0 151.0 25.6 17.2 79.4 2011 5.1 48.6 108.2 18.4 22.8 152.1 24.4 50.2 0.2 2012 6.5 114.0 95.2 16.8 21.3 152.3 28.1 6.8 35.8 2013 7.0 28.6 90.3 17.6 21.6 135.2 24.6 23.2 19.4 2014 9.2 79.0 79.2 17.7 22.5 138.7 23.4 108.4 4.4 Mean 6.2 75.5 91.7 18.3 22.4 151.9 25.0 37.2 50.7 SD 1.5 25.4 8.2 1.3 1.3 9.0 1.3 28.4 44.7
Tmean= mean monthly temperature (°C), Rain = monthly precipitation (mm), ET0 = cumulated monthly reference evapotranspiration (mm), M = Month from 1 (January) to 8 (August).
3. Results
3.1. Durum wheat yield, yield components and yield stability
Significant year × T and year × N interactions were observed, while no significant T × N interaction was observed (Table 3). Grain yields ranged from 1.3 (CT 2004) to 5.0 t ha−1(CT 2013) and from 0.6 (N0 2007) to
Ileana Iocola - Past experience supports future choices for cropping systems management: the Italian long-term agro-ecosystem experiments (LTAEs) through the IC-FAR network– Tesi di Dottorato in Scienze Agrarie – Curriculum “Produttività delle Piante Coltivate” –Ciclo XXIX
Università degli Studi di Sassari
Anno Accademico 2015- 2016 14
5.9 t ha−1(N2 2004). Grain yield under NT was significantly higher than CT in one out of twenty years, while CT and NT were not significantly different in ten out of twenty years (Table 4). MT differed significantly from CT in eight out of twenty years being significantly higher and lower in three and five years respectively. Wheat grain yields were higher under MT than NT in seven out of twenty years throughout the experiment. N2 showed higher grain yields than N1 in sixteen out of twenty years. Among the four years with no significant differences between N2 and N1, two years were the least productive ones.
On average, NT resulted in lower spikes m−2 than MT and CT by about −13% (313 vs. 359). A significant relationship was found between spikes m−2 and grain yield independently of the tillage treatment averaged for all N levels, while the same relationship was significant only for N2 (Fig. 2). The number of kernels per spike and the 100 kernels weight were significantly influenced by the tillage × year and nitro-gen × year interactions (Table 3). The number of kernels per spike ranged between 21 and 42 with NT showing a slight higher value than CT and MT (33 vs. 29). In 70% of the years when the number of kernels per spike was determined, N2 had about 6 kernels per spike more (+20%) than N1. In about half of the years, 100 kernels weight showed significant higher values under NT than CT.
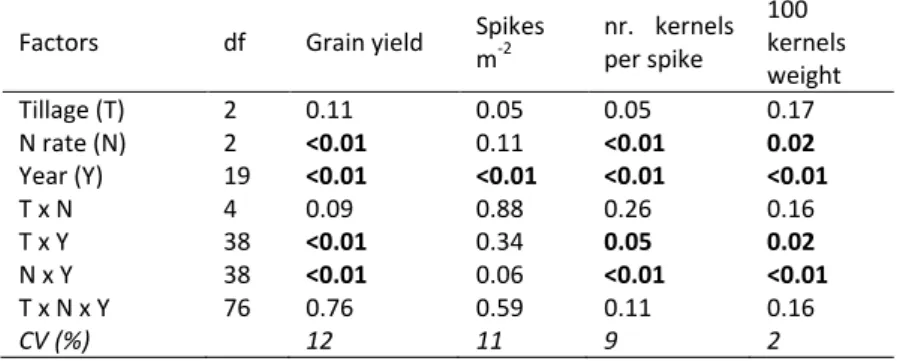
Table 3. Results of the repeated measures mixed model for durum wheat traits. Bold numbers in columns indicate significant P
values (≤ 0.05) of the F tests.
Factors df Grain yield Spikes m-2 nr. kernels per spike 100 kernels weight Tillage (T) 2 0.11 0.05 0.05 0.17 N rate (N) 2 <0.01 0.11 <0.01 0.02 Year (Y) 19 <0.01 <0.01 <0.01 <0.01 T x N 4 0.09 0.88 0.26 0.16 T x Y 38 <0.01 0.34 0.05 0.02 N x Y 38 <0.01 0.06 <0.01 <0.01 T x N x Y 76 0.76 0.59 0.11 0.16 CV (%) 12 11 9 2
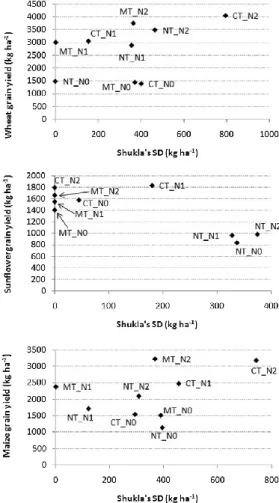
The stability analysis (Fig. 3) showed that the most productive treatment (CT N2) was the least stable in terms of grain yield, while CT N1 and, even more, MT N1 characterized by intermediate yields were the most stable. Also NT N0 had very stable grain yields that were however associated to low yields. No significant time trend was found for grain yield for any of the T × N fertilization combinations.
The correlation analysis between the meteorological variables and grain yield selected the following significant variables (Table 5): mean temperature of January (M1 Tmean), mean temperature (M3 Tmean) and rainfall (M3 RAIN) of March, mean temperature (M4 Tmean), rainfall (M4 RAIN) and reference evapotranspiration (M4 ET0) of April and mean temperature of May (M5 Tmean).
Ileana Iocola - Past experience supports future choices for cropping systems management: the Italian long-term agro-ecosystem experiments (LTAEs) through the IC-FAR network– Tesi di Dottorato in Scienze Agrarie – Curriculum “Produttività delle Piante Coltivate” –Ciclo XXIX
Università degli Studi di Sassari
Anno Accademico 2015- 2016 15
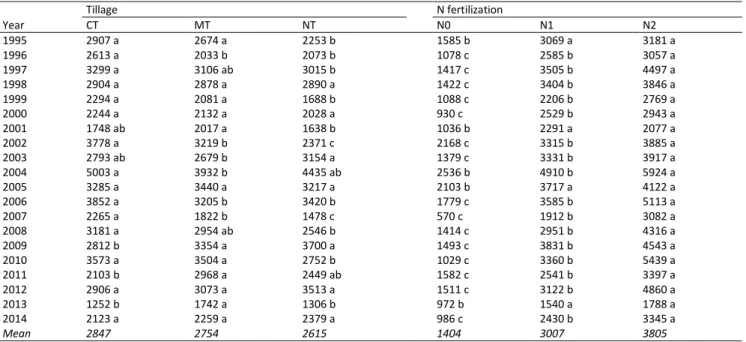
Table 4. Durum wheat grain yield (kg ha-1) as influenced by tillage and N fertilization systems over twenty years.
Tillage N fertilization Year CT MT NT N0 N1 N2 1995 2907 a 2674 a 2253 b 1585 b 3069 a 3181 a 1996 2613 a 2033 b 2073 b 1078 c 2585 b 3057 a 1997 3299 a 3106 ab 3015 b 1417 c 3505 b 4497 a 1998 2904 a 2878 a 2890 a 1422 c 3404 b 3846 a 1999 2294 a 2081 a 1688 b 1088 c 2206 b 2769 a 2000 2244 a 2132 a 2028 a 930 c 2529 b 2943 a 2001 1748 ab 2017 a 1638 b 1036 b 2291 a 2077 a 2002 3778 a 3219 b 2371 c 2168 c 3315 b 3885 a 2003 2793 ab 2679 b 3154 a 1379 c 3331 b 3917 a 2004 5003 a 3932 b 4435 ab 2536 b 4910 b 5924 a 2005 3285 a 3440 a 3217 a 2103 b 3717 a 4122 a 2006 3852 a 3205 b 3420 b 1779 c 3585 b 5113 a 2007 2265 a 1822 b 1478 c 570 c 1912 b 3082 a 2008 3181 a 2954 ab 2546 b 1414 c 2951 b 4316 a 2009 2812 b 3354 a 3700 a 1493 c 3831 b 4543 a 2010 3573 a 3504 a 2752 b 1029 c 3360 b 5439 a 2011 2103 b 2968 a 2449 ab 1582 c 2541 b 3397 a 2012 2906 a 3073 a 3513 a 1511 c 3122 b 4860 a 2013 1252 b 1742 a 1306 b 972 b 1540 a 1788 a 2014 2123 a 2259 a 2379 a 986 c 2430 b 3345 a Mean 2847 2754 2615 1404 3007 3805
Means within a row for tillage and N fertilization factors separately that are followed by the same letter are not significantly different at P ≤ 0.05.
Fig. 2. Relationships between mean grain yield and spikes m−2 for durum wheat as influenced by tillage techniques (top) or by N fertilization rates (bottom). Data on spikes m−2 are referred to thirteen years from 1995 to 2001, from 2007 to 2008 and from 2011 to 2014.
Ileana Iocola - Past experience supports future choices for cropping systems management: the Italian long-term agro-ecosystem experiments (LTAEs) through the IC-FAR network– Tesi di Dottorato in Scienze Agrarie – Curriculum “Produttività delle Piante Coltivate” –Ciclo XXIX
Università degli Studi di Sassari
Anno Accademico 2015- 2016 16
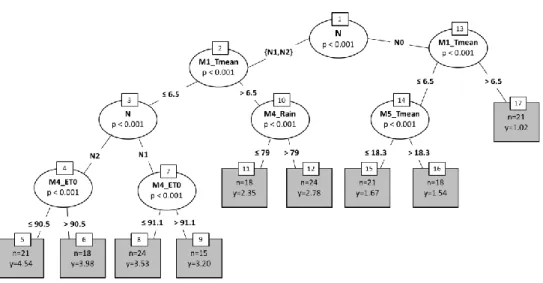
The decision tree obtained considering these significant meteorological variables, together with T and N factors, is reported in Fig. 4. The first important factor was N fertilization, with N0 associated to the lowest yields. M1 Tmean was the second most important factor independently of the N fertilization rate, and 6.5◦C represented the partitioning threshold. The group identified by N2 and N1 and M1 Tmean ≤ 6.5◦C was further split according to the N fertilization rate and both subgroups obtained were divided by a M4 ET0 value of 91 mm. Other important meteorological factors were M4 Rain for the group firstly identified by N2and N1 and M1 Tmean > 6.5◦C, and the M5 Tmean for the group identified by N0 and M1 Tmean ≤ 6.5◦C. The lowest wheat grain yield was associated to N0 and M1 Tmean > 6.5◦C, while the highest yield to M1 Tmean ≤ 6.5◦C, N2 and M4 ET0 ≤ 91 mm. The two indicators of the model performance RMSE and MAE were respectively 694 kg ha−1and 525 kg ha−1. Similarly to what found with the mixed model analysis, the effect of tillage on wheat grain yield was not significant also for the decisional tree approach.
Ileana Iocola - Past experience supports future choices for cropping systems management: the Italian long-term agro-ecosystem experiments (LTAEs) through the IC-FAR network– Tesi di Dottorato in Scienze Agrarie – Curriculum “Produttività delle Piante Coltivate” –Ciclo XXIX
Università degli Studi di Sassari
Anno Accademico 2015- 2016 17
Table 5. Correlation coefficients among wheat grain yields and selected monthly meteorological variables.
ALL N2 N1 N0 CT MT NT M1_Tmean -0.30 *** -0.43 *** -0.52 *** -0.52 *** -0.29 * -0.32 * -0.30 * M3_Tmean -0.20 ** -0.30 * -0.34 ** -0.34 ** -0.23 -0.15 -0.23 M3_RAIN -0.16 * -0.14 -0.37 ** -0.31 * -0.18 -0.11 -0.20 M4_Tmean -0.20 ** -0.23 -0.43 *** -0.35 ** -0.25 -0.16 -0.19 M4_RAIN 0.23 ** 0.43 *** 0.36 ** 0.24 0.24 0.20 0.24 M4_ET0 -0.18 * -0.20 -0.37 ** -0.32 * -0.20 -0.12 -0.21 M5_Tmean -0.15 * -0.20 -0.22 -0.33 * -0.18 -0.11 -0.15
where ALL = yields of all treatments; N2, N1, N0 = yields for 180, 90, 0 kg N ha-1; CT= yields for conventional tillage; MT = yields for minimum tillage; NT = yields for no tillage; M = Month from 1 (January) to 5 (May).
*: significant at P ≤ 0.05; **: P ≤ 0.01; ***: P ≤ 0.001.
Fig. 4. Regression tree showing the emerging drivers of the durum wheat grain yield interannual variation: meteorological variables
(Tmean = mean monthly temperature, RAIN = monthly precipitation, ET0 = cumulate monthly reference evapotranspiration; M = month from 1-January to 5-May) and N fertilization rate (0, 90, 180 N kg ha−1). n = number of observations and y = t ha−1) in each terminal node.
Table 6. Results of the repeated measures mixed model for sunflower traits. Bold numbers in columns indicate significant P values
(≤ 0.05) of the F tests.
Factors df Grain yield Plants m-2 Achenes weight per flower head 1,000 achenes weight Tillage (T) 2 0.01 <0.01 0.14 0.06 N rate (N) 2 0.10 0.69 0.04 0.05 Year (Y) 6 <0.01 <0.01 <0.01 0.01 T x N 4 0.61 0.91 0.33 0.42 T x Y 12 <0.01 <0.01 <0.01 <0.01 N x Y 12 0.66 0.74 0.88 0.10 T x N x Y 24 0.97 0.93 0.77 0.03 CV (%) 17 14 17 7
Ileana Iocola - Past experience supports future choices for cropping systems management: the Italian long-term agro-ecosystem experiments (LTAEs) through the IC-FAR network– Tesi di Dottorato in Scienze Agrarie – Curriculum “Produttività delle Piante Coltivate” –Ciclo XXIX
Università degli Studi di Sassari
Anno Accademico 2015- 2016 18
Table 7. Sunflower grain yield (kg ha-1) as influenced by tillage and N fertilization systems over seven years.
Tillage N fertilization Year CT MT NT N0 N1 N2 1995 1366 a 564 b 415 b 653 804 887 1996 883 a 640 b 266 c 593 599 597 1997 1419 a 1138 b 1374 ab 1179 1390 1362 1998 3270 a 3106 a 1982 b 2415 3037 2906 1999 2350 a 2113 a 1327 b 1641 1931 2218 2000 1888 a 1789 a 457 b 1219 1401 1514 2001 1271 a 1339 a 498 b 860 1040 1207 Mean 1778 1527 903 1223 1457 1527
Means within a row for the tillage factor that are followed by the same letter are not significantly different at P ≤ 0.05.
3.2. Yield, yield components and yield stability in sunflower
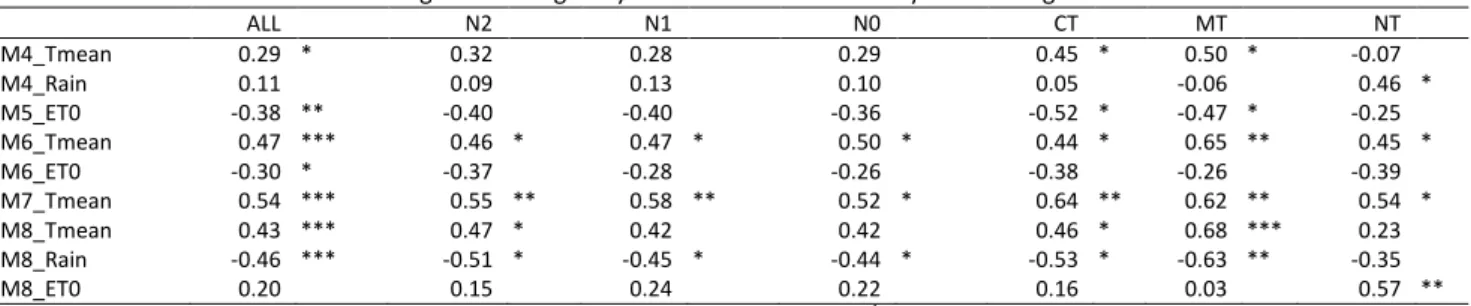
Sunflower grain yield showed a high interannual variability ranging from 0.6 to 2.8 t ha−1 (Table 6). A significant year × T interaction was found while no effect of N was observed (Table 6). Grain yield under NT was always significantly lower than CT (Table 7) except for one year out of seven (1997). In the last four years of sunflower cultivation, MT showed similar yields to CT and higher than NT. Plants m−2, achenes weight per flower head and the 1000 achenes weight showed a significant T × year interaction (Table 6). On average (data not shown), under NT the number of plants per m−2 were lower by 54% than CT (2.6 vs 5.6). In two out of seven years (1996 and 1998), the number of plants per m−2 under NT was more than 80% lower than under CT. Under MT, plant density was significantly lower than under CT in six out of seven years, on average−12% (from −3 to −18%), while it was slightly higher only in 1998. The achenes weight per flower head (data not shown) ranged from 8.6 to 67.7 g under NT in 1995 and CT in 1999 respectively. However, on average, NT showed a +13% higher achenes weight per flower head with respect to CT. The results of the stability analysis (Fig. 3) showed that CT N2 and MT N2 were on average the most productive treatments and, at the same time, with the least unstable yields. All the NT treatments independently of the N fertilizer rate had the lowest stability. The correlation analysis between sunflower grain yields and the meteorological variables selected the following significant variables (Table 8): mean temperature (M4 Tmean) and precipitation (M4 Rain) of April, the reference evapotranspiration of May (M5 ET0), the mean temperature (M6 Tmean) and reference evapotranspiration of June (M6 ET0), mean temperature of July (M7 Tmean), mean temperature (M8 Tmean), precipitation (M8 Rain) and reference evapotranspiration (M8 ET0) of August. The significant meteorological variables together with N and T factors were used as input in the regression tree analysis illustrated in Fig. 5. The first most important factor was M7 Tmean followed by the T factor with higher sunflower yields associated to CT and MT. This group was further split according to a threshold value of 39.2 mm for the M8 Rain, while the NT group was split according to the M6 ET0. The highest sunflower grain yield was associated to M7 Tmean ≤ 25.1◦C, CT or MT and M8 Rain ≤ 39.2 mm, while the lowest yield to M7 Tmean ≤ 25.1◦C, NT and M6 ET0 > 156.7 mm.
Ileana Iocola - Past experience supports future choices for cropping systems management: the Italian long-term agro-ecosystem experiments (LTAEs) through the IC-FAR network– Tesi di Dottorato in Scienze Agrarie – Curriculum “Produttività delle Piante Coltivate” –Ciclo XXIX
Università degli Studi di Sassari
Anno Accademico 2015- 2016 19
The performance indicators RMSE and MAE were respectively475 kg ha−1 and 398 kg ha−1. According to what found with the mixed model analysis, the N fertilization rate was not considered a significant explanatory variable also in the recursive partition approach.
Table 8. Correlation coefficients among sunflower grain yields and selected monthly meteorological variables.
ALL N2 N1 N0 CT MT NT M4_Tmean 0.29 * 0.32 0.28 0.29 0.45 * 0.50 * -0.07 M4_Rain 0.11 0.09 0.13 0.10 0.05 -0.06 0.46 * M5_ET0 -0.38 ** -0.40 -0.40 -0.36 -0.52 * -0.47 * -0.25 M6_Tmean 0.47 *** 0.46 * 0.47 * 0.50 * 0.44 * 0.65 ** 0.45 * M6_ET0 -0.30 * -0.37 -0.28 -0.26 -0.38 -0.26 -0.39 M7_Tmean 0.54 *** 0.55 ** 0.58 ** 0.52 * 0.64 ** 0.62 ** 0.54 * M8_Tmean 0.43 *** 0.47 * 0.42 0.42 0.46 * 0.68 *** 0.23 M8_Rain -0.46 *** -0.51 * -0.45 * -0.44 * -0.53 * -0.63 ** -0.35 M8_ET0 0.20 0.15 0.24 0.22 0.16 0.03 0.57 **
where ALL = yields of all treatments; N2, N1, N0 = yields for 180, 90, 0 kg N ha-1; CT= yields for conventional tillage; MT = yields for minimum tillage; NT = yields for no tillage; M = Month from 1 (January) to 5 (May).
*: significant at P ≤ 0.05; **: P ≤ 0.01; ***: P ≤ 0.001.
Fig. 5. Regression tree showing the emerging drivers of the sunflower grain yield interannual variation: meteorological variables
(Tmean = mean monthly temperature; RAIN = monthly precipitation; M = month from 6-June to 8-August) and management factors (T—Tillage: CT = conventional tillage, MT = minimum tillage; NT = no tillage). n = number of observations and y = mean yield (t ha−1) in each terminal node.
3.3. Yield, yield components and yield stability in maize
Maize grain yield showed an irregular pattern over the thirteen years period ranging from very low values (2003 and 2007 for NT) up to 5.0 t ha−1 (2012 for MT). The interactions between both year × T and year × N were significant (Table 9). In 2003 and 2007, grain yields under NT were almost zero, due to the very low plant density that did not allow mechanical harvest (Table 10). In more than half of the years, NT showed a lower yield than CT (−40%). MT differed significantly from CT in eight out of thirteen years being significantly higher and lower in four years respectively. N2 showed comparable grain yields to N1 in 30% of years. N1 in none of the years showed significantly higher yield than N2.In terms of plants m−2, NT showed
Ileana Iocola - Past experience supports future choices for cropping systems management: the Italian long-term agro-ecosystem experiments (LTAEs) through the IC-FAR network– Tesi di Dottorato in Scienze Agrarie – Curriculum “Produttività delle Piante Coltivate” –Ciclo XXIX
Università degli Studi di Sassari
Anno Accademico 2015- 2016 20
always lower values (3.4 plants m−2) by about −45% (from −20% to −96%) compared to CT and MT (data not shown). Plant density was positively correlated with grain yield (Fig. 6) with data grouped by T treatments. By considering the relationship with data grouped by N treatments, a weaker correlation was found (r = 0.54, P = 0.003). The 100 grains weight was significantly influenced by T × year interaction (Table 9) and ranged from 7.7 g (MT 2014) to 24.1 g (NT2008) with a mean of 18.5 g. No significant differences were found among T treatments along the experimental period with the exception of 2008 when 100 grains weight was +11% higher in NT than in CT and MT.
Table 9. Results of the repeated measures mixed model for maize traits. Bold numbers in columns indicate significant P values (≤
0.05) of the F tests. Factors df Grain yield Plants m-2 100 grains weight Tillage (T) 2 0.05 <0.01 0.09 N rate (N) 2 <0.01 0.26 0.67 Year (Y) 12 <0.01 <0.01 <0.01 T x N 4 0.26 0.64 0.44 T x Y 22 <0.01 <0.01 <0.01 N x Y 24 0.02 0.02 0.41 T x N x Y 44 0.99 0.07 0.51 CV% 24 7 3
Table 10. Maize grain yield (kg ha-1) as influenced by tillage and N fertilization systems over thirteen years
Year CT MT NT N0 N1 N2 2002 1612 a 881 b 1159 ab 715 b 1322 a 1614 a 2003 637 a 497 a 25 b 544 a 508 a 649 a 2004 1565 a 1757 a 854 b 1097 b 1428 ab 1651 a 2005 4453 a 2836 b 1791 c 2072 c 3073 b 3935 a 2006 2165 b 2798 a 1520 c 1330 b 1828 b 3325 a 2007 1256 a 792 b 28 c 545 c 1047 b 1479 a 2008 2064 a 2268 a 1918 a 1208 c 2250 b 2793 a 2009 3430 a 2903 b 2249 c 1883 c 2824 b 3876 a 2010 2032 b 2859 a 2358 ab 1523 c 2453 b 3273 a 2011 2320 a 2219 ab 1642 b 1222 c 2110 b 2849 a 2012 3778 b 4956 a 4919 a 3509 c 4556 b 5588 a 2013 1480 a 1549 a 661 b 611 b 1334 a 1745 a 2014 3810 b 4514 a 3667 b 2333 c 4379 b 5279 a Mean 2354 2371 1489 1430 2307 2927
Means within a row for tillage and N fertilization factors separately that are followed by the same letter are not significantly different at P ≤ 0.05.
The results of the stability analysis (Fig. 3) showed that the most productive treatment (CT N2) was the least stable in terms of grain yield, while the highest yield stability was found for MT N1 and NT N1. Unfertilized treatments had intermediate stability. MT and NT combined with N2 or N1 showed a significant positive trend in terms of grain yield over time (NT N1: slope 231 kg ha−1 y−1; P-value 0.02; MT N2: slope 301 kg ha−1 y−1; P-value 0.01).
Ileana Iocola - Past experience supports future choices for cropping systems management: the Italian long-term agro-ecosystem experiments (LTAEs) through the IC-FAR network– Tesi di Dottorato in Scienze Agrarie – Curriculum “Produttività delle Piante Coltivate” –Ciclo XXIX
Università degli Studi di Sassari
Anno Accademico 2015- 2016 21
Fig. 6. Linear regression between grain yield and plants m−2for maize as influenced by tillage techniques. Data on plants m−2 are referred to nine years from 2002 to 2003, from 2006 to 2008 and from 2011 to 2014.
Through the correlation analysis between the meteorological variables and maize yield, the following significant variables were identified (Table 11): mean temperature (M4 Tmean) and reference evapotranspiration (M4 ET0) of April, mean temperature (M6 Tmean), precipitation (M6 Rain), and reference evapotranspiration (M6 ET0) of June, rain of July (M7 Rain) and reference evapotranspiration of August (M8 ET0).
The significant meteorological variables and the management factors (T and N) were used for obtaining the conditional regression tree for maize yield reported in Fig. 7. The meteorological variables explaining most the yield performances in maize were M6 Tmean (threshold values ranging from 22.0 to 23.3◦C) and M7 Rain (50.2 mm). Both management factors were found to be significant. The lowest maize grain yield was associated to M6 Tmean > 23.2◦C and MT and NT practices, while the highest values to M6 Tmean ≤ 23.2◦C, N2 or N1 and M7 Rain > 50.2 mm. RMSE and MAE obtained with the regression tree for maize were respectively 936 kg ha−1 and 785 kg ha−1. According to the mixed model analysis, also this decisional tree found that both T management and N fertilization rates were significant for maize yield.
Table 11. Correlation coefficients among maize grain yields and selected monthly meteorological variables.
ALL N2 N1 N0 CT MT NT M4_Tmean -0.22 * -0.21 -0.30 -0.25 -0.17 -0.26 -0.25 M4_ET0 -0.41 *** -0.43 ** -0.50 ** -0.44 ** -0.25 -0.50 ** -0.48 ** M6_Tmean -0.49 *** -0.56 *** -0.55 *** -0.53 *** -0.46 ** -0.53 *** -0.51 *** M6_Rain 0.22 * 0.32 * 0.22 0.17 0.24 0.28 0.17 M6_ET0 -0.28 ** -0.34 * -0.33 * -0.24 -0.30 -0.36 * -0.20 M7_Rain 0.21 * 0.27 0.28 0.10 0.25 0.17 0.21 M8_ET0 -0.20 -0.24 -0.20 -0.10 -0.30 * -0.10 -0.07 where ALL = yields of all treatments; N2, N1, N0 = yields for 180, 90, 0 kg N ha-1; CT= yields for conventional tillage; MT = yields for minimum tillage; NT = yields for no tillage; M = Month from 1 (January) to 5 (May).
Ileana Iocola - Past experience supports future choices for cropping systems management: the Italian long-term agro-ecosystem experiments (LTAEs) through the IC-FAR network– Tesi di Dottorato in Scienze Agrarie – Curriculum “Produttività delle Piante Coltivate” –Ciclo XXIX
Università degli Studi di Sassari
Anno Accademico 2015- 2016 22
Fig. 7. Regression tree showing the effect of emerging drivers of the maize grain yield interannual variation: meteorological
variables (Tmean = mean monthly temperature; RAIN = monthly precipitation; M = month from 6-June to 7-July) and management factors (N—nitrogen fertilization rate: 0, 90, 180 N kg ha−1; T—Tillage: CT = conventional tillage, MT = minimum tillage; NT = no tillage). n = number of observations and y = mean yield (t ha−1) in each terminal node.
4. Discussion
4.1. Effects of tillage and fertilization systems on durum wheat yield traits
Our results show that NT did not provide any substantial advantage or disadvantage to durum wheat grain yield in comparison to CT or MT. This finding is consistent to the evidences reported in the European meta-analysis by Van den Putte et al. (2010), showing an average grain yield of −8.5% for NT compared to CT. Similarly, in a 16-years long term experiment made in Central Italy on poorly drained silt-loam soil, Mazzoncini et al. (2008) reported a mean loss of wheat grain yield of −8.9% under NT vs. CT. Lopez-Bellido et al. (2000, 2001) and De Vita et al. (2007), in the Vertisols of Spain and Italy respectively, found that wheat under CT performed better only in the wet years, while in the dry years, wheat grain yield was higher under NT. Our results do not confirm these findings and our interpretation is that we rarely experienced extremely dry years (i.e. less than 350 mm of rainfall during the wheat cycle) and because the soil of the experimental field was not a Vertisol, which would have been characterized by self-structuring capacity. In a 20-years experiment carried out on a Vertisol, under semiarid Mediterranean conditions, Ruisi et al. (2014) did not observe significant differences between CT and NT, although they also found a tendency for NT to guarantee superior grain yields under water stress conditions during the crop cycle. However, similarly to our findings, Ruisi et al. (2014) found a great interannual variability in durum wheat productivity, that they interpreted as mainly associated to the interactions between tillage and other agronomic factors, in particular crop sequence. A yield superiority of NT com-pared to CT was in fact observed only when wheat was grown in a 2-years rotation, while, when grown continuously, it performed better under CT. In our experiment, the 2-years rotation of wheat with a spring crop might have
Ileana Iocola - Past experience supports future choices for cropping systems management: the Italian long-term agro-ecosystem experiments (LTAEs) through the IC-FAR network– Tesi di Dottorato in Scienze Agrarie – Curriculum “Produttività delle Piante Coltivate” –Ciclo XXIX
Università degli Studi di Sassari
Anno Accademico 2015- 2016 23
contributed to prevent from the potential progressive increased incidence of pests and diseases, which are often the main drivers causing differences between tillage systems under monocropping. It is interesting to highlight that durum wheat grain yield under NT did not show any significant increasing trend over time, although in the same LTE, De Sanctis et al. (2012) measured an increment of soil organic matter in the top soil in the first twelve experimental years. The possible positive effects on soil quality due to no tillage, as improved water retention (De Vita et al., 2007), aggregation stability (Hernanz et al.,2002), improved biological and biochemical soil processes (Acosta-Martinez and Tabatabai, 2001) did not result into a higher crop productivity. Soil compaction is also an important constraint for wheat grain yield under NT, as documented in the same LTE by Pastorelli et al.(2013). The negative effects of soil compaction on root development and tillering are well documented (e.g., Atwell, 1990) andmconfirmed by the lower number of spikes m−2 under NT in our experiment (−14% with respect to CT). However, this seems in contrast to the findings of other scholars who measured similar soil bulk density and root density values under NT and CT (e.g., Munoz-Romero et al., 2010; Plaza-Bonilla et al., 2014) but on Vertisols, where the self-structuring nature and the better soil water conditions allow sufficient conditions for root growth and tillering also under NT (e.g., López-Bellido et al., 2007). The most relevant factor influencing wheat yield was N fertilization, which provided an advantage of about +30% in terms of grain yield when doubling the N rate from 90 to 180 kg ha−1 N. In southern Spain, also Lopez-Bellido et al. (2001) reported a more significant impact of N fertilization than tillage on grain yield, with no additional response to N fertilizer at rates above 100 kg ha−1. In our study, grain yields were more stable with 90 kg N ha−1than with180 kg N ha−1. Therefore, the decision about the about the optimal N fertilizer rate to adopt will depend on the specific farming sys-tem context and associated trade-offs between productivity and stability targets.
The second important driver influencing the grain yield, as resulted from the decisional tree analysis, was the mean temperature of January. Low temperatures at early developmental stages(as it is in January in the experimental site) and in particular when plants are at the tillering stage, might delay the crop development determining an increase of the tillering duration. A greater number of tillers can lead therefore to a greater potential numbers of spikes m−2 and, hence, to a higher yield (Kazmi and Rasul, 2012). When N was not a limiting factor, the water availability in April, which depends on rainfall and evapotranspiration, was a key driver for grain yields. The earing and anthesis occurred mainly in April and these are the most critical phases in wheat for yield (Ozturk andAydin, 2004; Wheeler et al., 1996; Albrizio et al., 2010). A water stress in this period could have reduced the number of kernels per spike, leading to a significant reduction of grain yield. A significant sensitivity of durum wheat to high air temperature and water stress in April and May was also observed by Campiglia et al. (2015) who carried out a 6-years trial
Ileana Iocola - Past experience supports future choices for cropping systems management: the Italian long-term agro-ecosystem experiments (LTAEs) through the IC-FAR network– Tesi di Dottorato in Scienze Agrarie – Curriculum “Produttività delle Piante Coltivate” –Ciclo XXIX
Università degli Studi di Sassari
Anno Accademico 2015- 2016 24
under similar soil and climate conditions to our study. They highlighted a different level of sensitivity to rainfall in spring depending also on the soil N availability associated to the compared cropping systems. This finding is consistent to the results of the decisional tree analysis that revealed a key role of April rainfall in constraining grain yield under sufficient N fertilizer application. In spring, the N availability is a main driver of the aerial biomass production and leaf area, hence under no limiting soil N, wheat may become more vulnerable to water stress and, at the same time, more able to exploit the benefits of water availability (Sadras et al., 2012) than an unfertilized crop. When N was not supplied, only air temperature in May, together with air temperature in January, were the main grain yield constraints. The grain filling period started during May. High temperatures throughout this stage, affecting kernel weight and accelerating grain maturity (Monpara, 2011), may lower grain yield. Overall, temperature in the early growth stages, soil moisture during flowering and anthesis and their interaction with N nutrition explained most of the inter-annual durum wheat yield variability.
4.2. Effects of tillage and fertilization systems on sunflower yield traits
The most important yield-limiting factor for sunflower in the specific environmental conditions, characterized by clayey soils that are not Vertisols, was the application of NT practices. The substantial failure of NT was strongly related to poor crop establishment under unsuitable soil moisture conditions at sowing time, as already highlighted by Farina et al. (2011) in the same LTE. In clayey soils, NT is constrained by the mechanical impedance of the seed-slot walls in compacted and wet soil conditions for plants emergence, as reported by some authors (e.g., Bayhan et al., 2002). This sunflower sensitivity to NT systems was also observed with less problematic soil texture as in loamy sand soils (Rühlemann andSchmidtke, 2015) and in sandy clay loam soils (Lopez-Garrido et al.,2014). In these latter conditions, the number of plants m−2 at the emergence and, in turn, the plant density at harvest were −97% less under NT than under CT. In our experiment, plant density with NT was on average 60% lower with NT than under CT. Plant density was independent of tillage systems (on average, 5.4 plants m−2) only in 1997, when no yield differences were observed between CT and NT. This confirms the negative role of worsened physical soil conditions, such as high penetration resistance and low macroporosity (Pastorelli et al., 2013), under NT for seedling emergence. The low soil porosity may also restrict gaseous exchange creating unfavorable conditions for germination and seedlings establishment (Gantzer and Blake, 1978). In contrast to our findings, Halvorsonet al. (1999) reported a beneficial effect of NT on sunflower yields, although under more suitable soil texture conditions (silt-loamysoil) and no limiting soil N availability. Overall, the sunflower productivity measured in our long term experiment was rather low (1.4 t ha−1) with high interannual variability associated to weather patterns. Under rainfed Mediterranean conditions, other scholars found