UNIVERSITÀ DEGLI STUDI DI SASSARI
SCUOLA DI DOTTORATO DI RICERCA
Scienze e Biotecnologie
dei Sistemi Agrari e Forestali e delle Produzioni Alimentari
Indirizzo Produttività delle piante coltivate
Ciclo XXVIII
Two case studies on plant genetic diversity: comparison
of two historic collections of barley landraces and
characterization of a common bean segregant population
for domestication traits
dr.ssa Maria Leonarda Murgia Direttore della Scuola Prof. Antonello CannasReferente di Indirizzo Prof.ssa Rosella Motzo Docente Guida Dr. Domenico Rau
La presente tesi è stata prodotta durante la frequenza del corso di dottorato in “Scienze e Biotecnologie dei Sistemi Agrari e Forestali e delle Produzioni Alimentari” dell’Università degli Studi di Sassari, a.a. 2014/2015 - XXVIII ciclo, con il supporto, relativo solo agli ultimi cinque mesi di attività, di una borsa di studio finanziata con le risorse del P.O.R. SARDEGNA F.S.E. 2007-2013 - Obiettivo competitività regionale e occupazione, Asse IV Capitale umano, Linea di Attività l.3.1 “Finanziamento di corsi di dottorato finalizzati alla formazione di capitale umano altamente specializzato, in particolare per i settori dell’ICT, delle nanotecnologie e delle biotecnologie, dell'energia e dello sviluppo sostenibile, dell'agroalimentare e dei materiali tradizionali”.
Maria Leonarda Murgia gratefully acknowledges Sardinia Regional Government for the partial financial support of her PhD scholarship (P.O.R. Sardegna F.S.E. Operational Programme of the Autonomous Region of Sardinia, European Social Fund 2007-2013 - Axis IV Human Resources, Objective l.3, Line of Activity l.3.1.)
CONTENTS
CAP.1 - Comparison two collections of landraces Barley from N.I. Vavilov at ‘90s
CAP.2 - Characterization of a collection of introgression lines of common bean
(Phaseolus vulgaris L.) for the study of the genetic bases of the domestication syndrome at pod level and a close up on the pod shattering trait
ABSTRACT
In this study we studied the change in the time of population of barley and in second chapter we analisys the traits of Syndrome Domestication in common bean.
Chapter 1
INTRODUCTION
The relevance of landraces
Plant genetic resources (species and varieties) are sources of genes directly usable or potentially exploitable for the genetic improvement of cultivated plants. Among these, the wild progenitors and local varieties (landraces) occupy a role of particular importance.
The wild relatives of cultivated plants often show high tolerance against abiotic stress or resistance to biotic agents (Hajjar and Hodgkin, 2007; Atwell et al., 2013). Examples are those of tolerance to high or low temperatures (Grossi et al., 1998; Lei et al., 2012), at high salt concentrations (Hand and Takeda, 1998; Nevo and Chen, 2010), water deficit (Nevo and Chen, 2010; Lakew et al., 2013; Hikmet et al., 2013; Monneveux et al., 2013) as well as tolerance to edaphic conditions not optimal or limiting due to abnormal pH and high concentrations of heavy metals (Baker et al., 1994; Watanabe and Osaki, 2002; Ganança et al., 2007). In the second case, we can include mainly by the resistance to fungal pathogens, bacterial and viral (Muehlbauer et al., 1994; Rao et al., 2003; Cooper et al., 2006; Jarosz and Davelos, 1995).
The landraces (local varieties) are populations that have evolved in subsistence agriculture in response to selection by man as well as the environment. They are the product of what has been defined as "evolutionarily sustainable production" (Brown et al., 2000). Traditional farmers have retained populations characterized by high genetic variability due to the existence of network interchange of seeds among farmers ("migration") and as a result of anthropic selection (for certain customs and traditions) and natural selection (Harlan 1975; Brush 2000). In general, the landraces may have adaptive characters for the agro-ecosystem in which they have evolved and are interesting sources of genes for the improvement of agricultural production both in quantity (especially in marginal environments) and quality. Often, the landraces appear as heterogeneous populations (multi-genotypic) and not as individual genotypes (Brown, 2000; Ceccarelli and Grando, 2000). This raises a question about the role of the variability observed within populations of landraces; whether it is only the result of demographic processes occurring over time or is rather important to determine local adaptation (Demissie and Bjornstad 1997; Jaradat and Shahid, 2006). Several
experiments conducted with landraces suggest that this variability could have a "buffer effect" against environmental changes; the variability of the population could be a tool to ensure that the population (at least with some of its individuals) is "in phase" with the environmental conditions. This would allow the adaptation in environments characterized by strong unpredictability of weather conditions (Ceccarelli and Grando, 2000). Local varieties can be successfully used for the identification and mapping of the genes that control the adaptive variation in cultivated species (Vigouroux et al., 2002; Mazzucato et al., 2008; Comadran et al., 2009). However, a deeper understanding of the role of genetic variability of landraces is an objective of primary importance not only to exploit its potential for genetic improvement, but also for the correct implementation of strategies of conservation of germplasm. In fact, the preservation of genetic diversity directly "on farm" or "in situ", has become an important topic (Brown, 2000).This depends on the belief that the intraspecific variability is related to the selection and adaptation local and allows the "answer" to new diseases or adversity, stress edaphic and climatic variations (Frankel et al., 1995; Brown, 2000). The study of the evolution of the populations of landraces can be made by analysing the change in allele frequencies in space (in populations grown in different locations with contrasting soil and climatic conditions), is studying the change in allele frequencies over time at the level of individual populations and / or meta-population (= system populations with extinction-recolonization connected by gene flow) (Lister et al., 2009; Leino et al., 2010, 2012).
Barley (Hordeum vulgare L.) in Sardinia
Barley is a plant known to man since ancient ages; was already cultivated in the Middle East in the seventh millennium BC and from there it spread all over the world. In Italy occupies a cultivated area amounted to 360,000 hectares, with a production of 1.4 million tonnes. In areas where the climate is not suitable for the cultivation of wheat, barley was an important food for humans as a source of carbohydrates and protein, in many countries in the developing world it is still even. Instead, in most developed countries the grain of barley is the main destination (85-90%) in the animal feed livestock and secondarily (10-15%) of the malt industry. Cultivated since ancient times, in the past barley represented a significant food source in Sardinia. Today barley represents the most cultivated cereal after wheat occupying an area of 10,418 ha in 2011 (www.sardegna.coldiretti.it) In many areas there is a widespread
This is used both for the production of fresh forage through the direct grazing (sheep) and for the production of grain. Local varieties of barley were grown in different environments at different latitudes, soil types and with different cultural practices and this may have allowed the development of locally adapted populations of barley. Section of Agronomy, Crop Science and Genetics, Department of Agriculture, University of Sassari, in the summer of 1990 (Attene et al., 1996) has performed an initial collection of 27 populations of barley in different growing areas of Sardinia. They were taken into account farms that for at least 30 years had used seeds of own production. From each field were taken at random 100 ears, whose kernels were multiplied in single ear, at the Experimental Farm of the Department of Agriculture. The analysis of 240 lines extracted from 12 of the 27 local populations collected in Sardinia in 1990 showed the existence of high genetic variability for many characters such as: date of ear emergence, plant height, kernel weight, grain yield, biomass total and harvest index (Papa, 1993).The collection of populations of Sardinian barley was repeated in 1999, visiting the same areas sampled in 1990 (Rau, 2002). The comparison of the collections of 1990 and 1999 using microsatellite molecular markers (SSR, Simple Sequence Repeats) and based on retrotransposons (SSAP; Simple Sequence Amplified Polymorphism) not showed neither changes in the levels or in the structure of genetic diversity, indicating that farmers implement a system of conservation "in situ" capable of preserving the genetic identity of the populations, even in the absence of specific conservation projects for these plant materials (Rodriguez et al., 2012; Bellucci et al., 2013). The analysis of the spatial structure of the genetic variability showed a level of genetic divergence of populations moderate-low, measured by a fixation index Wright (Fst; 1931) 0.18 (Rodriguez et al., 2012). This also clears up that 18% of molecular variance (the allele frequencies) is explained by the differences between populations and 82% of the variance is observed within the population. This finding is in line with that obtained with other types of molecular marker such as isozymes and RAPD (Papa et al., 1998) and SSR (Bellucci et al., 2013) with Fst values of 0.16, 0.11 and 0.14, respectively. The high proportion of variability within this population is also confirmed by the fact that, with a relatively small number of molecular marker (134 SSAP or SSR 12; Rodriguez et al., 2012; Bellucci et al., 2013) all individuals analyzed (over 350) are a unique genetic profile, two individuals are still genetically distinguishable (Rodriguez et al., 2012; Bellucci et al., 2013). Moreover, it was highlighted a well-defined genetic structure of populations, with four main genetic groups and a clear structure according to the geographical site of origin (Figure 1.1, Rodriguez et al., 2012). In particular, the genetic
variability is mainly oriented along the north-south axis of the island and there is a structure known as hierarchical island (or "archipelago"), in which peoples geographically close (North, the center, the center-south and south) tend to be more similar than that to other populations. This complex may indicate the existence of exchange of seed among farmers in network mostly local, and also suggests the existence of diversifying selection (wonders of local adaptation; Rodriguez et al., 2012)
Figure 1.1 – Population structure of Sardinian landraces (From Rodriguez et al. 2012)
The comparison between the degree of divergence of populations for neutral molecular markers (Fst) and quantitative traits (Qst) about it can be particularly informative. In fact, according to the theoretical models (Merilä and Crnokrak, 2001) is expected that in a survey neutral Fst = Qst, in a survey in which balancing selection Qst <Fst and in a survey in which divergent selection Qst> Fst. For the Sardinian population was calculated Qst equal 0.40 (Rau, unpublished; Papa, unpublished), the degree of divergence medium for quantitative traits was 2-3 times higher than the Fst, supporting the hypothesis of selection for local adaptation in different environments. Finally, the analysis of linkage disequilibrium showed rather low levels (13% of pairs of locus, with P <0.01) and a decay with the distance of the
epistatic selection may also have played a role in this system. Overall, the results suggest that these populations could be used profitably for gene mapping by association mapping (Rodriguez et al., 2012).
The Russian Nikolai Ivanovich Vavilov (1887-1943) was a pioneer in studies on biodiversity vegetable. In 1920 he was called by Lenin to direct the then Soviet Institute of Plant Industry Agricultural now become NI Vavilov Research Institute of Plant Industry, St. Petersburg, Russia (VIR). He directed this institute from 1920 to 1940. Vavilov considered the central role of genetic resources in breeding. The experience accumulated during a multitude of travel observation and study of the variability of the species and breeds of agricultural plants or their "kin" wild in different areas of the world led him to theorize the
existence of the centers of origin of the plants grown (where species domesticated have originated and their evolutionary history).The important insight of Vavilov consisted in assuming that the observed differences were to be related to the length of the evolutionary history of the species in a given location. According to the reasoning of Vavilov, the place with greater variability is the one that also has a link with the oldest species in question that is the place where the species has had more time to diversify and from which possibly has subsequently expanded to colonize other regions. Although more recent studies have not always confirmed for the various species of centers of origin identified by Vavilov, he was responsible for the brilliant idea and incredibly far-sighted to center its scientific work on the identification of the centers of origin and domestication of agricultural plants an industry that is allowing you to get and, promises to do to get in the next few years, enormous advances in the genetic improvement of crop plants (Olsen and Wendel, 2012, 2013). In the period 1926-1927 Vavilov and collaborators begin an expedition in the countries of the Mediterranean dock (including, Syria, Palestine, Transjordan, Greece, Cyprus, Crete, Italy, France, Spain, Portugal, Morocco, Algeria, Tunisia and Egypt) and in Abyssinia (Djibouti, Addis Ababa, the
Cyprus, as evidenced by texts received, Vavilov headed for Italy who had previously visited many times. He visited Sicily, along the road from Palermo to Catania and performed also an exploration of Sardinia.
Vavilov was convinced that the exploration of Italy and its islands were very important to fully understand the Mediterranean culture (Loskutov, 1993).On the information contained in the archives of the VIR, Vavilov was not conducted exploration in Sardinia personally, but under his direction and supervision, by a close collaborator the Dr. Gaissinsky.The collection of these materials would have taken place during a trip from South to North Island with a through even in inland areas. During this trip is been visited several sites and collected accessions of many species of agricultural interest.
Figure 1.2– Sites visited in Sardinia (based on archive data of (VIR).
Although it know the places where Gaissinsky stopped and he collected plant material (Figure 1.2), to date, from the information available it was not possible to deduce the exact site of origin of each accession although it is fair to assume that these are from sites distributed throughout the region since as noted by Gaissinsky: "Barley. It is cultivated Throughout Sardinia, less in Sassari. Samples are abundant”. However, it is important to note that the sampling sites of Gaissinsky, concern mostly the same areas in which were sampled the populations of landraces of Hordeum vulgare in 1990 and 1999 .Figure….
The existence of landraces of barley collected in the 1926 is a great opportunity : it might be possible to study the time variation of allele frequencies comparing the population of 1926 and those collected in 1990 and 1999, a distance of about 70 years. This would allow to understand what was the role demography and natural selection in “ shaping” the genetic diversity of landraces,also allowing to better understand the genetic basis of adaptation of barley.
OBJECTIVES
In this chapter are presented the results of a pilot study where the aim of wigh was to compared population of landrcaes collected in different ages (1926 and 1990-1999) in Sardinia.
To observe that the population of landraces of 1926, 1990 and 1999 share the same gene pool would suggest a close relationship between populations of different ages. This would allow to account populations of 1926 as a progenitors of Sardinian landraces stressing the antiquity of the same and opening the possibility in the next future to conduct analysis of allele frequency variation in time. This could allow a better understanding of the genetic bases of plant adaptation to the agro-ecosystem.
Materials and Methods
Phenotypic Analysis
The first phenotypic analysis was performed on eight populations collected in 1926. A the end of February 2013, 40 seeds were sown for each of the eight population. After about 15 days of growth, stage of third leaf by the plants, second leaf has been used for the extraction DNA. After a further period of recovery of the seedlings plants were transplanted in the field. For each population was counted the number of number of plants that did flower. Then, the following characters were measured: date of flowering, plants height (height of the culm in cm), spike length ( cm), awns length (cm), awns length/spike length ratio, number of seeds per plant, weight of 1000 seeds (g) and grain yield per plant (g). The flowering date was determined for each population as the percentage of plants come to earing in one survey on 10 June 2013.
Molecular Analysis
For molecular analysis we used 12 microsatellites markers already successful in describing the populations structure of Sardinian barley landraces (Bellucci et al., 2013). Primer sequences, DNA extraction and PCR conditions were as described in Bellucci et al. (2014). Analysis was performed on 240 individuals collected in 1926 together with 12 individuals representing a core collection of the Sardinian barley landraces. This set comprised five individual belonging to the “Northern gene pool” of the he Sardinian landraces, five belonging to the southern and two individual that were admixed between the two gene pool (Bellucci et al. 2014).
Statistical analysis
The differences between populations were assayed using analysis of variance (ANOVA) considering the individuals of the population as “replicates”. To compare population means,
were studied by principal component analysis (PCA) using the means of the populations for all the nine phenotypic traits. Analyses were performed with the software JMP ver. 7.00 (SAS Institute, 2007). Population genetic analyses were conducted using Arlequin vers. 3.5.1 and Structure software.
Results
The analysis of variance showed that in 2013 the differences between populations were highly significant (P<0.0001) for five traits and with lesser extent (P<0.01) for plant height and spike length. Population differences did not reach significance for number of kernel per plant (P=0.07) and yield per plant (P=0.10) (Table 1.1).
The Table 1.2 shows averages for all the nine characters and for all populations. In particular, it must be noted the high degree of variation among population in the number of plants that did not flower. The Sardinian barley landraces are mainly of intermediate type (Papa et al, 1999), thus variation for this trait might be particularly informative to discriminate between potential “old relatives” of the recent SBLs.
Table1.1 – Comparison (by one-way ANOVA) among the eight populations collected
in 1926 for the nine phenotypic traits recorded in 2013. d.f. = degree of freedom; M.S. = Mean Square. Trait d.f. M.S. F P d.f. M.S. F P % of flowered plants Awns lenght/spike lengh Population 7 1.6 8.62 2.33E-09 Population 7 5.1 7.27 2.22E-07 Error 225 0.2 Error 134 0.7 Flowering date (days) N. of kernels Population 7 1.7 11.8 1.04E-11 Population 7 4224.7 1.92 0.0711 Error 136 0.1 Error 132 2199.8 Plan hight Yield per plant Population 7 311.3 2.79 0.0095 Population 7 6.5 1.74 0.1046 Error 136 111.5 Error 132 3.7 Spike lenght 1000-seeds weigth Population 7 8.5 3.33 0.0027 Population 7 530.9 4.60 0.0001 Error 134 2.6 Error 132 115.4 Awn lenght Population 7 42.7 6.16 2.97E-06 Error 134 6.9
Table 1.2 – Means of the eight populations for each of the nine phenotypic trait
recorded in 2013. For each trait, means that do not share the same letter are statistically different at the Tukey-Kramer HSD test for multiple comparisons. Population % of not flowered plants Flowering time (% at the 10 of june) Culm length (cm) Spike Lenght (cm) Awn lenght (cm) Awn lenght / spike lenght N. of kernel per plant Yield per plant (g) 1000-seeds weight (g) 8819 33.0 BD 0.0 D 52.6 AB 5.7 AB 8.3 C 1.5 B 23.1 0.7 30.3 C 8825 41.2A-D 10.0 BD 58.6 AB 6.9 A 9.9 A-C 1.5 B 50.1 1.9 37.7 A-C 8815 15.2 CD 82.1 A 54.0 AB 4.8 B 12.1 A 2.8 A 47.9 2.1 43.4 A 8822 3.0 D 34.4 BC 50.3 AB 5.8 AB 10.9 AB 2.1 B 41.8 1.7 41.3 AB 8832 36.4A-C 33.3 BD 46.6 B 5.6 AB 9.0 BC 1.7 B 70.5 2.4 32.8 BC 8813 61.5 AB 0.0 D 59.8 A 7.2 A 8.4 BC 1.2 B 33.7 1.4 36.9 A-C 8827 64.5 A 0.0 D 46.7 B 5.5 AB 7.8 C 1.5 B 21.9 0.8 31.6 BC 8836 60.0 AB 50.0 AB 50.6 AB 5.5 AB 10.0 A-C 2.0 B 43.1 1.4 31.3 BC Minimo 3.00 0.00 46.62 4.79 7.80 1.22 21.90 0.71 30.31 Massimo 64.50 82.14 59.80 7.15 12.11 2.83 70.45 2.42 43.37
The principal component analysis applied to average population suggest that accessions collected in the 1926 can be grouped into three main groups (Figure 1.3). The Figure 1.3 shows also the correlation the original variables and the first two principal component.
Figure 1.3 – A) Relationships among the populations collected in 1926 based on nine phenotypic traits; sowing: February 2013. Loadings of the traits on the principal components.
-2
-1
0
1
2
3
-3
-2
-1
0
1
2
3
4
5
PC1 (54,2%)
PC2 (22,2%)
8832
8822
8836
8815
8825 8813
8827
8819
Lunghezza spiga Peso 1000 semi Altezza della pianta % di piante non fiorite Lunghezza reste Resa Spigatura Lun. reste/Lun. spigaNumero di cariossidi PC2 PC1 Spike length Plant hight 100-seeds weight Yield Kernels number Awns length Flowering time
Awn length/spike length % of not flowered
plants
A
In particular the first principal component (PC1) captures more than 50% of the phenotypic variance, and separated the populations 8832, 8822 and 8815 and to a lesser extent the population 8836, from the remaining four population 8813, 8825, 8819 and 8827. In particular the populations with high values for the PC1 showed a low percentage of not -flowered plants (i.e. they did not require vernalization and have low photoperiodic sensitivity), tend to be early. Moreover, these plants showed long awns and high awns length/spike length ratio. These populations tended to have higher yield, that was achieved with more seeds and with a high weight of 1000-seeds. The second principal component (PC2) explained more than 20% of the total variance and it separated populations mainly based on plant height spike length. The PC2 also reflected, although to a lesser extent, some productive characteristics such as weight of 1000-seeds and yield per plant. The biggest difference for PC2 is that between 8827 versus 8825 and 8813; the populations 8815, 8819, 8822, 8832 and 8836 occupy an intermediate position for PC2 (Figure 1.3)
Microsatellite genotyping
The analysis conducted with SSR markers showed that the populations collected in 1926 possess diversity levels quite variable (Figure). One population (8819) was monomorphic while the population 8832, the most diverse, showed 25 haplotypes out of 30 individuals analyzed with an expected heterozygosity of 0.626. A similar level of diversity was observed for the population 8822.
Figure 1.4 – Descriptive diversity statistics for the populations collected in 1926 and
the core collection of Sardinian barley landraces of 1990 and 1999 .
Population Sample size Haplotypes Haplotype/Sampe size HE 8819 30 1 0.03 0 8825 30 16 0.53 0.505 8815 30 17 0.57 0.527 8822 30 24 0.80 0.613 8832 30 25 0.83 0.626
8813 30 20 0.67 0.535
8827 30 15 0.50 0.443
8836 30 20 0.67 0.482
Core 12 12 1.00 0.592
The lack of genetic diversity for the population 8819 could be explained, given the strong autogamy of barley (selfing >99% Briggs, 1975) , assuming that for this this population the conservation units was likely the single spike.
The analysis conducted with the software STRUCTURE using a240 individuals collected in 1926 and the core collection SBLs and the method of Evanno et al., (2005) determined K = 2 as the most likely number of genetic groups within the collection of individuals. This solution is represented in (Figure 1.5). Overall, the coefficient of membership of the individuals ins quite high indicating well-defined population structure. Indeed the 161 individuals ( 67%) were attributed to one of the two groups (Cl.1 or Cl.2) with qi > 0.80. Among the two groups identified by STRUCTURE the one also comprise the SBL of 1990 and 1999 (Cl.1) was characterized by a higher genetic diversity as compared to C1.2 (0.650 versus 0.300) as also by a much lower FK estimate (0.135 versus 0.694). The parameter FK represents the estimated drift from the inferred common ancestor of all populations, thus similar to FST but specific for each cluster is expected to be proportional to the divergence from a common ancestral population. A low FK value indicates little drift away from the ancestral state.
From this picture it was evident that three populations 8822, 8832 and 8815 were more similar to SBL than the other populations collected in 1926. This was corroborated by the inspection of the pairwise FST matrix between populations (Table 1.3). Moreover, the FST between the core collection and these tree populations, is very close to the average FST among SBL populations estimated by using different marker system (Papa et al., 1998; Rodriguez et al., 2012; Bellucci et al., 2013). Other populations (8819, 8827, 8813 and 8836) were not seen in close relationship with the recent Sardinian Landraces being the FST around 0.300.
Table 1.3 – pairwise distance matrix (FST) between samples. Bold: the three lowest distance between the core collection and the populations collected in 1926. Underlined: FST between the three populations collected in 1926
8819 8825 8815 8822 8832 8813 8827 8836 Core 8819 0.000 8825 0.431 0.000 8815 0.638 0.329 0.000 8822 0.543 0.166 0.203 0.000 8832 0.584 0.267 0.156 0.110 0.000 8813 0.471 0.181 0.316 0.240 0.263 0.000 8827 0.593 0.276 0.407 0.297 0.367 0.277 0.000 8836 0.592 0.310 0.371 0.203 0.275 0.323 0.104 0.000 Core 0.609 0.200 0.165 0.096 0.148 0.287 0.349 0.277 0.000
Moreover, at K=3, the individuals of the SBL core collection divided according to their provenance (Northern gene pool, Southern gene pool and admixed; Figure 1.5 and 1.6). At the same time, among the five populations of 1926 more similar to the SBL, there was the separation of 8813, 8825 and 8822 from 8815 and 8832. Thus, the North/South structure that in characterized Sardinian barley landraces in the ’90 (Papa et al., 1998; Rodriguez et al. 2012; Bellucci et al. 2014) might have a long history and might had persist for decades until nowadays.
Figura 1.5 – Genetic structure of the eight populations collected in 1926 (240
individuals, 30 per population). For comparison, a core collection (12 individuals) of the Sardinian barley landraces (SBL) collected in 1990 and in 1999.was also included in the analysis. The core collection included five individuals belonging to the “Northern gene pool” of SBL, five to the “Southern gene pool” and two admixed (see Rodriguez et al. 2012; Bellucci et al., 2013).
0% 20% 40% 60% 80% 100% 1 31 61 91 121 151 181 211 241 0% 20% 40% 60% 80% 100% 1 31 61 91 121 151 181 211 241 Hypercore collection 1990 -1999 North Admixed South Populations collected in 1926 8819 8825 8815 8822 8832 8813 8827 8836 8819 8825 8815 8822 8832 8813 8827 8836 Cl.1 Cl.2 Cl1.1 Cl1.2 CL2
Figure 1.6 – Relationships between the individuals of the core collection of SBLs.
The scatterplot represents the result of the Principal Component Analysis (PCA) using the qi coefficient of membership calculated by STRUCTURE. The different color represent the Color keys: Light blue : SBL belonging to the Southern gene pool; individuals belonging to the “Northern gene pool” are in blue, those belonging to the Southern gene pool in light blue and the admixed in yellow.
Comparison between the phenotypic and molecular characterization of the populations collected in 1926.
It was detected a correspondence between phenotypic and molecular structure. Indeed, the phenotypic group composed by the populations 8836, 8832, 8822 and 8815 also tend to be genetically different for the other groups of populations collected in 1926 ([8827,8819] and [8825 e 8813]) and with a gene pool more similar to that of the SBL. In particular three populations, 8832, 8822 and 8815appeared related to the SBL collected in 1990 and 1999.
Figure 1.7– The figure synthesizes the relationship between the eight population collected in 1926 for the year 2013. Populations are separated based on the first two principal component (PC1 and PC2) calculated on using the mean of nine phenotypic traits recorded in 2013, Each population is represented by a pie which reported the average contribution (qi) of each genetic group identified by STRUCTURE to the gene pool off the population.
Overall these results stress the biological significance for the population structure identified within the collection of 1926 by microsatellite analysis and led us to hypothesizes that some the populations collected in 1926 can be regarded with interest, as the likely are “progenitors” (and in particular three of them) of the SBL collected about 70 year after in 1990 and 1999. opening the possibility in the next future to conduct analysis of allele frequency variation in time This could allow a better understanding of the genetic bases of plant adaptation to the agro-ecosystem.
-2 -1 0 1 2 3 -3 -2 -1 0 1 2 3 4 5 PC2 (22,2%) 8832 8822 8836 8815 8813 8819 8825 PC1 (54,2%) 8827 Hypercore collection 1990 - 1999
Bibliography
Attene G., Ceccarelli S., and Papa R. (1996). The barley (Hordeum vulgare L.) of Sardinia, Italy. Genetic Resources and Crop Evolution, 43(5), 385-393.
Atwell B.J., Han W., Scafaro A.P. (2013). Could abiotic stress tolerance in wild relatives of rice be used to improve Oryza sativa?. Plant Science. Baker A.J.M., Reeves R.D., Hajar A.S.M. (1994). Heavy metal accumulation and tolerance in British populations of the metallophyte Thlaspi caerulescens J. & C. Presl (Brassicaceae). New Phytologist, 127(1), 61-68.
Bellucci E., Bitocchi E., Rau D., Nanni L., Ferradini N., Giardini A., Rodriguez M., Attene G., Papa R. Population structure of barley landrace populations and gene-flow with modern varieties. Accettato per la pubblicazione su PLOSone.
Comadran J., Thomas W. T. B., Van Eeuwijk, F. A., Ceccarelli, S., Grando, S., Stanca, A. M., Pecchioni N., Akar T., Al-Yassin A, Benbelkacem A., Oubbou H., Bort J., Romagosa I., Hackett C.A., Russell J. R. (2009). Patterns of genetic diversity and linkage disequilibrium in a highly structured Hordeum vulgare association-mapping population for the Mediterranean basin. Theoretical and applied genetics, 119(1), 175-187. Cooper I., Jones R.A. (2006). Wild Plants and Viruses: Under‐Investigated Ecosystems. Advances in virus research, 67, 1-47.
Demissie A., Bjørnstad A. (1997). Geographical, altitude and agro-ecological differentiation of isozyme and hordein genotypes of landrace barley from Ethiopia: implications to germplasm conservation. Genetic Resources and Crop Evolution 44: 43–55.
Earl Dent A. and von Holdt, Bridgett M. (2012) STRUCTURE HARVESTER: a website and program for visualizing STRUCTURE output and implementing the Evanno method. Conservation Genetics Resources vol. 4 (2) pp. 359-361 doi: 10.1007/s12686-011-9548-7
Evanno G, Reganut E, Goudet J (2005) Detecting the number of clusters of individuals using the software STRUCTURE: a simulation study. Mol Ecol 14: 2611-2620.
Excoffier, L. and H.E. L. Lischer (2010) Arlequin suite ver 3.5: A new series of programs to perform population genetics analyses under Linux and Windows. Molecular Ecology Resources. 10: 564-567.
Falush, D., Stephens, M., and Pritchard, J. K. (2003). Inference of population structure: Extensions to linked loci and correlated allele frequencies. Genetics, 164:1567–1587.
Ganança J.F.T., Abreu I., Sousa N.F., Paz R.F., Caldeira P., Dos Santos T.M.M., Costa G., Slaski J.J., Pinheiro de Carvalho M.A.A. (2007). Soil conditions and evolution of aluminium resistance among cultivated and wild plant species on the Island of Madeira. Plant Soil and Environment, 53(6), 239.
Grossi M., Giorni E., Rizza F., Stanca A.M., Cattivelli L. (1998). Wild and cultivated barleys show differences in the expression pattern of a cold-regulated gene family under different light and temperature conditions. Plant molecular biology, 38(6), 1061-1069.
Hagenblad J., Zie J., Leino, M. W. (2012). Exploring the population genetics of genebank and historical landrace varieties. Genetic Resources and Crop Evolution, 59(6), 1185-1199.
Hajjar R., T. Hodgkin (2007). The use of wild relatives in crop improvement: a surveyof developments over the last 20 years, Euphytica 156, 1–13.
Hikmet B., Melda K., Kuaybe Yucebilgili K. (2013). Drought Tolerance in Modern and Wild Wheat. The Scientific World Journal, 2013.
Jaradat A.A., Shahid M. (2006). Population and multilocus isozyme structures in a barley landrace. Plant Genetic Resources, 4(2), 108-116. Jarosz A.M., Davelos A.L. (1995). Tansley Review No. 81. Effects of disease in wild plant populations and the evolution of pathogen aggressiveness. New Phytologist, 371-387.
Jordi Comadran, W. T. B. Thomas, F. Á. van Eeuwijk, S. Ceccarelli, S. Grando, A. M. Stanca, N. Pecchioni, T. Akar, A. Al-Yassin, A. Benbelkacem, H. Ouabbou, J. Bort, I. Romagosa, C. A. Hackett, J. R. Russell hide
Lakew B., Henry R.J., Eglinton J., Baum M., Ceccarelli S., Grando S. (2013). SSR analysis of introgression of drought tolerance from the genome of Hordeum spontaneum into cultivated barley (Hordeum vulgare ssp vulgare). Euphytica, 1-13.
Lei D., Tan L., Liu F., Chen L., Sun C. (2012). Identification of heat-sensitive QTL derived from common wild rice (Oryza rufipogon Griff.). Plant Science, 201–202, 121–127.
Leino M. W., Boström E., Hagenblad J. (2012). Twentieth-century changes in the genetic composition of Swedish field pea metapopulations. Heredity, 110(4), 338-346.
Leino MW, Hagenblad J (2010). 19th century seeds reveal the population genetics of landrace barley (Hordeum vulgare). Mol Biol Evol 27: 964–973. Leino MW, Hagenblad J, Edqvist J, Karlsson Strese E-M (2009). DNA preservation and utility of a historic seed collection. Seed Sci Res 19: 125– 135.
Lister DL, Thaw S, Bower MA, Jones H, Charles MP, Jones G et al. (2009). Latitudinal variation in a photoperiod response gene in European barley: insight into the dynamics of agricultural spread from ‘historic’ specimens. J Arch Sci 36: 1092–1098.
Loskutov I (1993). Vavilov and his Institute. The history of the world collection of plant genetic resources in Russia. IPGRI publication.
Mano Y., Takeda K. (1998). Genetic resources of salt tolerance in wild Hordeum species. Euphytica, 103(1), 137-141.
Mazzucato A., Papa R., Bitocchi E., Mosconi P., Nanni L., Negri V., Picarella M.E., Siligato F., Soressi G.P., Tiranti B., Veronesi F. (2008). Genetic diversity, structure and marker-trait associations in a collection of Italian tomato (Solanum lycopersicum L.) landraces. Theoretical and Applied Genetics, 116(5), 657-669.
Merilä J., Crnokrak P. (2001). Comparison of genetic differentiation at marker loci and quantitative traits. Journal of Evolutionary Biology, 14(6), 892-903.
Monneveux P., Ramírez D.A., Pino M.T. (2013). Drought tolerance in potato (S. tuberosum L.): Can we learn from drought tolerance research in cereals?, Plant Science, 205–206, 76-86.
Muehlbauer F.J., Kaiser W.J., Simon C.J. (1993). Potential for wild species in cool season food legume breeding. Euphytica, 73(1-2), 109-114.
Nevo E., Chen G. (2010). Drought and salt tolerances in wild relatives for wheat and barley improvement. Plant, Cell & Environment, 33(4), 670-685. Olsen K. M., and Wendel, J. F. (2013). A Bountiful Harvest: Genomic Insights into Crop Domestication Phenotypes. Annual review of plant biology, 64, 47-70.
Olsen K. M., and Wendel, J. F. (2013). Crop plants as models for understanding plant adaptation and diversification. Frontiers in plant science, 4.
Papa R. Diversità and adattamento in germoplasma sardo di orzo (Hordeum vulgare L.). Dottorato di Ricerca (PhD) Thesis, Università degli Studi di Sassari, Sassari, Italy.
Papa R., Attene G., Barcaccia G., Ohgata A., Konishi, T. (1998). Genetic diversity in landrace populations of Hordeum vulgare L. from Sardinia, Italy, as revealed by RAPDs, isozymes and morphophenological traits. Plant Breeding, 117(6), 523-530.
Rao N.K., Reddy L.J., Bramel P.J. (2003). Potential of wild species for genetic enhancement of some semi-arid food crops. Genetic Resources and Crop Evolution, 50(7), 707-721.
Rau D. (2002). Effetto dei fattori agro-climatici sulla struttura della diversità genetica del sistema pianta-patogeno Hordeum vulgare-Pyrenophora teres. Dottorato di Ricerca (PhD) Thesis, Università degli Studi di Sassari, Sassari, Italy.
Rodriguez, M., Rau, D., O’Sullivan, D., Brown, A. H., Papa, R., & Attene, G. (2012). Genetic structure and linkage disequilibrium in landrace populations of barley in Sardinia. Theoretical and Applied Genetics, 125(1), 171-184.
Vigouroux Y., McMullen M., Hittinger C. T., Houchins K., Schulz L., Kresovich S., Y. Matsuoka, Doebley J. (2002). Identifying genes of agronomic importance in maize by screening microsatellites for evidence of selection during domestication. Proceedings of the National Academy of Sciences, 99(15), 9650-9655.
Watanabe T., Osaki M. (2002). Mechanisms of adaptation to high aluminum condition in native plant species growing in acid soils: a review. Communications in Soil Science and Plant Analysis, 33(7-8), 1247-1260.
Wright, S. I., & Gaut, B. S. (2005). Molecular population genetics and the search for adaptive evolution in plants. Molecular biology and evolution, 22(3), 506-519.
CHAPTER II
Characterization of a collection of introgression lines of common bean
(Phaseolus vulgaris L.) for the study of the genetic bases of the
domestication syndrome at pod level and a close up on the pod
Introduction
The domestication of plants
The transition from a nomadic life style dedicated to hunting and gathering of food to a settled civilization based on agriculture has marked a turning point in human history defined as the "Neolithic Revolution" (Smith, 2006). Several approaches have been followed to study this transition such as, among others, archaeological botanical, and genetic. The first prehistoric communities began to cultivate wild plants about 10,000 years ago in various regions of the world (Gepts 2004; Cohen 2009) giving birth to their domestication. Te domestication of plants is the evolutionary process by which genetic modification of wild species has led to new forms of plants, modified to satisfy human needs (Doebley et al., 2006). Considerable efforts have been made to investigate the processes involved in domestication. These studies in factallow to understand the genetic basis of crop adaptation to the agro-ecosystem having an impact on evolutionary biology studies, conservation biology and plant breeding (Lenser and Theißen, 2013; Olsen and Wendel 2013a,b; Dong and Wang 2015).
Charles Darwin, the founder of the theory of evolution presented in the book "The Origin of Species by Means of Natural Selection" (1859), has devoted the first chapter to the changes occurred between wild and domesticated organisms during the process of domestication. One of the main observations made by Darwin was that morphological changes selected during domestication were such that the growth of many crops was completely dependent on human action. For many crops this meant losing entirely the ability to spread naturally, as for example in corn and cauliflower (Doebley et al., 2006). Although the “birth” of the domesticated forms on a millennial time scale has been relatively rapid (Purugganan and Fuller, 2011), the process was long and very complex and it was characterized by random events (mutation, genetic drift) as also by natural and human mediated selection, being this latter both conscious (Ladizinsky, 1987; Kerem et al., 2007; Abbo et al., 2009, 2011, 2012, 2014), or unconscious (Purugganan and Fuller, 2011; Kluyver et al., 2013).
Sites of Origin
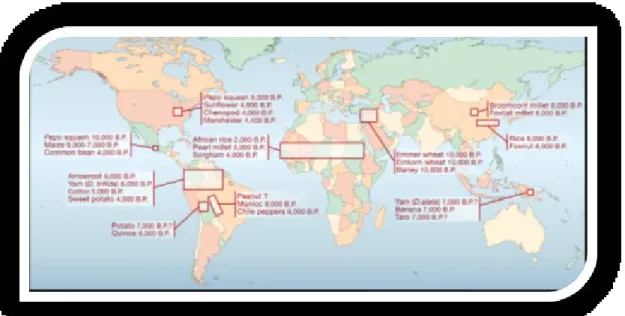
Today there are about a dozen of recognized centres of domestication (Doelby et al., 2006) differing in geographical location, size, number and diversity of domesticated species. These were localized in South East Asia (The Fertile Crescent), Africa (Ethiopia and the Sahel), Mesoamerica, the Andes and South America, West Asia and South China (Hawkes 1983; Harlan et al., 1992; Smartt and Simmonds 1995) (Figure 2.1).
Figure 2.1. – Distribution of the recognized independent centers of crop domestication
(Doelby et al., 2006).
Other areas, such as Africa, North America, India, New Guinea, East-North America and Europe were less relevant than previously thought (Kluyver et al., 2013). Different events occurred independently in different sites as parallel selection was exerted on similar traits across different species (Olsen and Wendel, 2013).
The phenotypic changes occurred during the domestication process were substantial, and many of these were in common among different domesticated plants. The set of common traits that characterize the species domesticated from their wild ancestors is known as domestication syndrome (Harlan et al., 1973; Hammer, 1984; Zohary, 1989; Fuller, 2007; Brown et al., 2009).
These traits include:
a) loss of the seed dispersal mechanism. The domesticated plants have lost the ability to disperse the seeds at maturity. This was achieved in different ways by the different species. For example in cereals, this was due to the loss of the “fragile rachis” trait which produces the disarticulation of the spike and the release of the seeds (Gepts, 2004);
b) increased number of seed and, fruit and seeds size size. The fruit and the seeds produced by domesticated plants are usually bigger than those of the wild progenitors. For example, wheat kernels are from 5 to 10 times bigger than those of the wild relatives (Gepts, 2004);
c) reduction of seed dormancy. The seeds of the domesticated plants are characterized by a reduced dormancy while wild ancestors usually have highly dormant seeds. The seed dormancy prevents premature germination and this can be particularly important under environmental conditions that may prevent the growth of seedlings. On the other hand, the lack of seed dormancy allow the growth of more uniform populations as all plants show similar developing stage (Gepts, 2004);
d) compact growth habit. Corn represents a fitting example as teosinte, its wild relative, shows a branching growth habit, which sharply contrasts with the uniculm architecture of the domesticated crop (Gepts, 2004). A compact growth habit allows more uniform growing conditions within the field, this reduces the competition among plants for resources such as water, soil nutrients and solar radiation and finally allows an increase in productivity and a non-scalar maturation and harvest (Evans 1993);
e) a decrease in the number (Kluyver et al., 2013) and angle of tillers (Jin et al., 2008): the wild species of Oryza rufipogon shows a prostrate growth habit with a wider tiller angle and short stature with many tillers. This plant architecture increases leaf shade
and therefore decreases photosynthetic efficiency,prohibiting dense plantings (Jin et al., 2008). Such undesirable plant architecture was targeted and continuously selected against by ancient humans, which gradually resulted in the more desirable plant architecture of domesticated rice (O. sativa). Domesticated rice shows relatively erect growth (a narrow tiller angle) and fewer tillers, which allows for effective high-yield cultivation. Therefore, plant-architecture selection was a pivotal event in rice domestication.
Effects of domestication
The greatest effect of domestication in crops has been the reduction of the genetic diversity compared to wild progenitors (Gepts, 2004; see Bitocchi et al., 2012 and 2013 for a comparison of bean with other species). Only a portion of the variability of the wild gene pool is today present in the gene pool of the domesticated species, especially in the improved varieties. However, the extent of this reduction varies depending on crop species. The initial agricultural practices led inevitably to variations in the levels of genetic diversity of the cultivated wild populations (Frankel, 1974). Moreover, the early farmers probably have selected a limited number of individuals for the cultivation; this lead to both demographic and selection bottleneck (Doelby et al., 1989; Glemin and Bataillon, 2009). The loss of diversity was a function of the size of the populations and the length of domestication (Eyre-Walker et al., 1998). In particular, the loss of diversity was not evenly distributed along the genome: it was much stronger for the selected loci (and for physically linked “neutral polymorphisms” due to hitchhiking) than for neutral loci that do not influenced the selected phenotypes (called genes neutral) (Wright et al., 2005; Doelby et al., 2006) (Figure 2.2).
Figure 2.2 – The effects of the domestication bottleneck (Doelby et al., 2006)
The common bean
Phaseolus vulgaris belongs to the genus Phaseolus that comprises 70 species; it is one of the five species of the genus, which have been domesticated (P. dumosus, P. coccineus, P. acutifolius, P. lunatus, P.vulgaris) (Delgado-Salinas et al., 2006). Both wild and domesticated forms of P. vulgaris are self-pollinating, diploid, with 2n = 2x = 22 chromosomes. The common bean (Phaseolus vulgaris L.) is the most important legume crop of the world for human consumption; it is a source of complex carbohydrates, protein, fiber and minerals (Broughton et al., 2003). The bean seeds contain about 20-25% protein, of these the highest percentage is constituted by the seed storage protein named phaseolin (Ma and Bliss, 1978).
Like other legumes, beans are a good source of micronutrients, more than cereals (Welch et al., 2000), as well as an important source of iron, phosphorus, magnesium; to a lesser extent, they are a source of zinc, copper and calcium (Broughton et al., 2003). For these reasons, in the last decades the cultivation of Phaseolus vulgaris showed a significant increase (Akibode and Maredia, 2011). The production is about of 12 million
tons per year (http://faostat3.fao.org/home/E), and the major production areas are Latin America and sub-Saharan Africa (Akibode and Maredia, 2011).
The domestication of Phaseolus vulgaris
The common bean is characterized by a particular evolutionary history. This species is native to South America and most likely its centre of origin is Mexico (Bitocchi et al., 2012). Several evidences lead to this outcome: the geographical distribution of the closest relatives, the highest genetic variability of wild Mesoamerican related species than wild species from South America, the occurrence of a heavy bottleneck in the Andes prior to domestication, and finally the presence of wild beans in Mesoamerica closely linked to the wild beans from South America both from the Andes and Ecuador-Peru (Bitocchi et al., 2012). The expansion in South America led to the development of two major wild gene pools: the Mesoamerican and the Andean (Figure 2.3).
Figure 2.3 – Domestication routes in common bean.
Domestication occurred afterwards with two independent events one in Mesoamerica and the other in the Andes (Bitocchi et al., 2012). The occurrence of these two events are supported by different studies based on different approaches: morphological traits (Delgado-Salinas et al., 1988; Sing et al., 1991), agronomic data (Sing et al., 1991), protein seed (Gepts et al., 1986), alloenzymes (Koening et al., 1989) and molecular markers (Bitocchi et al., 2013). The two independent domestication events have given rise to two domesticated gene pools sharply differentiated both at morphological, biochemical and molecular level (Papa et al., 2006; Acosta-Gallegos et al., 2007; Schmutz et al.,2014). The existence of these two geographically distinct and isolated, evolutionary routes of common bean is a unique pattern among the crops of particular interest.
Independent
domestications
Mesoamerican
gene pool
Northern Peru
and Ecuador
Andean
gene pool
Perù del Nord
ed Ecuador
Domesticazioni
indipendenti
Pool genico
Andino
Pool genico
Mesomericano
Mesoamerican gene pool Andean gene poolNorth Peru and Ecuador
Two independent domestication events
Domestication syndrome in Phaseolus Vulgaris
Domesticated and wild forms show marked phenotypic differences (Hawkes et al., 1983; Harlan et al.,1992). Two main characters selected during the domestication process are the reduction of seed dormancy and the loss of dehiscence of the pods; both these traits were crucial for adaptation to cultivated environments (Koinange et al., 1996). Other selected characters are: the determinate growth habit, the increase in size of the seeds and the pods and the reduced sensitivity to photoperiod. In general, it was also observed that the domesticated forms mature earlier than wild progenitors (Koinange et al., 1996).
The domestication of indehiscent fruit in legume crops
The fruit of the Leguminosae is called legume or pod. In the Leguminosae, seed dispersal occurs as a consequence of the shattering (or dehiscence) of the pod.
In Lotus corniculatus pod shattering is a major problem as high seed loss occur due to the scalar flowering and pod maturation (Grant et al., 1996) and at present, management practices have not been successful to control pod shattering. It has been observed that the orientation of the cells in the pericarp and the degree of lignification may affect this process. Environmental conditions are also implicated, having the relative humidity (between 35% and 49%) a major role at the time of harvest (Grant et al., 2006). Pod dehiscence under greenhouse and open field condition are uncorrelated. The trait is probably controlled by more than one gene and, despite it has a high heritability, in Lotus breeding the attempt to reduce shattering through recurrent selection has been unsuccessful. However, interspecific hybridization is suggested as a promising approach (Grant et al., 2006).
In cultivated soybean [(Glycine max Merr. (L.)] , the indehiscent pod is a major domestication trait that has been targeted by selection under domestication (Hymowitz, 1970; Harlan, 1992;Dong et al. 2014; Funatsuky et al., 2014). Pod shattering happens after the maturation stage, i.e., when humidity levels are low and dehydration of tissues
abscission layer along the suture between the two pod valves. After the maturation, dehydration leads to the distortion of pod tissues that accumulated elastic energy. When this latter overcomes the force that binds the two valves along the ventral suture, shattering occurs (Liljegren et al., 2004; Mitsuda and Ohme-Takagi, 2008; Ogawa et al., 2009).
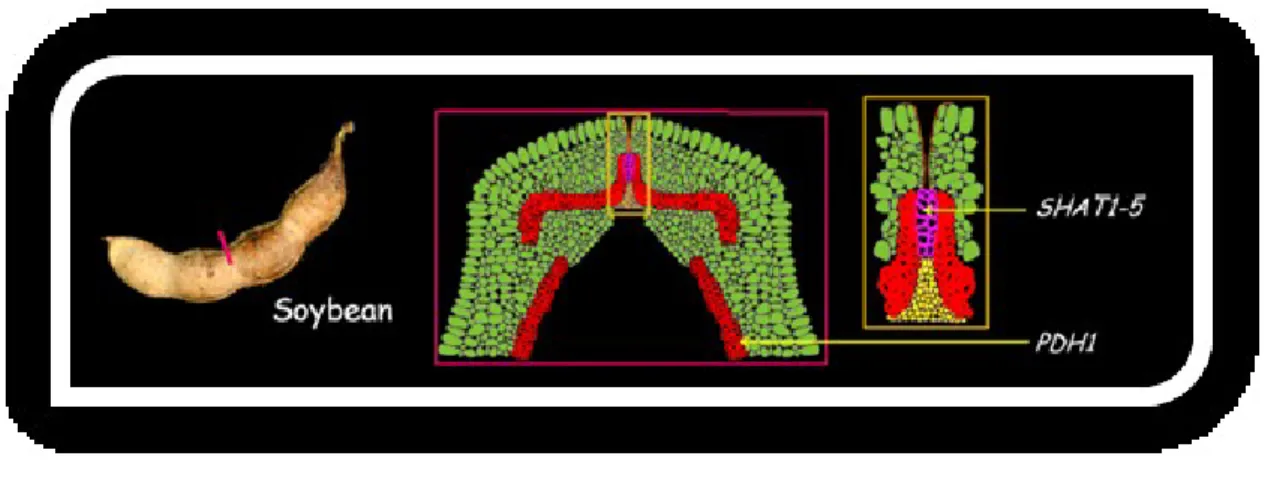
Cultivated soybean is more resistant to shattering than wild soybean (Glycine soja Sieb. and Zucc.). In a previous study, the genetic analysis conducted using a mapping population derived from the cross between wild and domesticated soybean did not allow the identification of major QTLs (Quantitative Trait Loci) for the shattering trait (Liu et al. 2007). However, more recently, a domestication shattering gene SHATTERING1-5 (SHAT1-5) has been mapped on chromosome 16 of soybean (Dong et al., 2014). This is an homolog of the A. thaliana AtNST1/2 that acts as a master transcriptional activator of secondary cell wall biosynthesis and it promotes the thickening of the “fiber-cap cells” along the ventral suture of the pod valves (Dong et al., 2014). The expression of SHAT1–5 is specifically localized in the developing fiber cap cells. Interestingly, the abscission layer is functional in both cultivated and wild soybeans (Dong et al., 2014) but SHAT1-5 is differentially expressed in wild and cultivated soybeans, being up-regulated in the wild, so that in indehiscent pods the fiber cap cells in the ventral suture show an extreme lignification which hinders pod shattering after maturation (Figure 2.4; Dong and Whang, 2015).
Figure 2.4 – Ventral section of soybean pod and tissues where SHAT1-5 and PDH1 act
In Arabidopsis double mutants plants (nst1-1 and nst3-1) characterized by indehiscent pods were developed (Mitsuda et al., 2005, 2007). These mutants are not able of thickening the secondary cell walls in the interfascicular fibers. But, when both the wild and the domesticated alleles of soybean SHAT1-5 are used to transform these Arabidopsis mutants, this ability is restored. Moreover, wild and domesticated soybeans did not show fixed amino acid difference between protein products of this gene. This suggests that the differential expression of SHAT1–5 could be due to regulatory changes. In addition, it has also been shown that up-regulation of SHAT1–5 is due to the disruption of a repressive cis-regulatory element in the 5′-promoter region (Dong et al., 2014). It has also been argued that selection under domestication favored changes in this part of the gene as null-mutants show undesirable pleiotropic effects.
Variability for the degree of shattering was also documented within the cultivated gene pools of soybean. The cultivated varieties less resistant to shattering were more resistant than the wild species though these were also not well adapted to the cultivation under conditions of low humidity, particularly for the mechanical harvest (Tsuchiya, 1987). In the cultivated soybean a major QTL (qPDH1, QTL for Pod Dehiscence 1) on chromosome 16 has been identified (Kang et al., 2009; Yamada et al., 2009). Anatomic analysis on NILs (near-isogenic lines) for this QTL did not evidence differences in the morphology of ventral suture included the formation of secondary cell wall (Suzuki et al., 2009). Moreover, the genomic region corresponding to this QTL did not contain homologs to Arabidopsis associated with pod dehiscence (Suzuki et al., 2010). Recently, the QTL qPDH1 has been cloned (Funatsuki et al. 2014) and it has been shown that it codifies for a “dirigent-like” protein whose expression is correlated with the lignin deposition in the inner sclerenchyma of the pod valves. This gene regulates the dehiscence increasing the twisting force in the pod wall at low humidity (Funatsuki et al., 2014). Moreover, the study of the geographical distribution of the allele conferring shattering resistance showed its relevance for the global expansion of soybean crop (Funatsuki et al. 2014).
A SNP that leads to a premature stop codon in PDH1 generates a truncated and non-functional protein and is responsible of the indehiscence of fruit in cultivated soybean (Funatsuki et al., 2014). However, molecular mechanisms leading to indehiscent pod by qPDH1 remain not fully resolved.
The results of Dong et al. (2014) and Funatsuki et al. (2014) as a whole suggest that domestication and breeding when acted to reduce shattering also indirectly acted upon several underlying genes, among which SHAT1–5 and PDH1. This suggests that the interaction among genes might be relevant to fine-tune the indehiscence degree of cultivated soybean that is adapted to different environments.
Similar to other legume crops, the reduction of pod dehiscence represents a key domestication syndrome in the domesticated common bean. Indeed, as for soybean and other crops the natural seed dispersal of the common bean became an undesirable trait when the plant was brought under cultivation. Pod dehiscence mechanism has been attributed to the presence of fibers surrounding the vascular bundle in the pod walls as well to the oblique orientation of the fiber in parchment layer lining the pod cavity (Roth, 1977). Decreased fiber content in the pod walls would reduce or retards the dehiscence (Wilke, 1972). After domestication selection for reduced pod fiber content pursued even further, eventually leading to fibreless pod type (“snap” or “stringless” bean in English, “mangetout” in French, “habichuela” or “ejote “ in Spanish) which do not open at all, even after maturity.
The first studies (sometimes contradictory) on the genetic control of pod wall characteristics in common bean can be traced back to more than one-hundred years ago. These studies distinguished two main types of pod wall 1) tough, parchment or fibrous, and 2) tender, non-parchment or fibreless.
Tshemark (1901, 1902) mentioned dominance of tough, parchment or fibrous over tender, non-parchment or fibreless. On the other hand, Emerson (1904) reported on crosses between stringy and stringless podded varieties. The pod of F1 progenies were sometimes intermediate between the two parents but overall found a strong tendency toward dominance of tenderness (stringless). Wellensiek (1922) crossed the stringy variety Wagenaar with three different stringless varieties. In all of the three F1 generations, stringless appeared to be dominant with clear-cut monohybrid segregation in F2. Tjebbes and Kooiman (1922) suggested the dominance of the parchment type. Joosten (1924) examined many stringless varieties and the degree of their stringlessness and point out the high variability of the character and the probable influence of external factors. Currence (1930), in crossing stringy and stringless varieties reported that crosses between fibrous and fibreless types gave F1 stringless in two case and intermediate in an another one. He explained his results on the basis of a model with
two genes interacting epistatically. Specifically, it assumed that the dominant gene “S” produces stringlessness and a second factor, T, when present inhibits the action of the first factor, i.e. only “SStt” and “Sstt” are stringless.
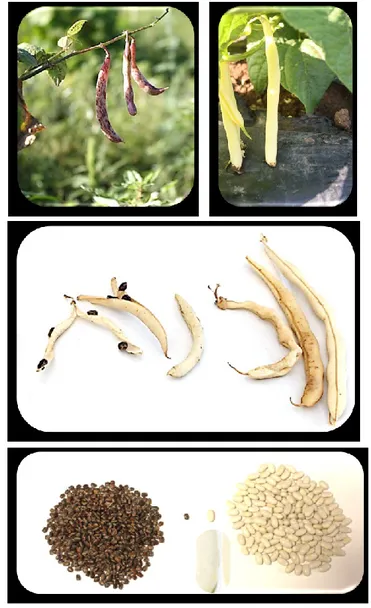
Lamprecht (1932) distinguished two main types “einfach gewolbt” (tough, parchment or fibrous) and “eigenshnurt” “tender, non-parchment or fibreless Lamprecht (1932) suggested that the quantity of fibers in pods valves (parchment) is controlled by a major gene (termed FA) and three additional genes with minor effects. The progressive accumulation of recessive alleles at these genes would be correlated to the reduction of shattering ability. (Figure 2.5)
Figure 2.5 – Left: the two main types of common bean recognized by Lamprecht
(1932) based on pod wall characteristics. Right: schematization of the hypothesis of Lamprecht (1932) on the genetic control of pod shattering in common bean.
Subsequently, Prakken (1934) hypothesized that the genetic control of the traits parchment and stringness (i.e. absence of filamentous fiber along the pod ventral suture) is independent. More in particular the study of Prakken (1934) provided several insights on the string strenght and toughness of the pod wall.
String strenght
Prakken (1934) observed that the strength of string mainly depends upon the percentage of fibers in the sheath of the vascular bundles in dorsal and ventral sutures. In all the analyzed plants a) the ventral sheath consisted of 4-to-7, the dorsal of 5-to-8 cell layers, b) in each sheath occured parenchymatic cells, wood cells and fibers; c) these three cell
types always have the same relative position. He observed that in the pure stringy type variety Wagenaar (Figure 2.6, n. 8) the sheath consists entirely of fibres, except for a narrow part in the middle. In the stringless type (Fijne tros) (Figure 2.6, n. 2 and 3) the sheath mainly consists of wood cells with the fibers forming four small groups. The F1 generation (Figure 2.6, n. 4, 5 and 6) was intermediate, though similar to the stringless type. In F2 the pure stringy Wagenaar type (“stst”) reappeared in a clearly unifactorial way. The percentage of fibres and the strength of string in homozygous and heterozygous “St” plants were influenced by other factors. In a sheath without or nearly without fibers the percentage of wood cells may slightly influence the strength of string. Toughness of the pod wall
A tough or parchmented pod wall was due to a fibrous layer between inner and outer parenchyma. In the stringless type Fijne tros variety the fibrous layer was totally lacking; the dry pod is conspicuously constricted and shrivelled. The stringy Wagenaar variety had a rather weak fibrous layer; only parts of its cells were lignified. In F1 the fibrous layer was extremely thick and hard; all its cells were lignified. The dry pod was not constricted or shrivelled at all. The segregation into non-parchmented (“toto”) versus parchmented (“ToTo”) was unifactorial. Prakken also provided the genotype for Fijne tros (stringless/non-parchmented) “StSt toto” and Wagenaar (stringy/parchmented) “stst ToTo”.
Figure 2.6 – Picture showing the distribution of the different cell types in the dorsal and
ventral sheaths of the pod valves in common bean as a function of the different degree of stringlessness (from Prakken, 1934).
Overall the data collected by Prakken (1934) suggests some parallelism with what has been observed in soybean (Dong et al. 2014; Funatsuki et al., 2014).
More than forty years later Drijfhout (1978) analysed string formation in F1, F2 and F3 generations of crosses between cultivars without string, with incomplete string and with complete string, and in BC1 and BC2 generations of the hybrid between a stringless and a stringy cultivar backcrossed to the stringless parent. Segregation ratios suggested that two genes were involved in string development:
Stringy
Stringless
- complete string being controlled by the recessive alleles of “St” (“stst”)
- incomplete string development, at high temperature and in genotypes with the dominant St allele, being controlled by the dominant allele of the second gene (“Ts”) (“StSt” or “Stst” with “TsTs” or “Tsts”). These results are somewhat similar to those found from Currence (1930).
Shelmidine and Hartmann (1984) collected evidences for two recessive genes and two dominant genes controlling string development in one bean population.
Taken all together, the data point toward a relatively simple determination of shattering in bean with probably not less than 2 and up to 3-4 genes involved.
It has been affirmed that the indehiscent fruit results from the loss of fibers in the sutures (“stringless”), which is under the control of a major QTL, St locus on linkage group 2. (Koinange et al., 1996).
Nanni et al. (2011) characterized a genomic sequence in Phaseolus vulgaris of 1,200 bp (PvSHP1) that is homologous to SHATTERPROOF-1 (AtSHP1), a gene involved in the control of fruit shattering in Arabidopsis thaliana. The gene AtSHP1 is involved with the Arabidopsis thaliana, INDEHISCENT gene (AtIND) in silique shattering. However, the PvSHP1 fragment was mapped to chromosome Pv06 in P. vulgaris (nor on chromosome Pv02 like the St locus) and it is linked to gene V, responsible for flower and seed color. Moreover, the polymorphisms in this gene are not associated with the shattering (Nanni et al. 2011). In Arabidopsis thaliana, the gene INDEHISCENT (IND) is the primary factor required for silique shattering. More recently, Gioia et al. (2012) mapped PvIND1, a homolog of AtIND, in common bean in a region near to the St locus on chromosome Pv02. Although PvIND maps near the St locus, it do not completely co-segregates with the St trait nor with the dehiscent/indehiscent phenotype. Gioia et al. (2012) concluded that PvIND may not be directly involved in pod shattering and may not be the gene underlying the St locus. These authors also called for a more precise phenotyping method to characterize shattering in common bean.
Recently, Dong and Whang (2015) underlined that while Gioia et al. (2012) postulated PvIND as the AtIND homolog based on sequence homology in the conserved b-HLH domain and it is possible that polymorphisms in other AtIND homologs in common bean may be associated with pod indehiscence. They based their two observations on: a) the IND-related transcription factors are specific to Brassicaceae; b) the role of AtIND in the shattering of A. thaliana may have been acquired since the duplication event
recently occurred in the Brassicaceae HECATE3 (HEC3) gene clade (Liljegren et al., 2004; Girin et al., 2011). However, as fibers are mainly composed of sclerenchyma cells with well-developed secondary cell walls, it is also likely that genes involved in the regulation of secondary cell wall deposition or fiber cell differentiation may have contributed to control pod dehiscence in the St locus (Dong and Whang, 2015).