EXPONENTIALLY WEIGHTED MOVING AVERAGE
CONTROL SCHEMES FOR ASSESSING HOSPITAL
ORGANIZATIONAL PERFORMANCE
Michele Scagliarini1
Department of Statistical Sciences, University of Bologna, Bologna, Italy Mariarosaria Apreda
Department of Statistical Sciences, University of Bologna, Bologna, Italy Ulrich Wienand
Research, Innovation, Quality and Accreditation Office, Ferrara University Hospital, Italy Giorgia Valpiani
Research, Innovation, Quality and Accreditation Office, Ferrara University Hospital, Italy Nicola Napoli
Performance Analysis and Programming Office, Ferrara University Hospital, Italy
1. Introduction
Healthcare organizations are continuously involved in quality improvement pro-grams and performance indicators are often suggested as key elements to cap-ture information on clinical, organizational and financial processes. The challenge is thus to select useful statistical tools for accurately monitoring and providing benchmarks for such indicators.
Statistical process control (SPC) provides a method both for assessing undis-turbed, or steady-state, process behaviour and for detecting positive or negative changes in performance. The relevance of SPC in the healthcare context is con-firmed in reviews by Benneyan et al. (2003) ,Thor et al. (2007), Noyez (2007) and Woodall et al. (2012); in books by Carey (2003), Winkel and Zhang (2007), Faltin et al. (2012), Morton et al. (2013) and Melo and Beck (2014); and in methodolog-ical notes by Mohammed et al. (2008), Mohammed and Worthington (2013) and Mohammed et al. (2013).
Among the statistical process control tools, the exponentially weighted moving average (EWMA) control charts are widely used for industrial quality control, since they are especially suited for detecting small shifts in a process. EWMA control schemes have been found effective also for measuring and monitoring healthcare
outcomes. Several examples of applications that include the use of EWMA con-trol charts are as follows: performance monitoring in cardiac surgery (Smith et al., 2013); early detection of abnormal patient arrivals at hospital emergency de-partment (Harrou et al., 2015); monitoring the incidence of adverse drug reactions (Dong et al., 2008); monitoring nosocomial infection rate (Gomes et al., 2011).
The Ferrara Sant’Anna University Hospital employs 2, 628 staff, houses 626 beds for inpatients and 85 for those receiving day-hospital care. In 2013, admis-sions amounted to 22, 647 and day-hospital patients were equal to 9, 048. Since 2001, hospital managers have developed a web-based performance measurement system: 768 internal and 67 external measures, with a view to improve service provision, accountability and care quality (Wienand et al., 2014). This perfor-mance measurement system was designed according to the guidelines developed by the Italian government and is continuously updated. Furthermore, it is suit-ably integrated with the performance assessment tool for quality improvement in hospitals (PATH) developed by the World Health Organization (WHO) regional office for Europe (Veillard et al., 2005).
Within this framework, hospital managers decided to monitor several clinical, organizational and economic indicators through a suitable method with the aim to improve understanding of processes and increase performance.
An important organizational indicator is the Operating Room (OR) Turnaround Time (TaT). The Operating room TaT is defined as the time between incision close of patient n to incision open of patient n + 1. It is a key process indicator for hospital business management: delays in OR TaT lead to a reduced number of surgical interventions per day with a consequent increase in costs and decrease in efficiency.
The aim of this study was to investigate the utility and potentialities of the EWMA control schemes for assessing the steady-state behaviour of the process and for the early detection of changes indicating either improvement or deterioration in the perioperative process performance. Furthermore, it has been taken in to account that process parameters were unknown and were estimated from an in-control historical (Phase I) data set: a situation that often occurs in the healthcare framework.
A retrospective analysis of the OR TaT data, conveniently extracted from the hospital information system, was carried out. EWMA control schemes were set up and used to monitor process mean and process dispersion. Note that in SPC literature most of the studies on EWMA control schemes have concentrated on monitoring the process mean. Relatively little attention has been given to the EWMA for monitoring the variability, although equally important (Maravelakis and Castagliola, 2009; Castagliola, 2005). Moreover, to the best of our knowledge, it has never been used in the healthcare framework.
On the basis of the results obtained, EWMA control schemes constitute a reliable and comprehensive means to identify the steady state behaviour of the process and to quickly detect positive or negative changes in process performance.
TABLE 1
Descriptive statistics for OR1 TaT (minutes) First Quartile 34.75
Median 50.00
Third Quartile 70.00
Mean 57.44
Standard Deviation 40.68
OR1 Turnaround Time (minutes)
0 50 100 150 200 250 300 350
0.000
0.005
0.010
0.015
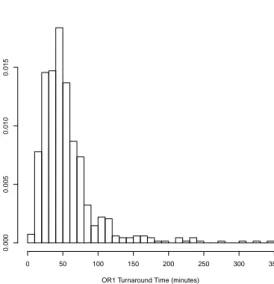
Figure 1 – Histogram of the operating room 1 TaT (minutes)
2. The data
The Hospital Quality Department decided to focus its attention on the five operat-ing room suites located in Block 24. For these ORs, the data from January 2013 to February 2014 were examined considering only the elective surgeries performed on weekdays: in total the surgical operations amounted to 2, 469. In particular, the OR 1 was considered in detail, which was the most used with 680 (28%) surgical operations. Table 1 contains several descriptive statistics, and Figure 1 shows the histogram of the TaT of operating room 1.
The data were highly positively skewed as evidenced by the histogram and by the estimated moment coefficient of skewness: bγ1= 2.93.
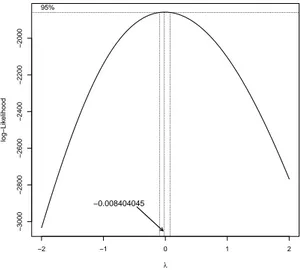
The run length properties of the EWMA control charts were obtained under the assumption of normality and can be strongly influenced by asymmetry (Jones et al., 2001; Maravelakis and Castagliola, 2009). Therefore, in order to at least reduce the asymmetry, a Box-Cox power transformation (Carrol, 1988) was performed using the R package ”car” (Fox and Weisberg, 2011). The optimal lambda value was determined using a profile log-likelihood approach (Figure 2) and resulted:
−2 −1 0 1 2 −3000 −2800 −2600 −2400 −2200 −2000 λ log−Lik elihood 95% −0.008404045
Figure 2 – Profile Log-likelihood for Box-Cox transformations
λ =−0.0084.
Although not normally distributed (Shapiro-Wilk normality test: p < 0.01), the transformed data, see Figure 3, exhibited only a slight departure from sym-metry: bγ1=−0.0019.
Therefore, transformed data were used in the rest of the work for performance monitoring.
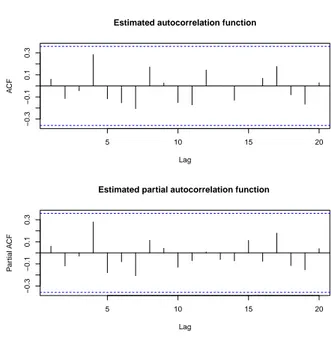
A standard assumption when using EWMA control charts is that the obser-vations taken from the process are independent. Thus, we also investigated the presence of autocorrelation and seasonality. Figure 4 shows the estimated OR TaT autocorrelation and partial autocorrelation functions (weekly averages). The results show that there were no significant autocorrelations or seasonality patterns in the data.
3. EWMA control charts
Interest was placed in monitoring the mean and the variability of the transformed operating room TaT per week. In the time interval of interest, the total number of surgical operations per week was variable. On average 12.15 surgical inter-ventions were performed per week (minimum=3, median=12, maximum=26 and mode=7). In this framework, the week was considered as a suitable ”small win-dow of time” representative of a stable process subject only to natural variation. Furthermore, owing to the non-elevated number of surgical interventions per week and to the much less emphasis placed in healthcare settings compared to the in-dustrial SPC on sampling only a portion of the output of a process at periodic intervals (Woodall, 2006), it was decided to consider all the surgical interventions
Trasformed OR1 Turnaround Time 2 3 4 5 0.0 0.2 0.4 0.6 0.8
Figure 3 – Histogram of transformed data for OR 1 TaT
5 10 15 20 −0.3 −0.1 0.1 0.3 Lag A CF
Estimated autocorrelation function
5 10 15 20 −0.3 −0.1 0.1 0.3 Lag P ar tial A CF
Estimated partial autocorrelation function
performed each week. Therefore, it was appropriate to use control charts with variable sample size.
In order to monitor the transformed operating room TaT, the unknown in-control process mean µ0 and process standard deviation σ0 had to be estimated
from an in-control historical (Phase I) data set.
For the development of Phase I, the first m = 30 weeks were considered (Jan-uary 2013-August 2013). A commonly used unbiased estimator for the parameter µ0 is bµ0= X = ∑m i=1nixi ∑m i=1ni (1) and an unbiased estimator for the parameter σ0, suited for the case of variable
sample size (Montgomery, 2012; SAS, 2014), is bσ0=
s1/c4(n1) + s2/c4(n2) + ... + sm/c4(nm)
m (2)
where ni is the sample size, xi is the sample mean, si is the sample standard
deviation of the i-th subgroup (week), m is the total number of subgroups and c4(ni) is the value of the factor c4 for samples of size ni (Montgomery, 2012).
The EWMA control scheme is based on the moving average of current and past observations with the weights of the past observations decrease exponentially as in a geometric series (Roberts, 1959). The exponentially weighted moving average statistic for the i-th subgroup is defined recursively as
Zi = λxi+ (1− λ)Zi−1 (3)
where λ is a weight parameter (0 < λ ≤ 1). When the process mean is known Z0= µ0 otherwise Z0= X.
In the case of variable sample size the EWMA control chart for monitoring the process mean (EWMA-X) is (Montgomery, 2012; SAS, 2014):
CL = X (4) U CL = X + Lbσ0 v u u tλ2 i−1 ∑ j=0 (1− λ)2j/n i−j (5) LCL = X− Lbσ0 v u u tλ2 i−1 ∑ j=0 (1− λ)2j/n i−j (6)
The choice of λ and L determines the in-control and out-control perfomance of the chart Crowder (1989); Lucas and Saccucci (1990). In general, values of λ in the interval 0.05 ≤ λ ≤ 0.25 work well in practice also in cases where the parameters µ0 and σ0 are estimated from a set of preliminary samples (Jones et
al., 2001; Montgomery, 2012). In the case at hand, λ = 0.1 and L = 2.703 were chosen: in such a way, the in-control average run length (ARL0) of the EWMA-X
The EWMA control chart for monitoring the process standard deviation was introduced by Crowder and Hamilton (1992). Recently, Maravelakis and Castagli-ola (2009) proposed a modified EWMA control chart for the process variability (EWMA-ln(S2)) suitable for the cases where parameters µ
0and σ0are estimated
from an in-control Phase I data set.
Specifically the EWMA-ln(S2) statistic is
Zs,0= zs,0 (7) Zs,i = max ( λsln ( s2i/bσ02 ) + (1− λs)Zs,i−1, 0 ) (8) where 0 < λs ≤ 1 and 0 ≤ zs,0 ≤ UCL is a constant used as initial value. The
upper control limit U CL, suitably adapted for the case of variable sample size, is given by U CL = K √( λs 2− λs ) ( 2 ni− 1 + 2 (ni− 1)2 + 4 3(ni− 1)3 − 16 15(ni− 1)5 ) (9) where K is a constant chosen together with λs so as to achieve the desired
per-formance of the chart.
Maravelakis and Castagliola (2009) studied in detail the run length proper-ties of the EWMA-ln(S2) control chart for several sample size values n (n =
3, 5, 7, 9) and for several values of the number of preliminary subgroups m (m = 10, 20, 40, 80). In the case at hand, with zs,0 = 0, λs = 0.332 and K = 1.913
were chosen, optimally designed to detect a relative shift τ = σ1/σ0 = 1.4 when
σ0 is estimated from a Phase I data set consisting of m = 40 subgroups of size
n = 9 (see Table 2 in Maravelakis and Castagliola (2009)). In such way, the case under study was reasonably approximated where the Phase I data set consisted of m = 30 subgroups with an average sample size of 12.15. As for the EWMA-X chart, the ARL0 of the EWMA-ln(S2) control chart was equal to 370.4.
The EWMA-ln(S2) control chart, obtained using R (R Core Team, 2013), and
the EWMA-X control chart, obtained using the R package qcc (Scrucca, 2004), for the m = 30 preliminary samples are shown on the left side (Calibration) of Figures 5 and 6 respectively.
4. Results
Process parameters estimates should be based on a process that is in control. Therefore, the two points near the U CL (weeks 16 and 18) in the calibration data of the EWMA-ln(S2) chart (Figure 5) were investigated seeking common features that might indicate a non-random cause for their occurrence. No con-sistent assignable cause was found for these data points and considering that few ”out-of control” points (in the case at hand none, since only two EWMA statistics near but below UCL were observed) do not distort the control limits significantly (Montgomery, 2012), it was chosen to retain these data and keep the parameter estimates unchanged.
0.0 0.2 0.4 0.6 0.8 1.0 1.2 1 3 5 7 9 12 15 18 21 24 27 30 33 36 39 42 45 48 51 54 subgroups (weeks) EWMA ln ( S 2) EWMA ln(S2)
control chart for preliminary samples (weeks) and new data
Calibration Data in OR1_TAT[1:30] New Data in OR1_TAT[31:56]
UCL
Figure 5 – EWMA control chart for the standard deviation: preliminary samples
(Cali-bration from week 1 to week 30); new observations (from week 31 to week 56)
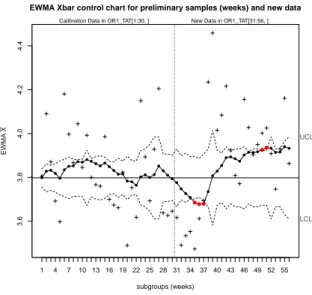
EWMA Xbar control chart for preliminary samples (weeks) and new data
subgroups (weeks) EWMA X 1 4 7 10 13 16 19 22 25 28 31 34 37 40 43 46 49 52 55 3.6 3.8 4.0 4.2 4.4 LCL UCL
Calibration Data in OR1_TAT[1:30, ] New Data in OR1_TAT[31:56, ]
Figure 6 – EWMA control chart for the process mean: preliminary samples (Calibration
On the basis of these preliminary samples, the following was obtained: bµ0 =
X = 3.768 and bσ0 = 0.591 which were calculated using the transformed data.
However, since it was of interest for the Hospital Quality Department to know the ”in-control” process mean and variability of the original data, also the corre-sponding estimates on the untransformed data were computed: the average OR TaT was 55.65 minutes, and the standard deviation was 41.20 minutes.
Therefore, once assessed the stability of the process in the preliminary samples, the remaining data were retrospectively monitored: 26 weeks from week 31 to 56. On studying the control charts from week 31 it can be noted that: the EWMA-ln(S2) control chart (Figure 5) did not show any systematic behaviour or out-of control points, while very different results were observed in the EWMA-X control chart (Figure 6).
The EWMA chart for the process mean showed a sequence of points (weeks from 35 to 37) below the LCL (Figure 6). Then, as of week 39 the EWMA statistic is constantly rising with two out-of control points on weeks 50 and 51.
With the benefit of hindsight in such a retrospective study, it is possible to know where to look for any anomalies in the control charts. However, it is in-controvertible that as of week 39 the performance monitored by the EWMA-X control chart degraded slightly: the systematic increase in the EWMA statistic indicates a persistent shift in the process mean.
On 1 October 2013 (week 39), an important change occurred in the OR orga-nizational system. Patient transportation from and to the operating room, until then carried out by internal hospital staff, was entrusted to an external private company.
Summarising, monitoring the process from August 2013 through February 2014, an increment in average OR TaT appeared during the first week of October 2013, coinciding with the change of the patient transfer service. The increase is significant, from a former average of 55.65 minutes of non-operative time between operations (for the preliminary samples) to 66.13 minutes (for the period Octo-ber 2013, February 2014). Furthermore, given the above considerations, a very tentative explanation of the sequence of points (from week 35 to week 37) below the LCL (Figure 6) might be that the awareness of future changes in the OR working conditions might have affected the internal hospital staff with consequent improved performances.
5. Discussion and conclusions
Surgical suites and the perioperative environment of hospitals are resource in-tensive, high-cost and high-risk areas wherein performance is pivotal for patients’ health as well as hospitals’ reputation and financial position. Obtaining and main-taining the position of a high performing operating room in large modern hospitals requires access to and processing of data that only a well-founded performance measurement system can provide. Within this framework, managers of health care organizations need to evaluate and monitor performance indicators. More-over, they also need to find benchmarks to reduce costs and increase efficiency. The challenge is thus to select a useful statistical tool for accurately monitoring
and providing benchmarks for such indicators.
This work focused on the OR TaT. In the European Union the cost of each OR wasted minute can easily be greater than e 30. Hence, the OR TaT can be extremely expensive. This measure is also a good organizational performance indicator.
The aim of this study was to determine whether EWMA chart monitoring is feasible for organizational performance. The mean and standard deviation of the operating room turnaround time were estimated from an in-control historical (Phase I) data set and were monitored retrospectively. Note that to our knowledge the EWMA control charts for the process variability have never been used in the healthcare framework.
The results showed that the EWMA charts were able to asses the undisturbed, or steady-state, process behaviour and to maintain or improve the quality of per-formance by detecting problems early on, and then instituting corrective actions. In particular, a deteriorating process performance was detected in coincidence with the change in OR patient transfer staff.
To sum up, EWMA control schemes can be useful in helping decision makers to achieve institution goals and objectives. Consequently, on the basis of these results, hospital managers are designing an operating room dashboard provided also with EWMA control charts.
Acknowledgements
The authors are grateful to the Editor and the Reviewers for their valuable sug-gestions which helped in improving the paper.
References
J. C. Benneyan, R. C. Lloyd, P. E, Plsek (2003). Statistical process control as a tool for research and healthcare improvement. Quality and Safety in Health Care, 12(6), pp. 458-464.
R. G. Carey (2003). Improving healthcare with control charts. Basic and ad-vanced SPC methods and case studies. ASQ-Quality Press, Milwaukee.
R. J. Carroll, D. Ruppert (1988). Transformation and Weighting in Regres-sion. Chapman and Hall, New York.
P. Castagliola (2005). A new S2-EWMA control chart for monitoring the pro-cess variance. Quality and Reliability Engineering International, 21(8), pp. 781-794.
S. V. Crowder (1989). Design of Exponentially Weighted Moving Average Schemes. Journal of Quality Technology, 21(2), pp. 155-162.
S. Crowder, M. Hamilton (1992). An EWMA for monitoring standard devia-tion. Journal of Quality Technology 24(1), pp.12-21.
Y. Dong, A. S. Hedayat, B. K. Sinha (2008). Surveillance Strategies for De-tecting Changepoint in Incidence Rate Based on Exponentially Weighted Moving Average Methods. Journal of the American Statistical Association, 103(482), pp. 843-853.
F. Faltin, R. Kenett, F. Ruggeri(2012). Statistical Methods in Healthcare. John Wiley and Sons Ltd, Chichester.
J. Fox, S. Weisberg (2011). An R Companion to Applied Regression, Second Edition. Sage, Thousand Oaks.
I. C. Gomes, S. A. Mingoti, C. Di Lorenzo Oliveira (2011). A novel ex-perience in the use of control charts for the detection of nosocomial infection outbreaks. Clinics 66(10), pp. 1681-1689.
F. Harrou, Y. Sun, F. Kadri, S. Chaabane, C. Tahon (2015). Early de-tection of abnormal patient arrivals at hospital emergency department. 2015 International Conference on Industrial Engineering and Systems Management (IESM), pp. 221-227, IEEE Seville.
L. Jones, C. Champ, S. Rigdon (2001). The performance of exponentially weighted moving average charts with estimated parameters. Technometrics, 43(2), pp. 156-167.
J. Lucas, M. Saccucci (1990). Exponentially weighted moving average control schemes: Properties and enhancements. Technometrics ,32(1), pp.1-12.
P. E. Maravelakis, P. Castagliola (2009). An EWMA chart for monitoring the process standard deviation when parameters are estimated. Computational Statistics and Data Analysis, 53(7) pp. 2653-2664.
S. Melo, M. Beck (2014). Quality Management and Managerialism in Health-care. Palgrave Macmillan, Basingstoke.
M. A. Mohammed, P. Worthington, W. Woodall (2008). Tutorial notes on how to plot some basic control charts. Quality and Safety in Health Care, 17(2), pp. 137-145.
M. A. Mohammed, P. Worthington (2013). Why traditional statistical process control charts for attribute data should be viewed alongside an xmr-chart. BMJ Quality and Safety 22(3), pp. 263-269.
M. A. Mohammed, J. S. Panesar, D. B. Laney, R. Wilson (2013). Statistical process control charts for attribute data involving very large sample sizes: a review of problems and solutions. BMJ Quality and Safety 22(4), pp. 362-368. D. C. Montgomery (2012). Introduction to statistical quality control, 7th edn.
John Wiley and Sons, New York.
A. Morton, K. Mengersen, M. Whitby, G. Playford (2013). Statistical Methods for Hospital Monitoring with R. John Wiley and Sons Ltd, Chichester.
L. Noyez (2009). Control charts, Cusum techniques and funnel plots. A review of methods for monitoring performance in healthcare. Interactive Cardiovascular and Thoracic Surgery, 9(3), pp. 494-499.
R Core Team (2013). R: A language and environment for statistical computing. R Foundation for Statistical Computing, Vienna.
S. Roberts (1959). Control chart tests based on geometric moving averages. Tech-nometrics 1(3), pp. 239-250.
SAS Institute Inc. (2014). SAS/QC 13.2 User’s Guide. SAS Institute Inc., Cary.
L. Scrucca (2004). qcc: an R package for quality control charting and statistical process control. R News, 4(1), pp. 11-17.
I. R. Smith, M. A. Gardner, B. Garlick, R. D. Brighouse, J. Cameron, P. S. Lavercombe, K. Mengersen, K. A. Foster, J. T. Rivers (2013). Performance Monitoring in Cardiac Surgery: Application of Statistical Process Control to a Single-site Database. Heart, Lung and Circulation 22(8), pp. 634-641.
J. Thor, J. Lundberg, J. Ask, J. Olsson, C. Carli, K. P. Hrenstam, M. Brommels (2007). Application of statistical process control in healthcare improvement: systematic review. Quality and Safety in Health Care, 16(5), pp.387-399.
J. Veillard, F. Champagne, N. Klazinga, V. A. Kazandjian, O. A. Arah, A. L. Guisset (2005). A performance assessment framework for hospitals: the WHO regional office for Europe PATH project. International Journal for Quality in Health Care, 17(6), pp. 487-496.
U. Wienand, G. Rinaldi, G. Gianesini, A. Ferrozzi, L. Poretti, G. Valpiani, A. Verzola (2014). Management of Healthcare Processes Based on Measurement and Evaluation: Changing the Policy in an Italian Teaching Hospital. International Journal of Reliable and Quality, 3(2), pp. 15-35. P. Winkel, N. F. Zhang (2007). Statistical Development of Quality in Medicine.
John Wiley and Sons Ltd., Chichester.
W. H. Woodall (2006). The use of control charts in health-care and public-health surveillance (with discussion). Journal of Quality Technology 38(2), pp. 89-134. W. H. Woodall, B. M. Adams, J. C. Benneyan (2012). The Use of Con-trol Charts in Healthcare. In F. Faltin, R. Kenett, F. Ruggeri (Eds.) Statistical Methods in Healthcare, pp. 253-267, Wiley, New York.
Summary
Exponentially weighted moving average (EWMA) control charts have been suc-cessfully used in recent years in several areas of healthcare. Most of these ap-plications have concentrated on the problem of detecting shifts in the mean level of a process. The EWMA chart for monitoring the variability has received, in general, less attention than its counterpart for the mean, although equally impor-tant and, to the best of our knowledge, it has never been used in the healthcare framework. In this work, EWMA control charts were applied retrospectively for monitoring the mean and variability of a hospital organizational performance in-dicator. The aim was to determine whether EWMA control charts can be used as a comprehensive approach for assessing the steady-state behaviour of the process and for early detection of changes indicating either improvement or deteriora-tion in the performance of healthcare organizadeteriora-tions. The results showed that the EWMA control schemes generate easy-to-read data displays that reflect process performance allowing a continuous monitoring and prompt detection of changes in process performance. Currently, hospital managers are designing an operating room dashboard which also includes the EWMA control charts.
Keywords: Perioperative System Performance; Statistical Process; Control; Ex-ponentially Moving Average Control Charts; Organizational Indicator; Healthcare Institutions