A comparison
between experimental
and theoretical
excitation
functions
for the O++ H2 (4A”) system using trajectory
calculations
over a wide
energy range
Miguel Gonz&iez, a) Miquel Gilibert, Antonio Aguilar, and R. Say6s
Departament de Q&mica Ffsica, Facultat de Quimica, Universitat de Barcelona, Marti i Franquh, I, 08028 Barcelona, Spain
(Received 24 August 1992; accepted 27 October 1992)
The O+ + Hz prototypic ion-molecule reaction was recently studied in our group using the quasiclassical trajectory method on a ground model potential-energy surface of the system inferred from both experimental and theoretical information and reasonable assumptions, fit- ted using a London-Eyring-Polanyi-Sato surface modified to include an ion-induced-dipole interaction term. The theoretical results previously reported agreed rather well with the avail- able experimental information. In view of the latest experimental findings, we present in this contribution the results of new trajectory calculations on the above-mentioned surface, cover- ing a wide range of relative translational energies of reactants. The accord between the exper- imental determinations and the present theoretical evaluations is excellent at relative energies below 1.0 eV, while for higher energies the potential-energy surface, even though still yielding reasonably good results, provides a worse agreement. The observed discrepancies should be attributed either to the too attractive character of the surface or to the interfering influence of the competing O+ + Hz + 0 +H$ charge-transfer process.
I. INTRODUCTION
The moderately exothermic hydrogen-atom transfer ion-molecule reaction:
0+ (4S) +H2(X ‘Zg’) -+OH+(X 32-) +H(%), A.@= -0.53 eV, and its isotopic variants:
(1) O+(4S) +D2(X ‘Zg’) -+OD+(X 32-> +D(2S), @=-OS0 eV O+(4S) +HD(X *8gf) +OH+(X 38-) +D(2S>, A.@= -0.50 eV, -+OD+(X 32-) +H(2S), (2) (3) A@=-0.55 eV (4)
provide a good opportunity of studying an ion-molecule system for which, unlike other similar related reactions,“2 only the ground 4A” potential-energy surface (PES) is likely to be necessary to achieve a reasonably accurate de- scription of the dynamical features of this system. Most of the experimental3 as well as the theoretical495 data available about the lowest-lying 4A” PES pointed towards the exist- ence of a well on the collinear path leading from reactants to products which disappears for insertion geometries, giv- ing rise to a barrier of about 4 eV.3 With this in mind, we
“‘Author to whom correspondence should be addressed.
derived recently6 a plausible analytical PES for this system, assuming that it must proceed mainly through C,, config- urations, only beginning to deviate from collinearity for moderate or high relative energies. The only structural in- formation available about the 4A’r surface that could be usedto construct the analytical PES, was the geometry and energy of the C,, l.48- minimum. Given that for this stationary point, there was also a certain discrepancy as to its geometry and exact energetic placement,4’5 they had to be corrected to match the asymptotic spectroscopic data available. Finally, values of R,,= 1.191 A, RHH= 1.058 A, and an energy of 8.8 kcal/mol below products were adopted6 as a reasonable guess for the collinear minimum to build the PES. In a subsequent work,’ we reexamined the energy change of reaction ( 1) (A,??) as well as the geometry and energy of the OH; (4Z-) collinear mini- mum of the ground PES using large basis sets and accurate ab initio configuration-interaction (CI) calculations, cali- brating the CI expansions against the full CI solution for the atoms and molecules involved. According to these find- ings, the ab initio CI AE value ( -0.30 eV) was still 0.1.5 eV above the experimental determination ( -0.45 eV, ob- tained by correcting the reaction enthalpy change with the zero-point energies of reactants and products), mainly due to the error in the ionization potential of oxygen. Thus, as the theoretical energy of the O+ +H2 asymptote has a sub- stantial error, the 1 42- collinear minimum depth was’de- termined with respect to the OH+ + H product asymptote, calculated with very little error. Optimizing the geometry for this minimum led to Roan and RHH distances of 1.12
2928 Gonzalez ef a/.: Excitation functions for the O+ +H2(4A”)
ment with the results of Ref. 5, and an actual depth of 7.79 kcal/mol with respect to products. These high-quality ab initio CI values confirmed our previous suppositions about the geometry and energy of the minimum. Taking into account the large computational cost necessary for an ad- equate extensive ab initio calculation to take place, as well as the large errors in the reactant asymptote, as will be proven below our PES represents a good starting point from which to obtain a better PES for this system.
For the analytical functional form, a fit of the geome- try and energy of the collinear minimum using a London- Eyring-Polanyi-Sato (LEPS) surface with an ion- induced-dipole correcting term (hereafter termed LEPS- IDI) described elsewhere8 was employed. The PESs satisfying the necessary requirements were then tested to reproduce the different experimentally determined dynam- ical properties available. Harris and Leventhal’ measured the translational exoergicity Q(v) in laboratory for reac- tion (2). The experimental data follows the spectator strip- ping model” (SSM) quite well and evidence a high degree of vibrational excitation for the OD+ molecules produced. The quasiclassical trajectory (QCT) results on our LEPS- ID1 surface also exhibit a good agreement with the SSM expectations at energies above 3.1 eV, while fitting well to this model at lower energies if the electronic exoergicity is added to the SSM values. The ratio of cross sections for reactions (3 ) and (4) determined by Gillen, Mahan, and Winn at 6.3 eV (Ref. 12) also match well the QCT results obtained on this PES.” In accordance with the experimen- tal fmdings,3~9”2 a reaction-mode analysis of this system evidenced a direct character for the trajectories over almost the whole energy range explored. Using the experimental rate-constant measurement of Smith, Adams, and Miller13 and approximating the rate constant at 300 K as the prod- uct of the cross section (S,) by the relative velocity of reactants (u,), the estimated S, (83 A2) and those obtained from QCT (86.4 A’) fall very near each other and also not far from the value resulting from the Langevin model”
(LGS) (75 A2). Also, on plotting the S, vs ET dependence for the QCT results, a behavior of the type S,cc EFm is found, with m=0.60, 0.63, and 0.59 for H,, D,, and HD, respectively, not very far from the expected 0.50 if the system was to behave according to the LGS assumptions. The behavior of the fitted PES agreed also with the exper- imental observation by Gillen, Mahan, and Winn12 that the forward/backward ratio of trajectories scattered in the center-of-mass system (f/b) was always greater for reac- tion (3) than for reaction (4). The different f/b values observed in reactions ( 1) to (4) as well as the strikingly different behavior of the opacity function for reactions (3) and (4) were explained in terms of angular momentum constraints.” Similarly, the enhancing effect of vibrational energy on promoting reaction (3) over (4) was explained” by taking into account the different shapes of the PESs for both reactions when considering a skewed-scaled represen- tation of the collinear PES.
There exist several recent experimental contributions on the dynamics of the O+ + H, system and isotopic vari- ants. The most comprehensive ones are those of Armen-
trout and co-workersr4”’ using guided-ion-beam mass spectrometry (GB) between 0.01 and 10 eV translational energy in the center-of-mass framework. In the lower ET range, these results match quite well those of Dateo and Claryr6 obtained within the adiabatic capture centrifugal sudden approximation ( ACCSA) approach. Another ex- perimental work by Flesch and Ng (Ref. 17) suggests that a charge-transfer process may play an important role in determining the behavior of S, with ET- The results in Ref. 14 are, in general, consistent with earlier molecular-beam determinations of Johnson and Henchman (B) . l8 A plot of the different theoretical and experimental information available about this system and isotopic variants is pre- sented in Figs. 2(a)-2(d).
In view of these recent theoretical and experimental developments, it seems clear that a reevaluation of the va- lidity and accuracy of the LEPS-ID1 surface used in our previous contributions6,8 is opportune.
II. CALCULATION METHOD
A. Analytical potential-energy surface
To understand better the results of the trajectory cal- culations, it may be interesting to describe first in some
290
190
g
w
090
-l,oa
0 0 0 0 0 0 Well 17
0 Well 2 0 Barrier 0 0 0 0 0 0 nq onnu,~
O 8
q q n q I 1 1 1’ 60 90 120 150 180 OHH angle (“) 870 b 690 g 4,0 O 0 w 2,0 1 0 0 0 0 090 OOO ooooo 00000 -2,0 I * 1 * 1 ’ 1 ’ 1 ’ 80 100 120 140 160 180 OHH angle (“)FIG. 1. (a) Evolution of the energy of the two wells and the barrier on the 4A” LEPS-ID1 surface with the OHH angle. (b) Bending potential with the ROH and RHH interatomic distances held fixed at their values for the C,, minimum. Energies referred to reactants.
detail the main topological features of the analytical PES. As stated in the Introduction, in the present work we make use of the LEPS-ID1 function already employed in other ion-molecule works in our group.1g120 Also, as it can be inferred from the Introduction, the behavior of this PES with respect to the different dynamical features of the sys- tem seems to be quite good.
We have performed an analysis of the behavior of the PES with the OHH angle by carrying out reaction coordi- nates at fixed OHH angular values and also by monitoring the bending potential with both interatomic distances fixed at the C,, (O-H-H)+ minimum values (Ii,,= 1.191 A, RHH= 1.058 A). Figure 1 shows the evolution of the most relevant stationary points on the LEPS-ID1 surface as the OHH angle is narrowed from 180” to 60”. For collinear C,, geometries, the OHH minimum referred to above, lying 8.8 kcal/mol below products, is observed. As the OHH angle is closed down to narrower values, the depth of this col- linear well diminishes, becoming shallowest for OHH an- gles about 90” and going down again very slightly after- wards.
At about 130”, the (OHH) + minimum breaks in two. In terms of contour plots, the -0.43 eV equipotential curve (with energy referred to reactants), which for C,, arrangements goes far into the valley of reactants, breaks down giving rise to an additional well (well 1). The depth of this accident on the PES is shifted approximately 0.2 eV above that of the one coming from C, v configurations (well 2). Its evolution with the OHH angle, after appear- ing on the PES, runs almost parallel with that of well 2. Both wells on the PES become separated by a barrier which increases in height as the OHH angle is closed down. For OHH configurations near 60“ the barrier for the passage from well 2 to well 1 nears 2.0 eV. For well 1, the RoH bond length varies between 2.2 A (for an OHH angle of 30”) and 1.5 A (at an OHH angle of 140”), whereas the RHH interatomic distance (0.775 and 0.799 A for OHH angles of 30” and 140”, respectively) remains quite near the RHH equilibrium value of 0.741 A. Conversely, we observe a rather late character for well 2, with the RoH bond length moving between 1.2 and 1.0 A for OHH angles from 180” to 60” (the ROH equilibrium bond distance is 1.029 A), while the R uH distance takes corresponding values between 1.040 and 2.718 A. Figure l(b) shows the evolution of the OHH bending potential at the ROH and R,, interatomic distance values of the C,, minimum on the PES. As can be seen, the bending potential rises steeply after 120”, eventu- ally attaining 6.0 eV with respect to reactants for OHH angles of about 80”. It is to be noted, however, that both Figs. 1 (a) and 1 (b) evidence a markedly isotropic behav- ior of the potential between 180” and 115”. It is not until approximately this OHH angle value that the energy of the barrier to reaction overcomes that of reactants. Hence, all OHH configurations from 115” to 180” will be open for reaction at any E, considered. Also, according to Fig. 1 (a), there is a moderate increase in the height of the barrier between both wells (which represents in fact the barrier to reaction) on closing the angle further to 60“. This means
that for &>2.0 eV, which is quite a moderate value
in the energy range considered in the present and former works, in principle, a great deal of OHH angles (from 60” up to 180”) may lead to reaction.
Thus, for all energetic conditions explored, the energy of reactants is placed well above that of the C,, minimum, implying that even if collinear configurations are most fa- vorable for reaction and we should expect a certain orien- tational effect of the PES in this sense, the number of tra- jectories spending a long time in the vicinity of the minimum will be low and most trajectories will proceed in a direct manner. In fact, this is observed when performing a reaction-mode analysis8 Also, even though it gives rise to very few complex trajectories, the well on the PES may exert a certain influence as to the final energy partitioning in products. In fact, as evidenced from the data in Ref. 8,
we observe an almost constant percentage of the accessible
energy going into translation of products which in the ET
=0.25-2.0 eV energy range, deviates from the SSM expec- tations. Since this PES does not exhibit any energy thresh- old and becomes only moderately repulsive, one should expect (as it was observed in Ref. 8)) a decreasing behavior of the excitation function, with a steep initial fall due to several concomitant factors, such as the lower maximum
impact parameter b,,, leading to reaction as
E,increases
and the growing number of trajectories bouncing back without reacting because more repulsive zones of the PES are explored. At higher E, the details of the PES become less relevant in the sense that almost all OHH configura- tions are open for reaction. Also, as observed in Ref. 8 the f/b ratio is expected to decrease with E, because explor- ing more repulsive configurations on the PES implies that the probability of OH+ (OD+> products being scattered back in the center-of-mass framework increases. At the higher E, considered in our studies, (4.5 eV and above), one should also expect insertion of Of into the H2 bond to be energetically allowed and thus that some trajectories proceed this way. We have not been able, however, to ob- serve this behavior in our reaction-mode analysis.*B. Initial conditions and QCT computational procedure
The calculations have been performed according to the quasiclassical trajectory method21,22 as implemented in a three-dimensional (3D) QCT program developed in our laboratory.23 The accuracy of the coupled classical me- chanics differential equations has been checked by verify- ing the conservation of total energy and momentum along each trajectory as well as through back integration of rep- resentative samplings of trajectories.
Our goal in performing the present study was to carry out a comparison of the QCT excitation function as a func- tion of E, with the diatomic molecules at T,,, = Tvib = 300 K, with the existing experimental data. For the three iso- topic mass combinations (H,, D2, and HD), an extensive QCT calculation focused mainly on the most populated rovibrational levels of each diatomic molecule at 300 K (v=O, J=O, 1, 2 for H2 and D,, and u=O, J=l for HD) as well as for the u= 1, J= 1 state of H2 and HD, has been
previously reported. l1 However, for an accurate compari-
2930 Gonzalez et aL: Excitation functions for the, O+ + H,(4A”)
son between the QCT data and those corresponding to ET values. Therefore, we have set out to complete the pre- thermal (300 K) cross sections to take place, it is neces- vious existing QCT calculation, whose results are-also used sary that a significant amount of the Hz, D,, and HD mol- in the present work, to acquire a better description at those ecule populations at this temperature be taken into account low ET conditions for which no calculations at v,J levels when averaging the S, values for the different specific rovi- other than the most populated one at 300 K existed. Thus, brational states of the molecules, and more so for the low for Of+H2, the v=O, J=O, 1, 2, 5, 8 and v=l, 2, J=l
h c1 4 .
log (E T / eV)
A Exp. (GB) [141 0 Exp. (B) [181 - LGS [lo] 0 ACCSA [161 q QCT-l,o
070
190
log (ET / eV)
A Exp. (GB) [141 0 Exp. (B) [181
- LGS [lo] 0 ACCSA 1161 0 QCT
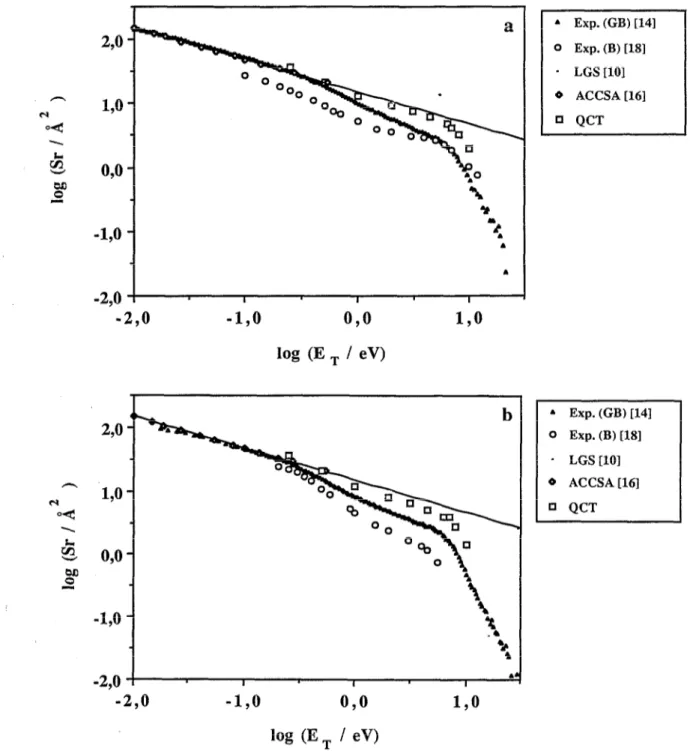
FIG. 2. Cross sections for the reaction of O+ with H, (a), D, (b), and HD (c) and fraction of OH+ produced in the reaction of Of with HD (d) as a function of the relative translational energy of reactants at 300 K. Solid triangles correspond to the guided beam (GB) data of Armentrout and co-workers (Ref. 14), circles denote the beam (B) results of Johnson and Henchman (Ref. 18), while lozenges represent the ACCSA theoretical results of Dateo and Clary (Ref. 16). The solid line included shows the Langevin model (LGS) cross-section behavior (Ref. 10). The QCT data from the present calculation and Ref. 11 are shown as squares. In (d) the crossed molecular beam (CB) f(OH+) results of Mahan and co-workers (Ref. 12) are also shown as solid squares.
Gonzalez et ab: Excitation functions for the O+ +Hn(4A”) 2931 290
170
090
-l,o
-2,0
-2,0
-l,o
090
LO
log (E T / eV)
170
098
+-
g
096
Gz
074
092d
&$,to
::’
00
*
^% a .
-jQi?
% i 0
.
l Exp. (GB) [14] 0 Exp. (B) [18] - LGS [lo] 0 ACCSA [161 q QCT a Exp. (GB) [141 0 Exp. (B) [18] n Exp. (CB) [12] 0 ACCSA [16] q QCT-2,0
-l,o
090
190
log (ET / eV)
FIG. 2. (Continued.)
rovibrational states of H, at E,=0.25 eV have been con- +D,, the E,=0.25, 0.50, and 1.0 eV initial energies for sidered, and also the u=O, J=O, 2, 5, 8 and u= 1, 2, J= 1 the u=O, J=O, 1, 2, 6, u= 1, J= 1, 2, and v=2, J=2 rovi- states of Hz at ET=0.5 and 1.0 eV. An average of 500 brational states of D,, also with an average of 500 trajec- trajectories per condition were integrated which, due to the tories per condition were used in the present calculation. high reactivity of this system, enables errors in S, (one For the third isotopic combination, values of u=O, J=O, 1, standard deviation) to fall below 10%. Similarly, for O+ 2, 5 and u= 1, 2, J= 1 for HD were selected to run an
2932 Gonzalez et al.: Excitation functions for the Of+H,(4A”)
average of 500 trajectories per condition at E,=0.25, 0.5, and 1.0 eV. Besides, in order to explore the high-energy range, where the initial rovibrational level of the diatomic molecule at 300 K is very little relevant, calculations were performed for E,=7.0, 8.0, and 10.0 eV with the Hz, D1, and HD molecules placed in their most populated rovibra- tional levels at 300 K (u=O, J= 1, 2, and 1, respectively).
Ill. RESULTS
The different data available about the S, vs ET depen- dence for Of +H1, D,, and HD are plotted in Figs. 2(a)- 2(c), respectively. The behavior of f( OH+ ) with E, where f( OH+ ) stands for the ratio of S, for reaction (3) and the sum of S, for reactions (3) and (4), is depicted in Fig. 2(d).
For QCT results to be compared with the thermal S,(E,, r,,,=T,,=300 K) given in Refs. 14-16 and 18, it is necessary to average the different S, values for the var- ious initial rotational levels of H,( u=O), D,( u=O), and HD( u=O) over the relative populations of these levels at 300 K, taken usually to follow a Maxwell-Boltzmann dis- tribution. This averaging is especially necessary in the low- ET range, for which changes in the initial rotational state of the diatomic molecule imply significant changes in the magnitude of S,
both curves are superimposed arises mainly from experi- mental uncertainties (ion collection efficiencies ) . The be- havior of Johnson and Henchman’s data” in the case of the O++D, [Fig. 2(b)] and O++HD systems [Fig. 2(c)] do not match so well when shifted the more recent deter- minations of Burley, Ervin, and Armentrout.14 For Of +D,, the behavior of the S, vs ET plot corresponding to Johnson and Henchman’s data approaches the limiting LGS model at low E, while falling significantly below Burley, Ervin, and Armentrout’s determinations at higher relative energies. Thus, a simple shift of Johnson and Henchman’s results to superimpose them to the ones by Burley, Ervin, and Armentrout, shows that they have a more concave behavior at low energies with S, rising above the LGS limit. A similar behavior is observed for the Of +HD system. In this case, the shape of the S, vs ET curve from Johnson and Henchman’s data shows a bow followed by a shoulder in sharp disagreement with the more recent measurements of Burley, Ervin, and Armen- trout. However, as pointed out in Ref. 18 there may be several sources of error for the different data. Armentrout and co-workers’4 explain the deviation from the LGS limit as well as the preferred formation of OH+ in the reaction of O+ + HD in terms of angular momentum constraints in the exit channel, even though still S, falls apparently more rapidly than it should. Various explanations based upon competition from the spin-forbidden process
The experimental data depicted in Figs. 2( a)-2( c) clearly show three well-defined zones. In the first zone, corresponding to energies between 0.01 eV and roughly 0.3 eV, both three excitation function plots fit excellently well to the LGS model, even though for Fig. 2(a) it seems that the experimental values are very slightly above the LGS predictions, a fact that Burley, Ervin, and Armentrout14 attribute to experimental error. In fact, these authors esti- mate the accuracy in the absolute magnitude of their S, to be of about f 20%. At the same time, the ACCSA data of Dateo and C!lary,t6 obtained using an intramolecular po- tential based upon the LGS model but corrected to incor- porate anisotropy effects, superimpose on the LGS and experimental estimates in this low-energy range. The only existing overlapping QCT point in this zone of the excita- tion function, that corresponding to 0.25 eV, falls in all three cases a bit above the LGS limit.
a=O.O6 eV (5)
have been put forward. 14,16 In a recent experimental work, Flesch and Ng17 have pointed out that the charge-transfer
(CT) reaction,
@=1.80 eV (6)
In the second zone of the S, vs ET curves, which com- prises an energy range from 0.3 to roughly the thermody- namic onset for dissociation of the product molecules, the experimental data deviate considerably from the LGS pre- dictions, following a steeper decreasing behavior. In this zone also [see Figs. 2(a)-2(c)], the other existing experi- mental data of Johnson and HenchmanI exhibit a similar trend. For these latter results, the behavior of S, with ET does not follow the LGS model in the low-energy range. In the case of the O+ +H, reaction, the curves of Johnson and Henchman and of Burley, Ervin, and Armentrout do almost overlap if the former is just shifted up a bit, begin- ning only to deviate from each other after roughly 3.2 eV. In view of the lower accuracy of the results in Ref. 18, it might well be that the observed diverging behavior when
does in fact play a much more important role than reaction ( 5 ) , hinting also that to achieve an accurate description of the experimental S, it is necessary to take into account reaction (6).
On the other hand, the present QCT calculation results do in this intermediate energy range (0.3 to roughly 7 eV) fall a bit below the LGS estimate, even though they do not follow such a sharper decrease as is found experimentally. The slight deviation of the QCT results from the theoreti- cal LGS model probably arises from the fact that one of its basic premises, that is, that all trajectories surmounting the effective potential will lead to reaction, no longer holds since more repulsive zones of the PES are explored and the probability of trajectories bouncing back into reactants in- creases accordingly. Also, the experimental charge-transfer [reaction (6)] cross sections of Flesch and Ng17 do not pay a significant contribution to S, until ET up to about 6 eV, where the most important process apart from reactions
(l)-(4) is the dissociation of the product molecule. Sum- ming the CT cross sections with the experimental ones for the reactive process by Burley, Ervin, and Armentrout does not bring the resulting summed curves significantly closer to the QCT plotted one. Therefore, it seems that the experimental downhill shape of the excitation functions in the intermediate energy range cannot be attributed at least solely to the opening of the CT channel.
At energies between 5.6 and 6.25 eV, the experimental excitation function curves of Burley, Ervin, and Armen- trout14 and Johnson and Henchman” show a new change in steepness, going down much steeper than in the inter- mediate energy region [see Figs. 2( a)-2( c)] at approxi- mately the same E, values. This behavior has been attrib- uted to the increasing number of OH+ and OD+ molecules appearing with enough internal energy to be dissociated, even though the experimentally derived onsets for dissoci- ation of the product molecules appear between 1.14 and 2.34 eV higher in energy (depending on the isotopic vari- ant considered) than the thermodynamically expected val- ues. The high percentage of energy going into translation of products, in qualitative agreement with the SSM model, has been invoked to account for this fact. As evidenced by these plots, the QCT data begin to bend down at approx- imately the same energy as do the experimental results. The fact that we do not observe dissociated trajectories below 6.3 eV, the moderate product dissociated trajectories found below 6.3 eV, and the moderate product transla- tional excitation observed throughout the calculations seem to support this hypothesis. It must be pointed out that some of the results of Flesch and Ngt7 would indicate, however, that product dissociation begins to occur indeed at the thermodynamic dissociation onset values, in appar- ent disagreement with the data mentioned above. On ex- amining the data in Fig. 2 it is worth remarking that the QCT results do always fall above the experimental ones. As commented above, it should also be noted that the results of Ref. 18, except in the case of the Of +H2 system, de- viate considerably from the more accurate ones of Burley, Ervin, and Armentrout. l4
Henchman,t8
As pointed out by Johnson and there is about a 25% scatter in the high- energy structure of the excitation function, which might account for the observed differences between the experi- mental works in this region.
Overall, it seems interesting to indicate also that in the intermediate zone, the experimental cross-section magni- tude for O++D2 falls a little below that of the Of+H2, with the O+ +HD one coming between both. The QCT data, giving S, about 16% lower for deuterium than for hydrogen in this region, fully support the experimental re- sults. However, in the lowest energy range explored in the present QCT study, from 0.25 to 0.5 eV, we find a value of 1.0 for the ratio of cross sections for H2 and D,, in full agreement with the theoretical results of Dateo and Clary,t6 but deviating a little from the experimental value of 1.2. Thus, a weak intermolecular isotopic effect is re- ported in the experiments14,‘8 in the low E, zone which is absent from all the theoretical calculations.
Figure 2(d) shows a plot of the f(OH+ ) produced in
the reaction of O+ with HD. The experimental results point once again to the existence of three well-defined zones. In the first zone, up to approximately 0.4 eV, f( OH+) grows with E,. This behavior is also observed for the ACCSA results in this zone. In the second one there is a fall in f( OH+), while in the third f(OH+) rises up again. In this latter region, the crossed-beam results of Mahan and co-workers12 at high ET have also been con- sidered. The behavior in the low-energy zone has been ex- plained’4T16 by considering that the incoming O+ atom ex- erts a torque on HD as it approaches forcing the HD molecule into an orientation with H directed towards the incoming O+ atom, thus causing it to react preferentially over D. As ET rises, orbital angular momentum conserva- tion criteria14 as well as effects based upon the anisotropy of the potential16 have been invoked to account for the increment in S,.. The decline in f(OH+) after 0.4 eV has been accounted for by taking into account the skewed- scaled” PES, for which reactions to give OD+ are more favorable,“9’4 given the more open nature of the skewed PES leading to ODf formation. In the high-energy range, f( OH+) goes up again probably due to the higher internal energy contents of the OD+ molecules formed which fa- vors dissociation in this channel with respect to the one giving OH+. This higher internal energy contents of the OD+ product molecules is also observed in the present QCT calculations.
As evidenced by the plot in Fig. 2(d), all three exper- imental data sets behave similarly. The results of Johnson and Henchman18 seem to indicate a sharper decrease in f(OH+ ) than those of Burley, Ervin and Armentrout,14 even though once errors are taken into consideration, both data sets are probably in good agreement. The crossed- beam data of Gillen, Mahan, and Winni2 at E+6.3 eV deviate a bit and run almost parallel to those reported in Ref. 14, but once again~ they may become relatively near once errors are taken into consideration. The QCT results also shown in Fig. 2(d) follow a simpler behavior. The QCT f(OH’) curve goes down more smoothly than the experimental data. In the declining zone of the f(OH+) plot, the QCT data behave very much like the experimental ones, even though they do not afterwards show a sharp increase at high E,. Instead, f( OH+) remains almost con- stant between 8.0 and 10.0 eV. It must, however, be taken into consideration that the LEPS-ID1 surface proposed is, in principle, only adequate for low and moderate energies and may give rise to faulty results at energies well above the dissociation energy of reactants and products. Besides, at these high energies, describing reactions ( l)-(4) using only the ground 4A’r PES is no longer an appropriate ap- proximation, since reaction may take place nonadiabati- tally, involving excited PESs of the system. In fact, as evidenced by the data in Ref. 17, the CT process at these energies dominates over reaction on the ground PES.
In Ref. 15, Sr values at T= 105 K are reported, com- paring well with the data of Dateo and Clary.16 According to these results, the S, values do not differ substantially at 105 and 305 K, while for the reaction of O+ with HD, it seems that lower T favors a slightly higher f(OH+).
2934 Gonzalez et al.: Excitation functions for the O+ +H2(4A”)
IV. DISCUSSION
The results presented in the preceding section clearly evidence that, while reproducing the overall dynamical properties of the system on the whole with quite a reason- able accuracy, the PES used in the trajectory calculations lacks the ability to mimic the excitation function in the intermediate energy zone. As stated above, several expla- nations have been put forward to account for the decline of S, in this zone. One of them is competition of the spin- forbidden process (5) to the main reactive one. However, the experimental findings of Flesch and Ng17 seem to rule out this possibility, given the extremely low cross sections for H+ appearance reported in their work, at least com- pared to other contributions such as that of the CT process (6). On the other hand, the energy. threshold for reaction (5), 0.06 eV, would seem to suggest that the effects of this alternative reaction channel should become evident at con- siderably lower energies than the ones at which a signitl- cant deviation from the LGS model begins to take place.
The charge-transfer process (6) might be another pos- sible explanation for the observed discrepancies between theory and experiment. However, as was already pointed out in Sec. III, the contribution of the CT channel to re- activity is rather low even at considerably high relative energies. Hence, the effect of the CT process, if any, would perhaps have to be understood as a deflecting one, that is, that it contributed mainly to scattering back towards reac- tants a significant part of the O+ +H, (D,, HD) reactive events taking place on it. Unfortunately, to our knowledge no ab initio or model calculations whatsoever have been performed on this surface so that this hypothesis cannot be confirmed.
Another possible explanation, in our opinion the most plausible one, would be that the present LEPS-IDI~PES behaves in too attractive a manner, at least at energies for which the CT channel is closed. In fact, as pointed out in the preceding section, the structure of the potential is such that at energies above 2.0 eV OHH angles from 180” to 60” are open for reaction. The rather isotropic behavior of the potential would thus cause an overestimation of the reac- tivity over the whole energy range. In fact, as pointed out before, the QCT results at low energies do, in fact fall a little above those determined experimentally and also a bit above the LGS model ones.
A comparison between the present theoretical and the experimental data evidences a rather good quantitative agreement between theory and experiment, partly because the experimental errors (about f 20%) cause the QCT results to fall close to the experimental values once the error intervals for these latter have also been taken into account. However, the shape of the experimental excitation functions in the intermediate energy region is not quite reproduced in the QCT calculation.
V. CONCLUDING REMARKS
In the present work, we have presented an extensive QCT calculation on a previously described LEPS-ID1 an-
alytical PES for the lowest energy 4A” surface of the O+ -l-H, system and its isotopic variants to compare it with the latest experimental determinations available. The LEPS + IDI surface used exhibits a rather isotropic behav- ior on going away from the preferred collinear C,, config- uration. The structure of the excitation function at 300 K found in the experimental determinations is fairly well de- scribed even though still not quite completely reproduced in the QCT calculations, which overestimate cross sections for all three isotopic combinations in the 0.5<Erg4.5 eV energy range, even though the QCT cross-section values agree rather well with those obtained experimentally when both uncertainties are included. On the other hand, the intramolecular isotopic effect in the case of the 0’ +HD reaction is quite well reproduced. In view of the low prob- ability that other competing reactive processes may be re- sponsible for the observed decay in S, in this energy range, it is concluded that the PES used is probably too attractive, but that nevertheless it may serve as a reasonably good starting point to obtain a better representation of the 4A” PES for this system.
ACKNOWLEDGMENTS
We thank Professor Peter Armentrout for furnishing the detailed results of his experiments. We are also grateful to Professor Michael Henchman for providing us with a copy of the previously unreleased results in Rebecca Johnson’s Undergraduate Honor Thesis. Thanks are due to the ‘Centre d’Inform&tica de la Universitat de Barcelona” for computer time and facilities made available for this study. This work has been partially supported by the “Di- reccion General de Investigation Cientifica y Tecnica” of the Spanish Ministry of Science and Education (DGICYT, Project No. PB88-0189).
_‘K. M. Ervin and P. B. Armentrout, J. Chem. Phys. 84, 6738 (1986), and references therein.
‘K. M. Ervin and P. B. Armentrout, J. Chem. Phys. 86, 2659 (1987), and references therein.
3K. T. Gillen, B. H. Mahan, and J. S. Wmn, J. Chem. Phys. 58, 5373 (1973).
‘G. Chambaud, Ph. Millie, and B. Levy, J. Phys. B 11, L211 (1978). ‘D. M. Hirst, J. Phys. B 17, L505 (1984).
6M. Gonzalez, A. Aguilar, and M. Gilibert, Chem. Phys. 131, 335 (1989).
‘F. Illas, P. S. Bagus, J. Rubio, and M. Gonzalez, J. Chem. Phys. 94, 3774 (1991).
‘M. Gonzalez, A. Aguilar, and J. Virgili, Chem. Phys. Lett. 113, 179 (1985).
‘H. H. Harris and J. J. Leventhal, J. Chem. Phys. 58, 2333 (1973). ‘OR D Levine and R. B. Bernstein, Molecular Reaction Dynamics (Ox- . .
ford University Press, Oxford, 1974).
“M Gonzalez, A. Aguilar, and M. Gilibert, Chem. Phys. 131, 347 (1989).
“K T. Gillen, B. H. Mahan, and J. S. Winn, J. Chem. Phys. 59, 6380 (1973).
“D H. Smith, N. G. Adams, and T. M. Miller, J. Chem. Phys. 69, 308 (I.978).
I45 D Burley, K. M. Ervin, and P. B. Armentrout, Int. J. Mass. . . Spec-
trosc. Ion. Proc. 80, 153 (1987). J. Chem. Phys., Vol. 98, No. 4, 15 February 1993
Gonzalez et al.: Excitation functions for the O*+H,(4A”) 2935
“L. S. Sunderlin and P. B. Armentrout, Chem. Phys. Lett. 167, 188 (1990).
16C. E. Dateo and D. C. Clary, J. Chem. Sot. Faraday Trans. 2 85, 1685 (1989).
“G. D. Flesch and C. Y. Ng, J. Chem. Phys. 94, 2372 (1991). t*R. Johnson, Undergraduate Honors Thesis, advisor M. J. Henchman,
Brandeis University, 1972.
lgM. Gonzalez and A. Aguilar, Chem. Phys. 132, 443 (1989). “M. Gonzalez, A. Aguilar, and R. Say&, Chem. Phys. 132, 137 (1989). 2’R. N. Porter and L. M. Raff, in Dynamics of Molecular Collisions,
edited by W. H. Miller (Plenum, New York, 1976), Pt. B, p. 1. 22D. G. Truhlar and J. T. Muckerman, in Atom-Molecule Collision The-
ory edited by R. B. Bernstein (Plenum, New York, 1979), p. 505. 23M. Gilibert, M. Gonzalez, and R. Say& (unpublished).