Universit`a Politecnica delle Marche
Scuola di Dottorato di Ricerca in Scienze dell’Ingegneria
Corso di Dottorato in Ingegneria Civile, Ambientale, Edile e Architettura
Wave induced hydro and
morpho-dynamics around a single
slender pile: experimental and
numerical analysis
Ph.D. Dissertation of: Francesco Marini Supervisor:
Prof. Alessandro Mancinelli Assistant Supervisors:
Dr. Sara Corvaro Prof. Javier L. Lara
Ph.D. Course coordinator: Prof. Francesco Fatone
Abstract
During the last years, the presence of piled structures, such as offshore wind farms or oil platforms, in the marine environment is becoming more important. For this reason, it gains relevance the correct analysis of possible criticisms and uncertainties in the design process. The aim of this thesis is the study of both the hydrodynamics and the morphodynamics induced by regular and random waves over a single slender pile by means of laboratory and numerical modelling. Therefore, the objective of the present thesis is to contribute to a better understanding of such physical processes. In particular, it aims to provide some tools that can be useful in the design process, in order to avoid a wrong estimation of the most important parameters and, thus, to ensure a proper design of the piled marine structure and its facilities. Particular attention is paid on the evaluation of the total force due to wave action, on the scour at the base of the pile and on the run-up over its surface. A rigid bed model has been realised to evaluate the best approach for the estimation of the total force over the pile due to nonlinear waves. An alternative method to the classical Morison et al. (1950)’s approach has been proposed for the computation of the total force from the velocity and acceleration of the water particles from a measured water surface elevation time series. Such method consists in a Fourier spectral decomposition of the input free water surface signal; the contribution of each component, computed according to the Airy theory, is summed to obtain the total horizontal and vertical velocity along the vertical profile. The results showed that this approach allowed to give a very good estimate of the total force both in terms of maximum value and of the phase in which it occurs. On the contrary, the application of the linear theory for the calculation of the velocity to be applied in the force calculation (classical Morison approach used in the design process) leads to an underestimation of the peak value and to a wrong representation of the shape of the force. Another primary parameter in the stability of a structure in the marine environment is the scour at the base of the monopile. An additional experimental campaign is performed by means of a mobile bed model in which a vertical cylinder is placed over a sandy seabed and it is attacked by both regular and random nonlinear waves. The results for regular waves are quite in agreement with the earlier work of Sumer et al. (1992). However, the results of this study reveal that the scour process due to nonlinear regular waves starts for hydrodynamic conditions characterized by a lower intensity (Keulegan-Carpenter parameter KC = 4) in comparison with those reported in the literature for linear waves (KC = 6). Different formulas are proposed for its estimation depending on dimensionless parameter KC, and, in order to take into account of the nonlinearity of the wave, also the Ursell parameter (U r). For random waves, the approach proposed by Ong et al. (2013) for scour evaluation has been modified. This method depends on the cumulative distribution function of the dimensionless crest heights but, because of its complexity, it has been simplified in order to became suitable for design
pur-poses without affecting the quality of the results. To better understand the process of formation, growth and detachment of vortices, measurements made by using the Particle Tracking Velocimetry (PTV ) technique are carried out and the results are integrated with those from pressure sensors and from the mobile bed model for the characterization of the whole process of vortex formation and scour generation. The results showed that the wave phases and positions in which the maximum values of the pressure gradients occur, correspond to those in which the detachment of vortices is observed. From the interpretation of the contour maps of the vorticity and of the Okubo-Weiss (OW ) parameter it is possible to explain the scour patterns obtained in the mobile bed campaign. Furthermore, a numerical model has been realised with the tool OpenFOAM⃝R that permitted to contribute to the comprehension of the complex
3D physical phenomenon induced by the wave-structure interaction. A new wave gen-eration boundary condition for the gengen-eration of a measured water surface elevation time series has been added to the numerical code. The corresponding velocity field in this boundary condition has been computed with the Fourier decomposition method mentioned above. The nonlinear waves of the rigid bed experimental campaign are here simulated for the better comprehension of the vortex formation process and for the estimation of wave run-up which is very important for the design of the access facility of the marine structures. Excellent results are obtained in comparison with experimental data of force, pressure, velocity and water elevation. The analysis of the maximum values of run-up is performed and the results are compared with some formula available in the literature. An adaptation of the equation of Hallermeier (1976), that compute the run-up depending on the crest height, is proposed and the results, obtained with a significant number of samples, are very good. Finally, the visualization of the three-dimensional vortical structures by means of the Q-criterion has been performed. The numerical results showed that, in some instances, a vortex generated during the first half of the wave period can remain in the area of influence of the pile. After the reversal of the flow, it changes the direction according to the stream until it is finally removed on the opposite side of the pile with respect to where it was generated. The results are in agreement with those of the PTV experimental campaign: both the phase, size and position of vortices are well represented. The achievements obtained with the numerical model are able to improve the understand-ing of the complex physical processes by linkunderstand-ing the different results, such as the pressure gradients, vortical structures and the associated scour patterns.
Contents
List of Symbols 4
1 Introduction 15
2 Review and Theory 19
2.1 Flow around a single slender pile . . . 19
2.2 Scour process under waves . . . 22
2.3 Wave force over a single pile . . . 24
3 Experimental set-up and Analysis 29 3.1 Laboratory facilities . . . 30
3.2 Rigid bed model . . . 32
3.2.1 Particle Tracking Velocimetry set-up . . . 36
3.3 Mobile bed model . . . 38
4 Experimental Results 45 4.1 Rigid bed model . . . 45
4.1.1 Velocity . . . 46
4.1.2 Force over the pile . . . 49
4.1.3 Pressure distribution around the pile . . . 58
4.2 Mobile bed model . . . 62
4.2.1 Scour under regular waves . . . 62
4.2.2 Scour under random waves . . . 69
4.3 Particle Tracking Velocimetry (PTV) . . . 76
4.4 Scale effects . . . 88
4.5 Discussion on the experimental results . . . 89
5 Numerical set-up, Analysis and Results 91 5.1 Model overview and new wave generation boundary condition . . . 92
5.2 Model validation . . . 96
5.3 Comparison with experimental data . . . 103
5.4 Numerical results . . . 109
5.4.1 Run-up . . . 109
5.4.2 Vortex generation . . . 115
5.5 Discussion on the numerical results . . . 123
List of Symbols
an amplitude of the wave component ni after the fft
A wave motion horizontal amplitude
Arms rms value of the wave motion horizontal amplitude
bc distance between the load cell and the hinge in the
rigid bed model
bc position of line of application of the wave force
C wave velocity
Cg wave group velocity
CD drag coefficient
CM inertia coefficient
d50 mean grain diameter
d maximum scour distance from the axis of the pile d∗ dimensionless grain size
D pile diameter
fn frequency of the wave component ni after the fft
Fc force measured in correspondence of the load cell
FD drag force
FI inertia force
Fw force applied in position bw
F total force
g gravitational accelaration
h water depth
H water heigth
Hs significant wave heigth
H(wc− wc1/n) Heaviside-function
k wave number
kn wave number of the wave component ni after the
fft
kp wave number corresponding to the peak frequency
k1 wave number corresponding to the spectral mean
wave period
ks roughness parameter
KC Keulegan-Carpenter number
KCrms rms Keulegan-Carpenter number
KCη modified Keulegan-Carpenter number for random
waves
L wave length
n the portion of the highest random wave crests, among those exceeding the limiting value wc1, that
contribute to the scour process
ni index of the wave component derived from the fft
process
Ntot the total numbers of samples of a water elevation
time series
nw group factor number
p∗ pseudo-dynamic pressure
P total pressure
Pd dynamic pressure
P (wc) probability density function of the dimensionless
crest height
Pη probability of exceedence of the dimentionless crest
heigth
P (wc) Weibull cumulative distribution function of the
di-mentionless crest heigth
P E percent error
Re Reynolds number
ReD pile Reynolds number
Ru run-up over the pile
s specific gravity of sediment grains S scour depth along the pile
Sn computed scour depth for random waves obtained
with a specific value of n
Smax maximum scour depth around the pile
Su(f ) power spectrum of the horizontal velocity
t time
tmax maximum duration of a test
T wave period
T1 spectral mean wave period
Tp wave peak period
TS scour equilibrium time scale
T∗ dimentionless equilibrium time scale
Sη(f ) wave spectrum of the instantaneous free surface
el-evation
S1 wave steepness for random waves
U horizontal particle velocity along the x direction Uc critical horizontal velocity for initiation of motion
U velocity vector
Uf undisturbed bed shear velocity
Um undisturbed orbital velocity at the bottom
Urms rms value of the undisturbed orbital velocity at the
bottom
U r Ursell number
U r1 Ursell number for random waves
V horizontal particle velocity along the y direction W vertical particle velocity
wc1 lower dimensionless crest elevation limiting value of
the truncated Weibull distribution
wc1/n limiting value that, among the waves higher than
wc1, identifies the waves that give a contribution to
the scour process
X position vector
Xn complex amplitude for each wave component ni
x horizontal coordinate: zero in correspondence of the centre of the pile
x′ curvilinear coordinate: distance along the cylinder surface from the stagnation point
y horizontal transversal coordinate: zero in corre-spondence of the centre of the pile
Y (wc) dimensionless scour depth associated to wc
z vertical coordinate: zero at s.w.l. and positive up-wards
α, β 2D Weibull parameters αi VOF fraction of the i-th phase
α1 VOF indicator function ∂u
∂t horizontal particle acceleration
δ
¯n average value of the relative scour error
ϵ spectral width parameter
ε wave nonlinearity
η(t) water surface elevation
η0(t) experimental water elevation time series at the
lo-cation of the wave generation ηc wave crest elevation
ηc,d design wave crest elevation
θ Shields parameter
θcr critical Shields parameter
κ curvature of the interface µef f efficient dynamic viscosity
ν kinematic viscosity of the fluid
ρ water density
ρs sand density
σ surface tension coefficient σD sediment uniformity diameter
ση integer of the wave spectrum of the instantaneous
free surface elevation τ¯0 bed shear stress
τ¯m0 maximum undisturbed bed shear stress for waves
φ angular coordinate: angle measured from the x axis and centred in the middle of the pile
ϕ phase angle
ϕn phase angle of the wave component ni after the fft
ω angular frequency
List of Figures
2.1 Definition sketch of the main hydrodynamic processes induced by the presence of a vertical cylinder under waves. Adapted from Sumer and Fredsøe (2002). . . 20 2.2 Near-bed wake vortices. Sumer et al. (1997). . . 21 2.3 Equilibrium scour depth. Sumer et al. (1992) . . . 23 2.4 Results of Sarpkaya (1976). Evaluation of CM (upper panel) and CD
(lower panel) with respect to KC for various values of Re or β = Re/KC. 26 2.5 Results of Chakrabarti (1980). Evaluation of CM (upper panel) and
CD (lower panel) with respect to KC for values of Re in the range
2-3·104. . . 27 3.1 Global sketch of the wave flume for the mobile bed model realized in the
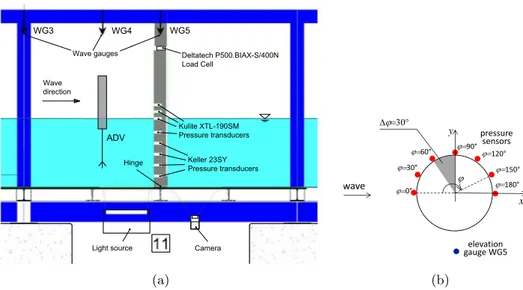
Hydraulics and Maritime Construction Laboratory of the Universit`a Politecnica delle Marche (Ancona, Italy) . . . 30 3.2 Wave gauges positioning for the rigid bed experimental campaign . . . 32 3.3 Longitudinal cross-section of the physical rigid bed model and
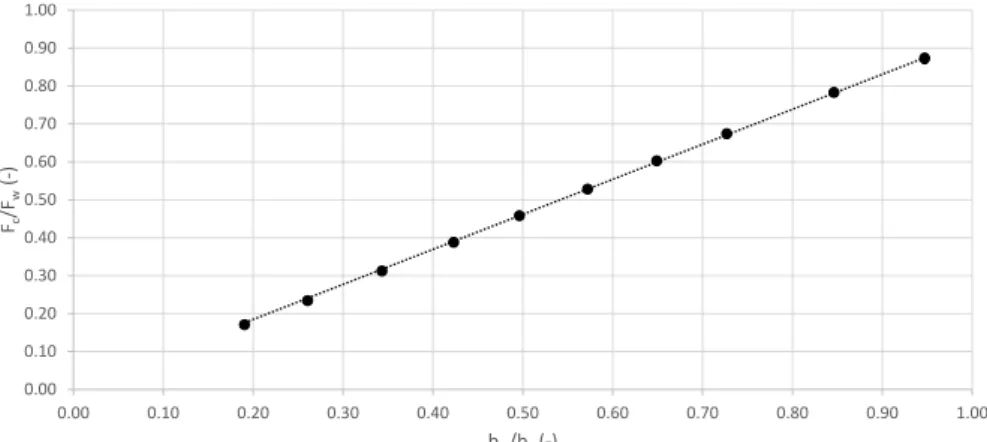
mea-surement instruments (a) and sketch of the rotations in which pressure measurements are performed (b) . . . 33 3.4 Regime classes of drag and inertia forces (Chakrabarti, 1987) . . . 34 3.5 Load cell calibration: linear relation between the dimensionless ratios
Fc/Fw and bw/bc . . . 35
3.6 Comparison between the force computed from the load cell measure-ments (Fw) and that from the integration of the pressure on the surface
of the cylinder. . . 36 3.7 Sketch of the PTV tests configurations: camera on the bottom of the
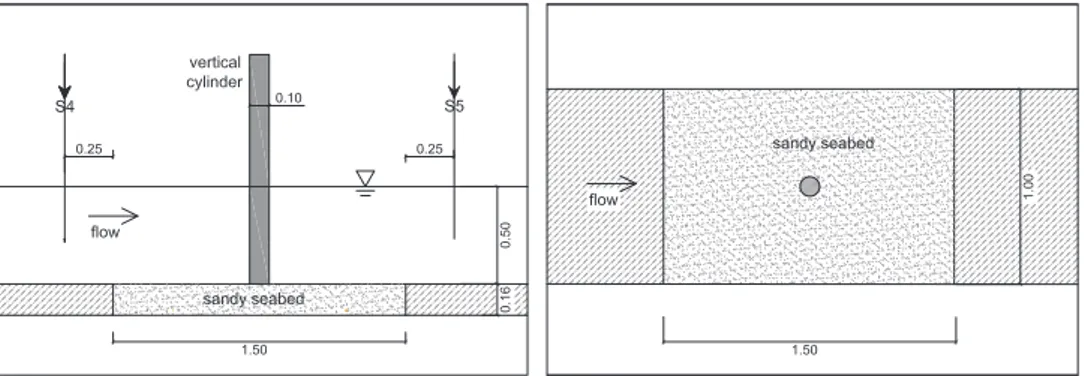
flume for horizontal plane recordings (panel a), camera on the lateral side of the flume for vertical plane recordings (panel b) . . . 37 3.8 Longitudinal cross-section (left panel) and plan view (right panel) of
the physical mobile bed model. . . 38 3.9 Sketch of the reference systems used in this work. . . 39 3.10 Phase-averaged water surface elevation at wave gauge S4. Waves R0,
R6, R15 and R12. . . 40 3.11 Left panel: comparison of the experimental exceeding probability of
the dimensionless crest heights with both Rayleigh and Klopman dis-tributions (the crest heights ηcare normalized by the rms crest height).
Right panel: comparison of the crest height normalized with the crest height predicted at given exceeding probability levels by both Rayleigh and Klopman distributions. Non-linear random wave test NR6. . . 42
3.12 Time evolution of the measured and predicted scour depth S(t)/D for wave R15: predicted data (black), measured data (red). Dashed lines represent the tangent to the curve at the origin (from t/TS = 0 to
t = TS) and the horizontal asymptotic limit for t → ∞. . . 43
4.1 Comparison between velocity spectrum directly measured from ADV and computed by water elevation spectral components for wave test R23 at zb=15cm. . . 47
4.2 Horizontal water particle velocity under the trough and the crest of the wave for test R7 (a) with T =1.83s, R23 (b) with T =2.00s, R10 (c) with T =2.19s, R25 (d) with T =2.35s, R15 (e) with T =2.74s; exper-imental values and computed according to linear theory and spectral decomposition. . . 48 4.3 Values of the percent error (PE ) of the phase in which the maximum
velocity occurs for all the wave conditions of Table 3.1. . . 49 4.4 Phase averaged water level surface (upper panel) and force (lower
panel): measured values and computed with linear theory or Fourier decomposition approach for wave test R2. Constant coefficients CD=
0.9; CM = 2.0 . . . 51
4.5 Phase averaged water level surface (upper panel) and force (lower panel): measured values and computed with linear theory or Fourier decomposition approach for wave test R3. Constant coefficients CD=
0.9; CM = 2.0 . . . 51
4.6 Phase averaged water level surface (upper panel) and force (lower panel): measured values and computed with linear theory or Fourier decomposition approach for wave test R5. Constant coefficients CD=
0.9; CM = 2.0 . . . 51
4.7 Phase averaged water level surface (upper panel) and force (lower panel): measured values and computed with linear theory or Fourier decomposition approach for wave test R6. Constant coefficients CD=
0.9; CM = 2.0 . . . 52
4.8 Phase averaged water level surface (upper panel) and force (lower panel): measured values and computed with linear theory or Fourier decomposition approach for wave test R7. Constant coefficients CD=
0.9; CM = 2.0 . . . 52
4.9 Phase averaged water level surface (upper panel) and force (lower panel): measured values and computed with linear theory or Fourier decomposition approach for wave test R8. Constant coefficients CD=
0.9; CM = 2.0 . . . 52
4.10 Phase averaged water level surface (upper panel) and force (lower panel): measured values and computed with linear theory or Fourier decomposition approach for wave test R9. Constant coefficients CD=
0.9; CM = 2.0 . . . 53
4.11 Phase averaged water level surface (upper panel) and force (lower panel): measured values and computed with linear theory or Fourier decomposition approach for wave test R10. Constant coefficients CD=
4.12 Phase averaged water level surface (upper panel) and force (lower panel): measured values and computed with linear theory or Fourier decomposition approach for wave test R15. Constant coefficients CD=
0.9; CM = 2.0 . . . 53
4.13 Phase averaged water level surface (upper panel) and force (lower panel): measured values and computed with linear theory or Fourier decomposition approach for wave test R17. Constant coefficients CD=
0.9; CM = 2.0 . . . 54
4.14 Phase averaged water level surface (upper panel) and force (lower panel): measured values and computed with linear theory or Fourier decomposition approach for wave test R21. Constant coefficients CD=
0.9; CM = 2.0 . . . 54
4.15 Phase averaged water level surface (upper panel) and force (lower panel): measured values and computed with linear theory or Fourier decomposition approach for wave test R22. Constant coefficients CD=
0.9; CM = 2.0 . . . 54
4.16 Phase averaged water level surface (upper panel) and force (lower panel): measured values and computed with linear theory or Fourier decomposition approach for wave test R23. Constant coefficients CD=
0.9; CM = 2.0 . . . 55
4.17 Phase averaged water level surface (upper panel) and force (lower panel): measured values and computed with linear theory or Fourier decomposition approach for wave test R24. Constant coefficients CD=
0.9; CM = 2.0 . . . 55
4.18 Phase averaged water level surface (upper panel) and force (lower panel): measured values and computed with linear theory or Fourier decomposition approach for wave test R25. Constant coefficients CD=
0.9; CM = 2.0 . . . 55
4.19 Phase averaged water level surface (upper panel) and force (lower panel): measured values and computed with linear theory or Fourier decomposition approach for wave test R26. Constant coefficients CD=
0.9; CM = 2.0 . . . 56
4.20 Phase averaged water level surface (upper panel) and force (lower panel): measured values and computed with linear theory or Fourier decomposition approach for wave test R27. Constant coefficients CD=
0.9; CM = 2.0 . . . 56
4.21 Phase averaged force: measured values and computed with Fourier decomposition approach for wave test R27. Fitted coefficients CD =
1.2; CM = 1.2 . . . 57
4.22 Values of the percent error (PE ) of the maximum force for all the wave conditions of Table 3.1. Comparison between linear theory and spectral decomposition method. . . 57 4.23 Values of the percent error (PE ) of the phase in which the maximum
force occurs for all the wave conditions of Table 3.1. Comparison be-tween linear theory and spectral decomposition method. . . 58 4.24 Vertical distributions of the total pressure P (left panel) and of the
dynamic pressure Pd (right panel) for wave R2 at the crest (blue lines
for ωt = 49◦) and at the trough (red lines at ωt = 300◦) phases. Results are plotted in two different positions: in front of the pile at φ = 0◦ (solid lines) and behind it at φ = 180◦(dashed lines). . . 59
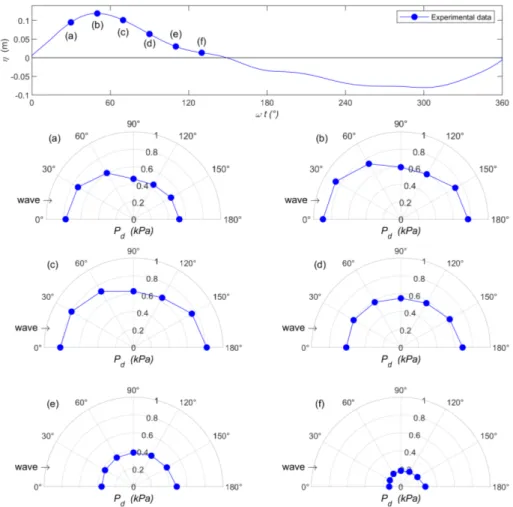
4.25 Phase averaged water elevation of wave R2 and plan view (xy-plane at zb=0.08m) of the dynamic pressure Pd, for different wave phases:
ωt = 30◦ (a); ωt = 50◦ (b); ωt = 70◦ (c); ωt = 90◦ (d); ωt = 110◦ (e); ωt = 130◦ (f). . . 60 4.26 Phase averaged water elevation of wave R2 and pressure gradients
(∂P/∂x′) along the surface of the cylinder at zb=0.08m for different
wave phases: ωt = 30◦ (a); ωt = 50◦ (b); ωt = 70◦ (c); ωt = 90◦ (d);
ωt = 110◦ (e); ωt = 130◦(f). . . . . 61
4.27 Typical ripple classes: wave R0 (I-3), wake scour; wave R16 (II-2), wake scour with rolling grain ripples; wave R14 (III-2), truncated-cone scour with vortex ripples. . . 63 4.28 Scour regime classes proposed by Umeda (2011) and comparison with
the present experimental data for regular waves. . . 64 4.29 Seabed morphology under regular waves. . . 66 4.30 Comparison between the experimental data of the mobile bed campaign
and those of Sumer et al. (1992). The continuous line is the Sumer et al. (1992)’s equation (see Eq. 4.2 with m=0.03, r2=0.77), the dotted line is the Carreiras et al. (2000)’s equation (see Eq. 4.2 with m=0.06, r2≈ 0), while the dashed line is the proposed best-fit equation (r2=0.81). 67
4.31 Influence of the Ursell number on the dimensionless scour depth. . . . 69 4.32 Seabed morphology under random waves. . . 70 4.33 Comparison of experimental random wave scour with Sumer et al. (1992). 71 4.34 Comparison between the experimental data and the fitted Weibull
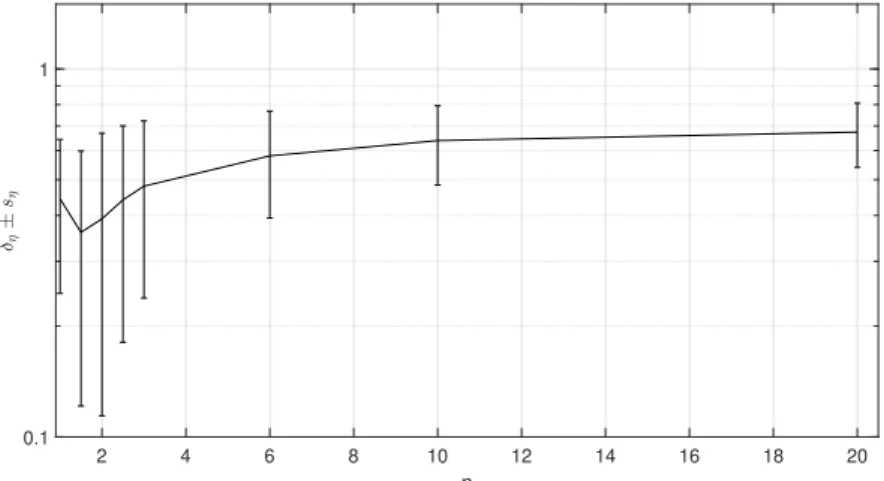
cu-mulative distribution function for the test NR1. . . 73 4.35 Relative error between the evaluated and the measured scour depth
depending on n. . . 74 4.36 Relative error between the evaluated and the measured scour depending
on every crest height ηc,d associated to n. . . 75
4.37 Example of a frame acquired for wave test R2: horizontal plane at zb=4.6cm on the wake side of the pile. . . 76
4.38 Characterization of the phase-averaged undisturbed flow with PTV technique: measured water level at wave gauge W G5 (upper panels) and velocity along the x (blue line) and y (red line) axis (lower panels) for waves R2 (a) and R8 (b). Horizontal plane at zb = 4.6cm. . . 77
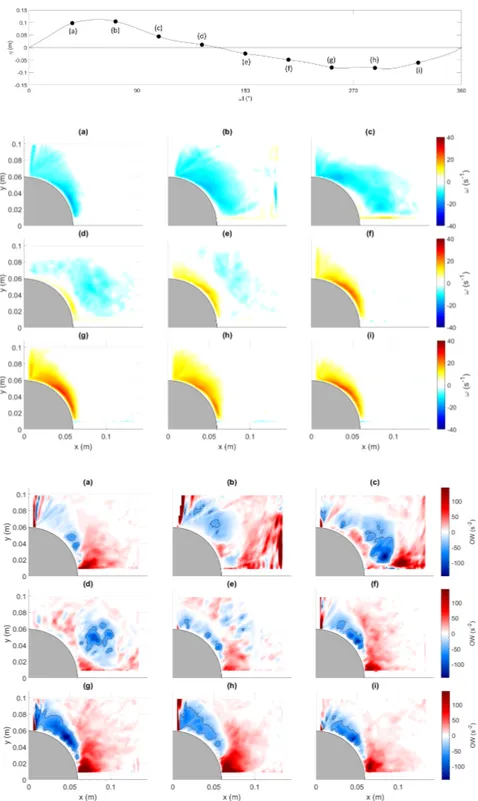
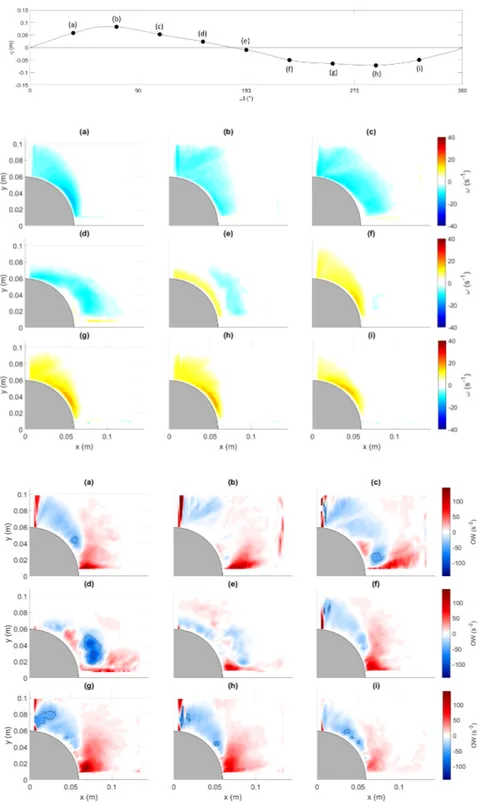
4.39 Vortex identification for wave R2. Upper panel: Phase-averaged wave and identification of main phases. 2D Vorticity maps (s−1) (middle panels) and Okubo-Weiss contour (lower panels) for ωt=36◦, 72◦, 108◦,
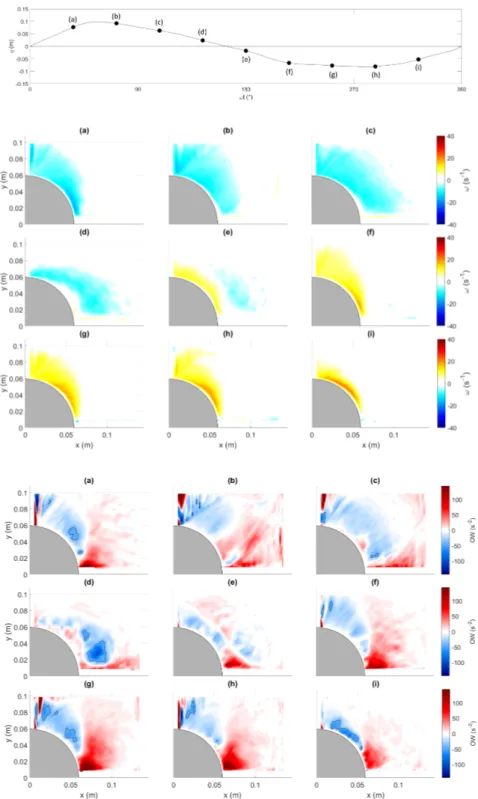
144◦, 180◦, 216◦, 252◦, 288◦ e 324◦ (a-i). . . 79 4.40 Vortex identification for wave R8. Upper panel: Phase-averaged wave
and identification of main phases. 2D Vorticity maps (s−1) (middle panels) and Okubo-Weiss contour (lower panels) for ωt=36◦, 72◦, 108◦, 144◦, 180◦, 216◦, 252◦, 288◦ e 324◦ (a-i). . . 80 4.41 Vortex identification for wave R9. Upper panel: Phase-averaged wave
and identification of main phases. 2D Vorticity maps (s−1) (middle panels) and Okubo-Weiss contour (lower panels) for ωt=36◦, 72◦, 108◦, 144◦, 180◦, 216◦, 252◦, 288◦ e 324◦ (a-i). . . 81 4.42 Vortex identification for wave R15. Upper panel: Phase-averaged wave
and identification of main phases. 2D Vorticity maps (s−1) (middle panels) and Okubo-Weiss contour (lower panels) for ωt=36◦, 72◦, 108◦, 144◦, 180◦, 216◦, 252◦, 288◦ e 324◦ (a-i). . . 82
4.43 Seabed morphologies corresponding to the wave conditions analysed with PTV technique. . . 84 4.44 Vortex identification for wave R15. Upper panel: Phase averaged wave
and identification of main phases. Lower panels: Okubo-Weiss contour for ωt=36◦, 72◦, 108◦, 144◦, 180◦, 216◦, 252◦, 288◦e 324◦ (a-i) for the vertical plane before the pile. . . 86 4.45 Vortex identification for wave R15. Upper panel: Phase averaged wave
and identification of main phases. Lower panels: Okubo-Weiss contour for ωt=36◦, 72◦, 108◦, 144◦, 180◦, 216◦, 252◦, 288◦e 324◦ (a-i) for the vertical plane after the pile. . . 87 5.1 Sketch of the numerical model domain characteristics and wave gauges
sensors positions . . . 93 5.2 Detail of the mesh around the pile for refinement levels 1,2 (a) and 3 (b) 94 5.3 Time series of wave force over the pile using three different levels of
mesh refinement . . . 95 5.4 Water level time series: comparison between experimental and
numer-ical data for test “R15” . . . 97 5.5 Horizontal velocity time series: comparison between experimental and
numerical data for test “R15” at different depths from the bottom . . 98 5.6 Pressure time series: comparison between experimental and numerical
data for test “R15” at different depths from the bottom along the vertical line placed in correspondence of the stagnation point (φ = 0◦
in Figure 3.3b) . . . 99 5.7 Experimental and numerical vertical distributions of the total pressure
P (central panels) and of the dynamic pressure Pd (lower panels) for
wave R15 at the crest (left panels) and at the trough (right panels) phases. Results are plotted in two different positions: in front of the pile at φ = 0◦ (first and third columns) and behind it at φ = 180◦ (second and fourth columns). . . 100 5.8 Total force time series: comparison between experimental and
numer-ical data for test “R15” . . . 101 5.9 Phase averaged water level surface at W G5 in correspondence of the
pile (upper panel) and force (lower panel): experimental data (blue), numerical data (red) and by Fourier decomposition approach (green) for wave test R15. . . 102 5.10 Comparison between experimental and numerical data for test “R2”:
water elevation (upper panel; r2=0.96) and total force (lower panel;
r2=0.87) time series . . . 104
5.11 Comparison between experimental and numerical data for test “R5”: water elevation (upper panel; r2=0.67) and total force (lower panel;
r2=0.56) time series . . . 104
5.12 Comparison between experimental and numerical data for test “R6”: water elevation (upper panel; r2=0.91) and total force (lower panel;
r2=0.77) time series . . . 105
5.13 Comparison between experimental and numerical data for test “R7”: water elevation (upper panel; r2=0.86) and total force (lower panel; r2=0.70) time series . . . 105
5.14 Comparison between experimental and numerical data for test “R8”: water elevation (upper panel; r2=0.94) and total force (lower panel; r2=0.96) time series . . . 105 5.15 Comparison between experimental and numerical data for test “R9”:
water elevation (upper panel; r2=0.89) and total force (lower panel; r2=0.92) time series . . . 106 5.16 Comparison between experimental and numerical data for test “R10”:
water elevation (upper panel; r2=0.77) and total force (lower panel;
r2=0.63) time series . . . 106
5.17 Comparison between experimental and numerical data for test “R17”: water elevation (upper panel; r2=0.97) and total force (lower panel;
r2=0.92) time series . . . 106
5.18 Comparison between experimental and numerical data for test “R21”: water elevation (upper panel; r2=0.91) and total force (lower panel;
r2=0.78) time series . . . 107
5.19 Comparison between experimental and numerical data for test “R22”: water elevation (upper panel; r2=0.85) and total force (lower panel; r2=0.47) time series . . . 107 5.20 Comparison between experimental and numerical data for test “R23”:
water elevation (upper panel; r2=0.67) and total force (lower panel; r2=0.30) time series . . . 107 5.21 Comparison between experimental and numerical data for test “R24”:
water elevation (upper panel; r2=0.96) and total force (lower panel;
r2=0.81) time series . . . 108
5.22 Comparison between experimental and numerical data for test “R25”: water elevation (upper panel; r2=0.95) and total force (lower panel;
r2=0.79) time series . . . 108
5.23 Comparison between experimental and numerical data for test “R27”: water elevation (upper panel; r2=0.90) and total force (lower panel;
r2=0.64) time series . . . 108
5.24 Phase averaged run-up along the surface of pile for wave R7 (a) and R8 (b) obtained with the numerical model. . . 109 5.25 Free surface elevation contour around the cylinder, wave R8 (T =2.19s,
H=0.16m) at t = 10.75s (up-crossing - panels a), t = 11.00s (rising phase - panels b), t = 11.20s (crest phase - panels c). Colormap η/ηmax.111
5.26 Free surface elevation contour around the cylinder, wave R8 (T =2.19s, H=0.16m) at t = 11.40s (descending phase - panels d), t = 11.60s (descending phase - panels e), t = 11.80s (down-crossing - panels f). Colormap η/ηmax. . . 112
5.27 Comparison between run-up obtained from the numerical model and theories: Hallermeier (1976) - circles (r2=0.36); Niedzwecki and Duggal
(1992) - triangles (r2=0.85); Niedzwecki and Huston (1992) - squares
(r2=0.84). . . 113
5.28 Comparison between run-up obtained from the numerical model and theories with fitted velocity coefficient m: Hallermeier (1976) - cir-cles (m=4.47 and r2=0.94); Niedzwecki and Duggal (1992) -
trian-gles (m=6.81 and r2=0.85); Niedzwecki and Huston (1992) - squares (m=5.98 and r2=0.85). . . 114
5.29 Vortex pattern identification of wave R2 around the cylinder at differ-ent times: (a) at the reversal of the flow close to the up-crossing, (b) at the crest phase, (c) at the reversal of the flow close to the down-crossing, (d) at the trough phase. In each panel it is plotted the free surface and the iso-contour of the Q-criterion (Q = 80) coloured by velocity mag-nitude (left), the vorticity contour (top-right) and the Q − criterion contour (bottom-right) at the plane zb=1cm. . . 116
5.30 Vortex pattern identification of wave R2 around the cylinder at differ-ent times after the symmetry breaks up: Q − criterion contour at the plane zb=1cm. . . 118
5.31 Vortex pattern identification for wave R2. Numerical data (central panels): contour of the Q-criterion at zb=1cm. Experimental data
(lower panels): contour of the OW at zb=4.6cm. Results obtained for
the crest phase (panels a) and at the reversal of the flow (panels b) . . 120 5.32 Phase averaged water elevation of wave R2 and plan view (xy-plane
at zb=0.08m) of the dynamic pressure Pd, for different wave phases:
ωt = 30◦ (a); ωt = 50◦ (b); ωt = 70◦ (c); ωt = 90◦ (d); ωt = 110◦ (e); ωt = 130◦ (f). Experimental (blue lines with circles) and numerical data (red lines with triangles). . . 122
List of Tables
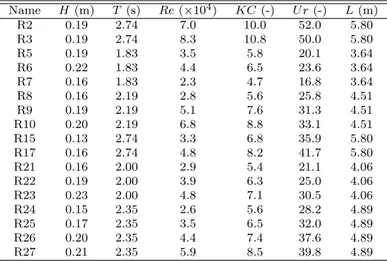
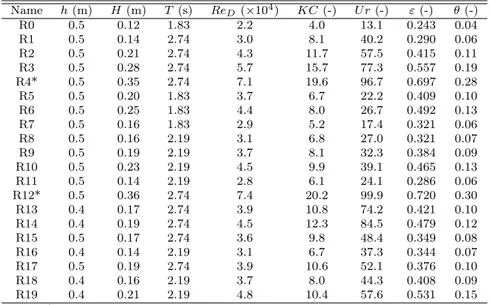
3.1 Characteristics of regular waves at wave gauge S4 for rigid bed model. 34 3.2 Characteristics of regular waves at wave gauge S4. . . 39 3.3 Characteristics of random waves at wave gauge S4. . . 41 4.1 Scour depth for regular waves. S/D is the scour at the edges of the
pile; Smax/D is the maximum scour around the cylinder. . . 64
4.2 Scour depth for random waves. S/D is the scour at the edges of the pile; Smax/D is the maximum scour around the cylinder. . . 71
4.3 Measured and predicted scour for random waves. . . 75 4.4 Characteristics of regular waves at wave gauge in correspondence of
the pile for both rigid bed model (left) and mobile bed model (right). 83 5.1 Characteristics of regular waves at wave gauge S4. . . 94
Chapter 1
Introduction
During the last years, the development of renewable energies led to the growth of wind farms and offshore platforms over the main seas. Only in 2018, Europe connected 409 new offshore wind turbines reaching a total installed offshore wind capacity of 18499MW (WindEurope, 2019). In 2019 it will be operational the first wind farm in the Mediterranean sea, it will consist in 10 turbines with a total capacity of 30MW and it will be placed in Taranto (Italy). In Italy, the importance of offshore wind energy is increasing such that in the latest proposed national plan on energy and climate (Energia Clima 2030, 2019) the power growth objective for 2025 is set to 300MW and for 2030 to 900MW. In the italian seas, the available water depths for the installation of wind farms are mainly in shallow/intermediate waters (h/L < 0.5) and thus, in the present thesis, such water depth condition is considered.
The knowledge of the hydro and morpho-dynamics induced by such structures is very important for their design. In particular, the aim of this thesis is to improve the knowledge of the main physical processes due to the wave-structure interaction that can highly impact on their correct design. Among the aspects analysed in this thesis, particular attention is paid on the force and run-up on the pile. Moreover, the generation and growth of coherent structures around the cylinder and the induced net scour are studied. The present topics have been experimentally and numerically studied in the literature (e.g., Sumer et al., 1997; Olsen and Kjellesvig, 1998; Roulund et al., 2005; Baykal et al., 2017). In open oceans, waves and currents can coexist, and, depending on the specific site, the effects of currents may dominate over those of waves and vice versa. In a number of instances (e.g., middle Adriatic Sea, South African coast, south-eastern Australian coast), the tidal range is significantly smaller than the wave height at breaking and hence a micro-tidal regime is observed in which waves mostly influence the morphological processes (Masselink and Short, 1993). In the middle Adriatic sea, for example, the tidal current is also smaller than the current due to the gradient of salinity given by the fresh water intake of the river Po and, therefore, both effects can be considered negligible with respect to waves. For this reasons, in this thesis the influence of the current is not considered and the focus is on the analysis of the hydrodynamics around a vertical slender cylinder subjected to wave forcing only. A vertical pile may represent a part or the whole marine structure (e.g. piers, offshore oil platform and foundation for offshore wind turbine) as in the case of monopile foundations, the most used fixed foundation in offshore wind. The better comprehension of such physical processes helps the design and permits to guarantee the integrity and the stability of the structure over time.
A key point for the design of such structure is the evaluation of the total force acting on a slender pile under wave action. Several formulations are present in the literature based on the approach of Morison et al. (1950). However, some assumptions are made to perform the analytic solution of the problem: the linear wave theory has been used for the evaluation of the velocity profile according to the potential flow theory; the involved hydrodynamic coefficients are taken constant in time and along the vertical direction; the water displacement above or below the mean water level little contributes to the total (η was small compared to the water depth h) and, thus, the integration is performed up to the mean still water level. All these restrictions are, usually, not suitable for real wave conditions in shallow/intermediate waters and could lead to high underestimations of the total loads over the structure. Several studies have been performed for the evaluation of the hydrodynamic coefficients to use in the total force formula. Sarpkaya (1976) obtained results for a wide range of Re and KC with U-tube tests while Chakrabarti (1980) performed a series of wave tank tests within a limited range of the Reynolds number. Moreover, several authors (Isaacson, 1979; Journ´ee and Massie, 2001) stated that the choice of the computational method highly influences the estimation of those parameters and it could lead to a high scatter of the results. In this thesis, a series of tests on a rigid bed model has been done for the evaluation of the total force on the cylinder induced by nonlinear waves that are more representative for real field conditions. The velocity profile has been both measured and computed by means of a Fourier decomposition approach which gives very good results with respect to the typically used application of the linear theory.
In addition, the correct design of the foundations of these structures depends on the proper evaluation of all the parameters that play a primary role for the stability. In particular, the uncertainties on the magnitude of the maximum scour depth es-timation could lead to an unsafe design. The maximum scour and its pattern need to be adequately kept in consideration while dimensioning the structure because its influence is relevant for the whole structure stability. While the scour process under steady currents has been intensively studied from the 70’s (Breusers et al., 1977; Ettema, 1980; Melville, 1984), the first works in the wave induced scour over piles have been made by Sumer et al. (1992). Mobile bed tests permitted to find the first experimental relation between the dimensionless scour depth and the Keulegan-Carpenter parameter under regular or random waves. Carreiras et al. (2000) found results in disagreement with this equation in the case of nonlinear waves and, hence, they proposed an adaptation of the formula in this condition. More recently, Ong et al. (2013) proposed a method for the estimation of the scour depth due to random waves based on the cumulative distribution of the crest heights. For the present thesis, a mobile bed campaign has been realised in order to study the scour induced by nonlinear regular and random waves. The beginning of the scour process has been investigated and the tests are performed until an equilibrium value is reached. For regular waves, the effectiveness of the above mentioned relations is analysed and an extension of data-set for nonlinear waves has been provided and, for random waves, a new simplified method for the computation of scour depth is proposed.
In the last years, several researches have been carried out on the topic of the wave interaction with monopiles using Computational Fluid Dynamics (CFD ) based Navier-Stokes equations. In most of these applications (e.g., Lara et al., 2013; Sun et al., 2016; Cao and Wan, 2017; Lin et al., 2017; Mohseni et al., 2018), the open source tool OpenFOAM⃝R has been used, proving its robustness and validity, among
toolbox, so one of its main advantages is that it is free and the user can directly modify the source code and control each step of the solving procedure. In particular, here a new boundary condition for the correct laboratory wave generation is intro-duced in the solver and the results are compared with those from the laboratory. The Reynolds Averaged Navier-Stokes (RANS ) model with this new boundary condition correctly generates nonlinear waves. It was possible to study the wave run-up that is another important parameter that could interfere with the access of those structures. Indeed, a wrong evaluation of this parameter could lead to safety problems if the access facilities are placed in a too low level. On the contrary, if they are placed in a too much high elevation, the access to the platform would not be comfortable in calm sea level conditions. From the physical point of view, the kinetic energy of the water is converted into potential energy because of the interaction with the cylinder (Hallermeier, 1976). The analysis of several numerical wave conditions permitted to study the reliability of the formulations available in the literature analysing and reviewing possible criticisms.
Moreover, the application of this model also permits to obtain useful information on vortex generation and growth that have been related with the scour patterns from the previous mobile bed experiments.
Objective and outline of the thesis
The aim of the present thesis is to contribute to a better understanding of the hydro-dynamics and morphohydro-dynamics induced by nonlinear waves (regular ad random) in intermediate water conditions. The objective of the improvement of the knowledge of such physical processes is fundamental for a proper design of marine structures. Estimates of the force and run-up on the pile, as well as the analysis of the coherent structures around it and the scour, are all activities undertaken to reach the goals. The combined use of experimental and numerical analysis of nonlinear waves inter-action with a vertical slender cylinder adds information to that already available in the literature because of the broad analysis on the dynamics and on morphological processes both by inspecting/linking a variety of results and by providing original insight into various specific mechanisms. In particular, specific attention is focused on the determination of a valid methodology for the estimation of the total force for hydrodynamic conditions in which the assumption of Morison et al. (1950)’s are not valid, often found in real cases. An accurate evaluation of the total force under non-linear waves is not available in the literature, thus both experimental and numerical approaches were adopted aiming at collecting useful data and information on this phenomenon. The laboratory experiments have been designed mainly focusing on the reconstruction of the phase-averaged force under several wave conditions in order to find the best methods for its evaluation. The broad overview of the results may be a starting point for the evaluation of such fundamental parameter in a different way from what usually done in the design process in which nonlinear waves, typical of real sea states, are assumed to be linear waves following the assumptions of Morison et al. (1950).
Another important objective of this thesis is the evaluation of the scour depth at the base of the cylinder due to regular and random waves and to extend the dataset available in the literature. The nonlinear behaviour of waves influences the mechanics of scouring which is one of the most important causes of failure of structures in the
marine environment. Under these conditions, the available formulas and methods for the estimation of the maximum scour depth are reviewed with the extended dataset and new approaches are proposed and analysed. A mobile bed model campaign has been needed for the characterization and evaluation of morphological patterns that such waves induce on the sandy seabed.
The formation and growth of the scour is due to the intensity of the vortices that are able to catch the sediments, put them in suspension and to release them in different positions with respect to their original ones, thus leading to different seabed patterns. The present research has been undertaken in an effort to improve the understanding of the generation of vortices in relation with the equilibrium morphology of the same wave conditions. In this light, a series of Particle Tracking Velocimetry (PTV ) tests are carried out, in rigid bed conditions, over both vertical and horizontal planes close to the bottom. Such analysis shed light on the influence of a vertical cylinder on the hydrodynamics and morphodynamics induced by waves. The available experimental data allow for a complete evaluation of a numerical model generated with a CFD tool (such as OpenFOAM⃝R). Numerical modelling is usually considered a valid support
to the design process and allows for information that is not easily obtainable in an experimental way without introducing a disturbance due to the presence of some sen-sors (e.g. free surface and velocity gauges). In particular, the evaluation of the force, the run-up and the coherent structures around the cylinder have been performed and such results contribute to the better understanding of the physical processes and, hence, can be an help during the design process.
The present thesis is structured as follows:
• Chapter 2 gives a brief description of the state of the art of the main topics re-garding the present work. The hydrodynamical processes of the wave-structure interaction are described in terms of vortex generation and total force over the pile and, in addition, the scour process is also described;
• Chapter 3 describes the laboratory facilities and the employed instrumentations. Moreover, the detailed description of the two experimental configurations is reported: first the rigid bed model for force and pressure measurements and for the analysis of the velocity and vorticity field by means of PTV technique is reported, finally, the mobile bed model for the experimental evaluation of the scour is described;
• Chapter 4 shows first the main results about the hydrodynamics (velocity, force and pressure distribution) and, after that, about the morphology of the seabed concerning the scour depth under regular and random waves. Finally, the results of the PTV tests are shown and a correlation between the vortex formation, development and evolution and the seabed patterns obtained experimentally is provided;
• Chapter 5 describes the numerical model generated with OpenFOAM⃝R, the
new implemented boundary condition and the comparison of the numerical re-sults with those obtained from the laboratory campaigns. Different analysis are carried out to confirm the vortex generation process and wave run-up;
• Chapter 6 summarizes the main findings of the present work within a critical discussion on the available and proposed design methods.
Chapter 2
Review and Theory
In this chapter an overview on the main theories and the state of the art about the topics of this thesis is reported. In Section 2.1 the flow around a vertical cylinder and the formation and evolutions of vortices is described. Section 2.2 describes the process of formation of the scour and the main formulae for its evaluation. Finally, in Section 2.3 the main studies and formulations for the evaluation of the force on slender cylinders due to waves are reported.
2.1
Flow around a single slender pile
In the marine environment, under wave action, two kind of flow regimes are possible. If the size of the pile is so small that the flow, and thus the vortices, is separated the regime is called “slender-pile”. On the other hand, if the size of the body (namely the ratio between the pile diameter D and the length of the wave L) is so large that the flow is unseparated the regime is termed “large-pile” regime. Several authors (Isaacson, 1979; Sumer et al., 1997) highlighted how the diffraction effect becomes important when the ratio D/L increases over O(0.1). Considering average values of diameters of offshore structures in comparison with the associated wave length, the thesis focuses on the slender pile regime.
As displayed in Figure 2.1, the three main effects due to the presence of a vertical cylinder in the hydrodynamics of the marine environment are the formation of a horseshoe vortex in front of the pile, secondly a vertical axis vortex is generated on the lee-side of the pile and, finally, the contraction of the streamlines occurs at the side edges of the pile.
Figure 2.1: Definition sketch of the main hydrodynamic processes induced by the presence of a vertical cylinder under waves. Adapted from Sumer and Fredsøe (2002). The bottom boundary layer due to undisturbed waves, under the influence of the adverse pressure gradient produced by the descending flow in front of the pile, does not separate up to the point in which the Keulegan-Carpenter parameter (KC) reaches the limiting value of KC = 6 and the horseshoe vortex is originated. The separated boundary layer rolls up to form a spiral vortex around the structure, which then trails off downstream. The experience of Sumer et al. (1992) confirmed how the KC is directly related to the vortex formation and, thus with the scour intensity. It is defined as:
KC = UmT
D . (2.1)
Hence, for a given pile diameter (D), KC depends on the maximum value of the undisturbed orbital velocity at the bed Umand on the wave period T . Considering a
linear wave, the maximum horizontal velocity can be calculated as Um= Aω = 2πAT
where A is the amplitude of the wave motion. Hence the value of KC can be calculated as:
KC = 2πA
D . (2.2)
The physical meaning of the KC number can probably be better explained with this equation in which the numerator represents the total amplitude of the motion (2A) with respect to the size of the pile D on the denominator. As this parameter increases, the water particles cover a larger distance with respect to the diameter and, thus, the probability of separation and vortex shedding increases, especially on the wake side. The lee-wake vortices are caused by the rotation in the boundary layer over the surface of the pile. The vortex flow-regimes behind a free cylinder, subjected to an oscillatory flow, have been studied by several authors. Williamson (1985) and Sumer et al. (1997) observed that the vortex flow-regimes for a free cylinder subject to an oscillatory flow and the lee-wake vortex flow are governed primarily by KC, with some influence also of the pile geometry, the pile Reynolds number and the surface roughness. The bed shear stress under the horseshoe vortex and the bed shear stress in the lee-wake are also influenced by KC. In particular, different flow regimes can be identified as shown in Figure 2.2 taken from Sumer et al. (1997):
1. when 2.8 ≤ KC < 4 a pair of symmetric vortices separate behind the pile (Figure 2.2a)
2. when 4 ≤ KC < 6 the symmetry breaks up but the vortices are still attached, no shedding occurs (Figure 2.2b)
3. when KC ≥ 6 the vortex shedding occurs (Figure 2.2c)) and the shed frequency increases with KC (Figure 2.2d)
Figure 2.2: Near-bed wake vortices. Sumer et al. (1997).
In the case of steady currents (river flows, tidal currents), several studies have been done for the measurement of pressure and velocities beneath the horseshoe vortex flow
(Baker, 1979; Dargahi, 1989; Roulund et al., 2005). Baker (1979) demonstrated that the bed shear stress can be amplified by a factor of 7-11 with respect to its undisturbed value due to the very strong presence of the horseshoe vortex. For waves, instead, Sumer et al. (1997) evaluated that the amplification of the bed shear stress, defined as τ¯0/τ¯m0, in which τ¯0 is the bed shear stress and τ¯m0is the maximum undisturbed
bed shear stress for waves has a maximum of about O(4) at (or near) the side edges of the pile for a pile subjected to waves, becoming larger than 10 in the case of steady currents (Roulund et al., 2005), when KC → ∞. More recently, Baykal et al. (2017) performed numerical simulations to confirm the results of Roulund et al. (2005) for steady current and of Sumer et al. (1997) under wave conditions.
2.2
Scour process under waves
Scour around a circular cylinder is mainly forced by the horseshoe vortex combined with a downflow in front of the pile, vortex shedding behind of the pile and contraction of streamlines at the side edges (Sumer and Fredsøe, 2002). Many works have been devoted to scour around the piles. A detailed account of the topic has been given by Whitehouse (1998), Melville and Coleman (2000) and Sumer and Fredsøe (2002). Experimental investigation and dimensional analysis are the most commonly used approaches. The interaction between the flow field and the sediment motion around the pile is generally discussed in terms of dimensionless parameters. The spatial profile of the undisturbed seabed around the cylinder is largely modified by the passage of the waves. After a transient period, a periodically-steady equilibrium state is reached. When waves become the dominant forcing, the intensity of the lee-wake vortex flow, active during each half period of the oscillating motion, prevails on the horseshoe vortex and, as a consequence, the scour is produced mostly laterally or behind the pile. During a complete wave period, different flow regimes take place at the seabed around the toe of the cylinder (Sumer et al., 1992). As a consequence, different sand detachment occurs as a function of the local flow shear stress and bed slope, and modifies the slope itself, both in terms of steepness and height. Sand particles move as either bedload, i.e. rolling and translating close to the seabed, or as suspended solid, i.e. displaced away from the seabed and transported by the freestream flow. Both conditions are able to induce a net solid transport from and to different bed regions. It follows that the flow regime is strongly influenced by the seabed mobility and efforts to reproduce all the dynamics evolving at an erodible bed through use of a rigid mould may not be adequate (Manes and Brocchini, 2015).
The equilibrium scour depth S (usually normalized with the diameter of the pile) mainly depends on the characteristics of the flow, the sediment and on the roughness (ks) of the pile. As proposed by Sumer et al. (1992) its dimensionless equation can
be stated as:
S
D = f (θ, ReD, ks/D, KC) where θ = U2
f/(g(s − 1)d50) is the Shields parameter, Uf is the undisturbed bed shear
velocity, s the specific gravity of sediment grains, d50the grain size; ReD= UmD/ν is
the pile Reynolds number and ν is the kinematic viscosity of the fluid (ν = 10−6m2/s for the water).
As KC increases, the length of the lee-wake vortices increases and, in addiction, the life span and size of horseshoe vortices increase. The results of Sumer et al. (1992) are shown in Figure 2.3. This figure shows that the scour tends to a constant value as KC → ∞ because of the finite lifetime of the vortices. Since this value is the
Figure 2.3: Equilibrium scour depth. Sumer et al. (1992)
same that can be obtained for steady currents (S/D = 1.3) it can be concluded that the contribution to the scour for large KC numbers is mainly due to the horseshoe vortices. On the other hand, if KC < O(10) the net scour is directly related to the lee-vortex shedding because the life span of the horseshoe lee-vortex is rather small. Sumer et al. (1992) gives the following expression for the evaluation of the dimensionless equilibrium scour depth depending only on the KC value.
S
D = 1.3{1 − exp[−0.03(KC − 6)]}; KC ≥ 6 (2.3) Note that in the present formulation the limiting value KC ≥ 6 is determined as a consequence of the experience of the experiments carried out by Sumer et al. (1997) that found that the limit of existence of horseshoe vortex, and thus its associated net scour, is for KC = 6.
An other formula have been obtained for estimation of maximum scour depth under the action of current and waves taking into account also the effect of the sediment characteristics on scouring by means of the critical velocity for the initiation of motion (Uc) of the sediment particles (Zanke et al., 2011). However, the influence of the ratio
Uc/U is of primary importance for high values of KC, namely in wave-current
condi-tions and, therefore, it is not analysed throughout this thesis. Matutano et al. (2013) analysed these methods in the context of the design of medium and large diameter monopile foundations. They reported a need for revised design formulae in terms of environmental parameters in order to determine the extent of scour protection. In the last decade, researchers have tried to improve the accuracy of scour depth esti-mation. More recent experimental works have been made on the scour around piers under waves and currents, most of them focused on the scour in sand-clay mixtures (Dey et al., 2011; Myrhaug and Ong, 2013), or for different cross sections (Farooq and Ghumman, 2019), or its reduction with innovative techniques (Dey et al., 2006; Corvaro et al., 2018a). In addition, Artificial Neural Networks have been used in hydraulic engineering problems because of their flexibility, ability to generalize and
power to approximate nonlinear and complex phenomena. As an example, Ayoubloo et al. (2010) developed a model to predict the scour depth more accurately than the conventional approach. Also CFD numerical models (Baykal et al., 2017) has proven successful in predicting the scour and backfilling process under waves obtaining results in full agreement with observations.
2.3
Wave force over a single pile
The correct design process of an offshore structure depends mainly on the right com-putation of the water wave forces. The complexity of the wave-structure interaction, the nonlinearity of the waves and the random nature of ocean waves lead to a dif-ficulty in describing and quantifying adequately this process. An extensive review on the wave forces over structures can be found in Chakrabarti (1987) and the same information is reported also in the more recent recommended practice (Det Norske Veritas, 2010). Depending on the relative size of the structure towards the wavelength, the forces are mainly calculated in three different ways:
• Morison equation • Froude-Krylov theory • Diffraction theory
The Morison equation (Morison et al., 1950) can be used for piles that have diameters small in comparison with the wave length (namely L > 5D) and computes the total force as a sum of a drag and an inertial component and it uses coefficients that have to be determined experimentally. If the structure is still relatively small and the drag force is still dominant over the inertia the Froude-Krylov theory can be applied. According to this method the force is computed with the incident wave pressure and with the pressure-area method on the surface of the structure. If the size of the structure increases up to a point that it is comparable to the wave length (D/L > 0.2) the presence of the structure changes the whole wave field in its surroundings, so, in this case, the wave diffraction must be taken into account. As an example, the pile diameter of an offshore wind turbine can reach values up to 4-6m and, according with the data of Fraunhofer IEE, in 2018 more than 90% of the European offshore wind farms are placed at a water depth greater than 5. Hence, even in shallow water conditions and for short wave periods, the associated wave length takes values higher than 40m and, thus, the ratio D/L is typically smaller than the limit for the application (0.2) of the Morison equation.
The drag component in the Morison equation is given by the presence of a wake region, where the pressure is lower with respect to that one on the “upstream” side of the pile. This difference in terms of pressure leads to the generation of a force in the direction of movement of the water particles and it depends on the square of their velocity according to Equation 2.4.
FD=
∫︂ η
−h
1
2ρCDDU |U |dz (2.4)
in which h is the mean water depth, η is the water surface elevation from the mean level, ρ is the water density, U is the local velocity of the particles, CD is the drag
coefficient and z is the vertical coordinate which is zero at the mean water level and positive upwards.
Furthermore, the water particle that passes around the cylinder accelerates and de-celerates carrying momentum with it. The resulting force over the pile is the inertial force and it is defined as:
FI = ∫︂ η −h π 4D 2ρC M ∂U ∂tdz (2.5)
in which CM is the inertia coefficient.
Therefore, the total force over the cylinder due to wave action can be calculated as the linear superposition of these two contributions and the Morison equation is obtained by: F = FI+ FD= ∫︂ η −h π 4D 2ρC M ∂U ∂tdz + ∫︂ η −h 1 2ρCDDU |U |dz (2.6) The integration of this formula can be done by means of different hypothesis. In particular, considering that the wave height is small in comparison with the water depth, it can be integrated between −h and 0 and the water particle velocity and acceleration can be computed according to the linear Airy wave theory as:
U =πH T cosh[k(h + z)] sinh(kh) cos(kx − ωt), ∂U ∂t = − H 2 gk cosh[k(h + z)] cosh(kh) sin(kx − ωt). (2.7)
where g is the gravitational acceleration, k = 2π/L is the wave number, ω = 2π/T is the angular frequency, L is the wavelength and x is the horizontal coordinate positive in the wave direction. Substituting Equations 2.7 in Equations 2.5 and 2.4 and integrating, the expressions for the wave force components are obtained:
FD= CDρg
DH2
32 tanh(kh)
2kh + sinh(2kh)
sinh2(kh) | cos(kx − ωt)| cos(kx − ωt), (2.8)
FI = CMρg
πD2
4 H
2 tanh(kh) sin(kx − ωt). (2.9) As already stated, the total force is calculated as the sum of the two contributions. Extensive works have been carried out to compute the hydrodynamic coefficients to use in Equation 2.6. Among the most important, it must be highlighted the work of Sarpkaya (1976) that correlated CDand CM to the dimensionless parameters Re and
Figure 2.4: Results of Sarpkaya (1976). Evaluation of CM (upper panel) and CD
(lower panel) with respect to KC for various values of Re or β = Re/KC.
Tests were conducted in the horizontal portion of a U-tube forced by a harmonic oscillation. More than 300 tests were conducted with different piles, analysing hydro-dynamic conditions characterized by KC up to 150 and Re up to 2.5 · 104. The results
of this work can be summarized in two figures in which the hydrodynamic coefficients depend on both the dimensionless parameters (Figure 2.4).
The wave tank tests of Chakrabarti (1980) on a vertical cylinder produced similar results in terms of CD and CM. In that work, a huge number of tests were performed
measuring the total force and the surface elevation and reconstructing the kinetics with the stream function wave theory (Figure 2.5).
Figure 2.5: Results of Chakrabarti (1980). Evaluation of CM (upper panel) and CD
(lower panel) with respect to KC for values of Re in the range 2-3·104.
A good relation with KC, ranging from 0 to 85, is obtained but the results, differently from those of Sarpkaya (1976) where the hydrodynamic conditions were better controlled by the U-tube, present a high scatter for the same KC values (e. g. for KC=5, CDvaries from 1.4 to 2 and CM from 1.5 to 1.9).
The application of Equation 2.6 has proved to give a good estimation of the total force over a vertical cylinder until the field conditions keep similar to the assumptions made for the resolution of the problem. In particular, the limitations of the formula have been already argued by several authors (Dean, 1976; Journ´ee and Massie, 2001; Vongvisessomjai, 1976):
• the integration is performed considering a small amplitude wave, this condition is not suitable for real waves in shallow/intermediate depths where the nonlin-earity is higher and the use of linear theory for the calculation of velocity and acceleration is not recommended
• the choice of the coefficients CDand CM plays a primary role on the evaluation
of the total force. These coefficients are obtained experimentally; among the others, Sarpkaya (1976) made an extensive work providing results obtained with U-tube tests depending on the values of Re and KC and Chakrabarti (1980) performed wave tank tests. However, these values show an elevated scatter and they are highly dependent on the type of facilities used (e.g. wave or U-tube) and on the method used for the processing of data (a more detailed description of the tests and of the results is reported in Section 4.1.2). A review of the most used
methods for the evaluation of the coefficients CDand CM is reported in Journ´ee
and Massie (2001), where, among the others, are explained the Morison method, the Fourier averaging technique and the least square technique. Isaacson (1979) noted how the choice of the method highly influences the results; starting from the same initial data set, each method gives a different pair of coefficients and the scatter between them can be consistent
• as highlighted also by different authors (Dean, 1976; Journ´ee and Massie, 2001), the force measured in the drag regime can be used only for the drag coefficient evaluation and, vice versa, the inertia coefficient has to be studied with a force in the inertia regime
• when no direct measurement of water particle velocity and acceleration is avail-able the choice of the proper wave theory for their determination is very impor-tant and it can lead to an under/over-estimation of the total wave force • the coefficients are considered constants depending on the shape and roughness
of the pile and on both the KC and Re parameters. However, in an oscillatory flow, those parameters should not be considered constant and, thus, CD and
CM should change depending on the wave phase and, furthermore, should not
be considered constant in the vertical integration of Equations 2.4 and 2.5. For all these reasons, the choice of the right coefficients must be done considering all the exposed factors. One should know if the data set derives from U-tube or wave flume tests, if the kinematics is measured or computed and, if computed, which type of theory is used and which data processing method is used for the computation. In addition, the improvement in the calculation of the coefficients under laboratory conditions needs the verification and the validation in full-scale prototype situations.
Chapter 3
Experimental set-up and
Analysis
Experimental tests were carried out at the wave flume of the Hydraulics and Maritime Construction Laboratory of the Universit`a Politecnica delle Marche (Ancona, Italy). The general description of the flume and of the laboratory facilities is reported in Sec-tion 3.1. Two different experimental campaigns were performed to fully understand how the presence of a pile in the marine environment influences the hydro and the morpho-dynamics induced by the wave action.
• the first experimental campaign (Section 3.2) consisted in a rigid bed model for the evaluation of the total wave force acting over the pile and of the velocity field with particular attention on the vortex generation and evolution. Hence, an aim of this campaign is to evaluate the influence of the nonlinearity of the waves in comparison with the results that could be obtained considering the wave as linear. To do so, the Fourier decomposition approach is used for the evaluation of the velocity and the acceleration of water particles and also for the comparison of the force in conjunction with the well known formula of Morison et al. (1950). Moreover, for the better understanding of the process of formation, growth and detachment of vortices, also pressure gradients are measured. Even if they are indicated as the main responsible of the vortex detachment, not many works are carried out on these topics and, thus, further research is needed. Finally, for the visualization of vortices, the PTV technique on different horizontal and vertical planes has been applied and the results are integrated with those from pressure measurements and from the mobile bed experiments for the characterization of the scour depth and patterns. It is clear that a measurement obtained in rigid bed condition does not perfectly represents the movable bed in which the scour hole and the deposition zones affect the velocity field and, hence, the coherent structures. However, this effect can be considered negligible in the result obtained for integral variables such has the total force over the pile. Moreover, near-bed flow visualization and analysis is often studied in rigid bed conditions in the literature (Ting, 2013; Henriquez et al., 2014) because of the complexity induced by the interaction between the sediment phase with the seeding and the arduous procedure for the identification of each part (Miozzi et al., 2019).
the scour patterns around the vertical cylinder associated to different wave conditions. Even if various studies have been conducted in the literature for regular and random waves, here the focus is on nonlinear waves. The aim of the study is to evaluate which type of morphological pattern is generated depending on the wave conditions and to evaluate the maximum value of the scour depth. A critical review of the available formulations in the literature is done and new approaches are studied for the scour evaluation under regular or random waves. For these reasons, a mobile sandy bed model is made and several wave conditions are tested.
The results of the experimental tests are reported in Section 4.
3.1
Laboratory facilities
The experiments were carried out at the wave flume of the Hydraulics and Maritime Construction Laboratory of the Universit`a Politecnica delle Marche (Ancona, Italy). The wave flume (Figure 3.1) is 50m long, 1m wide and 1.3m high. The wave motion was forced by a pyston-type wavemaker that operates up to a maximum run of 0.5m (semi-stroke) and a maximum velocity of 0.8m/s.
Figure 3.1: Global sketch of the wave flume for the mobile bed model realized in the Hydraulics and Maritime Construction Laboratory of the Universit`a Politecnica delle Marche (Ancona, Italy)
An absorbing mildly sloping beach (slope 1:20) made of coarse gravel, was used to reduce the wave reflection and to guarantee an undisturbed flow in the measuring area located at about 17m from the wave paddle in order to preserve undisturbed flow conditions in the measurement area. The wave reflection was evaluated with the nonlinear method proposed by Lin and Huang (2004) and it was lower than about 4-5%. The side walls of the flume are glassed for the central 36m and enable one to videorecord and carry out optical measurements.
The acquisition of all the measuring instruments used in the present work were made by means of a home made software named WaveLogger that synchronizes the data by using TTL signals. A brief description of all the laboratory facilities is reported:
• Free water surface gauges: eight HR Wallingford electro-sensitive elevation gauges are used to measure the water level. The wave probe operates by measur-ing the current that flows between two stainless steel wires that are immersed in the water. This current is converted to an output voltage that is directly proportional to the immersed depth. The frequency of acquisition used is of 35Hz.
• Pressure sensors: four relative pressure transmitters Keller 23SY and four miniature ruggedized absolute pressure transducers Kulite XTL-190SM are used