Università Politecnica delle Marche
Scuola di Dottorato di Ricerca in Scienze dell’Ingegneria Corso di Dottorato in Ingegneria Industriale
---
Novel modeling approaches for analyzing
the design of distributed multi-energy
systems
Ph.D. Dissertation of:
Andrea Bartolini
Supervisor:
Prof. Gabriele Comodi
Ph.D. Course coordinator: Giovanni Di Nicola
_________________________________________________
Università Politecnica delle MarcheDipartimento di Ingegneria Industriale e Scienze Matematiche – Curriculum in Ingegneria Energetica
Acknowledgements
I wish to thank …Abstract
This dissertation describes a set of methodological improvements in the analysis of distributed energy systems and their design, with a particular focus on systems involving more than one energy vector (multi-energy systems). The question of the planning of such systems is becoming extremely important and needing of novel approaches due to an energy fruition scenario which is going to greatly mutate due to several changes which can be mostly reconducted to the need of making the fruition of energy more sustainable and with a lesser environmental impact. Such paradigm changes are of diverse nature: coming from both technological trends, social changing paradigms and an always more impellent policy commitment towards reducing the carbon footprint of our society. As an example they can be attributed to the continuously increasing penetration of renewable non-controllable energy conversion sources, the delocalization of energy systems into a distributed paradigm, and the drastic changes of the modality of the fruition of some energy related commodities with the increasing presence of air conditioning and electric vehicles for example. Given the complex nature of such problems, and therefore the computationally demanding nature of the models needed to gain insights about their workings, a renovated focus is put on obtaining models which allow for the analyses to be undertaken in reasonable amounts of time in this novel energy systems context without compromising on the necessary level of detail into the modeling. In this thesis, we define two potential approaches in doing so, tackling two different challenges that emerged from the available literature.
We define a novel approach for the consideration of the temporal dimension in the planning of distributed energy systems. Specifically, the approach aims at properly considering the multi-decade timespan over which a decision concerning the potential adoption of energy systems has to be made. In this setting where some relevant parameters such as the capital costs for the investments in the technologies might change even significantly over such long periods. The approach is implemented within a framework having at its core an optimization problem, solved through mixed-integer programming and heuristic techniques. The validity is then tested on a realistic test case modeled by referring to an open dataset of energy related consumptions for a set of households located in the United States, where the goal of the methodology is finding the optimal year of adoption of an electricity
storage system (if any) considering its dropping costs over the multi-year planning horizon.
We define a methodology to consider various sources of uncertainty within simulations performed by means of an already well established model: being the EnergyPLAN model for smart multi-energy systems. This is achieved by defining a framework that models a set of uncertain inputs such as the availability of solar radiation, the uncertainty in the user demands for space heating and sanitary hot water, and finally the uncertain nature of the demands of an electric vehicle fleet. The test case over which the methodology is tested is the city of Osimo, situated in Italy, which can be assumed to be a small scale multi-energy system, and about which much data needed for the modeling is available through its municipal energy company. The goal of the analyses is to understand how two different flexibility assets: namely a large heat pump coupled with a thermal storage system, and a fleet of electric vehicles equipped with smart charging, can aid in welcoming high shares of non controllable renewable energy sources (photovoltaic panels). This to avoid the feeding of a large share of electricity generation surplus to the national distribution system (thus increasing auto consumption) and to understand the impact on carbon emissions to gain a potential policy related insight.
Contents
Acknowledgements ... i Abstract ... ii List of Figures... ii List of Tables ... iv List of Abbreviations ... v Chapter 1 - Introduction. ... 11.1 Smart distributed multi energy systems ... 3
1.2 Analyzing distributed multi energy systems ... 4
1.2.1 What’s missing ... 6
1.3 Contributions to the state of the art and thesis outline ... 7
Chapter 2 – A methodological approach for the long term planning of distributed energy systems. ... 9
2.1 Preface to chapter 2 ... 9
2.2 Introduction and state of the art ... 10
2.3 Methodology ... 11
2.3.1 Case study modeling strategy ... 11
2.3.2 Proposed framework ... 13
2.3.4 Case study characterization ... 19
2.4 Results ... 23
Chapter 3 – A methodological approach to improve the results of simulations
of high renewables penetration local energy systems ... 27
3.1 Preface to chapter 3 ... 27
3.2 Introduction and state of the art ... 28
3.3 Methodology ... 29
3.3.1 The framework at a glance ... 29
3.3.2 Model of the Osimo municipality in EnergyPLAN ... 32
3.3.3 The EV load model ... 41
3.3.4 The weather variability model ... 45
3.3.5 Simulations design and variability representation ... 53
3.4 Results ... 54
3.4.1 Experiment #1 – Increased PV penetration in Osimo as-is... 55
3.4.2 Experiment #2 – Osimo with increasingly flexible district heating network ... 59
3.4.3 Experiment #3 – Osimo with increasing penetration of EVs with smart charge ... 65
3.4.4 Experiment #4 and results recap ... 69
3.5 Conclusions ... 74
Chapter 4 - Conclusions. ... 76
4.1 Key findings ... 76
4.2 Future developments ... 78
List of Figures
Figure 1 - Energy hub conceptualization ... 12
Figure 2 - Visualization of the proposed framework ... 13
Figure 3 - Graphical representation of the two timescales ... 14
Figure 4 - Workflow of the optimization problem solving algorithm ... 19
Figure 5 - Electricity demand of three sampled weeks ... 20
Figure 6 - Heating demand of three sampled weeks ... 20
Figure 7 - Cooling demand of three sampled weeks ... 21
Figure 8 - PV system production of three sampled weeks ... 21
Figure 9 - Simulated drop in battery costs over the planning horizon ... 23
Figure 10 - Dispatch strategy of a battery case ... 25
Figure 11 - Visualization of the EnergyPLAN based proposed framework ... 31
Figure 12 - Schematization of Osimo's distributed energy systems configuration . 32 Figure 13 - Actual PV capacity factor in Osimo in 2018... 33
Figure 14 - Actual DHN in Osimo in 2018 ... 34
Figure 15 - Actual net load of Osimo in 2018 with respect to the national grid ... 34
Figure 16 - Obtained electricity demand for four sampled weeks ... 36
Figure 17 - Electricity exchanges with the national grid according to the EnergyPLAN simulation of the base case ... 40
Figure 18 - Modeling approach for the generation of the EV loads ... 42
Figure 19 - Charging event probability density ... 43
Figure 20 – Hourly charging pattern generated for five weeks for a 5% EV penetration ... 44
Figure 21 - Electricity yield distribution for a 1 kWp system in Osimo ... 46
Figure 22 - Temperature actual measured value and moving averages for two winter weeks ... 47 Figure 23 - Temperature actual measured value and moving averages for two winter
Figure 24 - Custom made binary features over one sample day ... 49
Figure 25 - Performance of the model on the test set on a winter week ... 50
Figure 26 - Performance of the model on the test set on a summer week ... 50
Figure 27 - Distribution of the temperatures in Osimo from 2000 to 2018 according to the Renewable Ninja model ... 51
Figure 28 - Performance of the model on a winter week ... 52
Figure 29 - Performance of the model on a mid-season week ... 52
Figure 30 - Performance of the model on a summer week ... 53
Figure 31 - Yearly electricity export in Experiment #1 ... 56
Figure 32 - Yearly electricity import in Experiment #1... 56
Figure 33 - Yearly CHP produced heat in Experiment #1 ... 57
Figure 34 - Yearly boiler produced heat in Experiment #1 ... 58
Figure 35 - Yearly CO2 emissions in Experiment #1 ... 59
Figure 36 - Yearly electricity import in Experiment #2... 60
Figure 37 - Yearly electricity export in Experiment #2 ... 60
Figure 38 - Yearly boiler produced heat in Experiment #2 ... 62
Figure 39 - Yearly heat pump produced heat in Experiment #2 ... 62
Figure 40 - Yearly CO2 emissions in Experiment #2 ... 63
Figure 41 - Yearly CO2 emissions from the distributed generation systems Experiment #2 ... 64
Figure 42 - Yearly electricity export in Experiment #3 ... 65
Figure 43 - Yearly electricity export in Experiment #3 ... 66
Figure 44 - Yearly CO2 emissions in Experiment #3 ... 68
Figure 45 - Yearly electricity exports to the national grid across all the simulations ... 70
Figure 46 - Detail of yearly exports to the national grid across all the simulations 71 Figure 47 - Yearly CO2 emissions across all the experiments ... 72
List of Tables
Table 1 - Technical and cost parameters ... 22
Table 2 - Results of the experiments... 24
Table 3 - EnergyPLAN parameters for the fossil fired transport sector ... 37
Table 4 - Technical parameters for the local EV fleet ... 45
Table 5 - Summary of the performed simulations ... 54
Table 6 - Grid related yearly CO2 emissions [kt] in Experiment #3 ... 67
Table 7 - Share of grid related CO2 emissions on total emissions in Experiment #3 ... 67
List of Abbreviations
CHP – Combined Heat and Power DHN – District Heating Network EV – Electric Vehicle
HP – Heat Pump (electric) MES – Multi Energy System
MILP – Mixed Integer Linear Programming PV – Photovoltaic
RES – Renewable Energy Source TES – Thermal Energy Storage
Chapter 1.
Introduction
While climate change has been for years only a topic discussed by scientists and policymakers, now the debate is on the mouths of a much bigger audience. The effects of climate change are more tangible than ever, with consequences that directly impact both our society and economies. And this is only one of the faces of the drawbacks of a model of development that needs to be re-thought following a more sustainable approach as highlighted by the United Nations with a set of goals laid down in the 2030 agenda for sustainable development [1]. Within the scope of this thesis, the 7th and 11th goals deserve a particular interest: being them respectively “affordable and clean energy” and “sustainable cities and communities”. As a matter of fact already more than 50% of the world population already lives in urban areas and such quantity is projected to significantly increase in the near future [2]; to the point that the vast majority of the world’s population will be living in cities, making them also the places where the most energy is consumed. At the same time numerous reports from research institutions and industries indicate that we are far from addressing the challenges brought by climate change in an effective way, since we appear to be very far from the targets set in the Paris agreements [3], [4]. In this sense many countries and organizations have already took action by enforcing and constantly updating policies aimed at a deep decarbonization of our society in many sectors: such as carbon taxes or impositions on the share of electricity coming from renewable energy sources [5].
For the magnitude and the urgency of the reasons described a rational usage of energy in urban contexts is gaining a renovated interest by the research community. Among energy related studies the field that deals with studying and understanding how the energy needs will shift in time, and therefore how to direct potential efforts in influencing such trends, is commonly referred to as “energy planning”. The practice of energy planning is then aimed at understanding how the energy scenery will evolve and, depending on the type of stakeholder whose interests are represented by the planning practice (whether an energy company, a government or a local community), prepare for such future in the best way possible, given the intrinsic
uncertainties that come with it. The research on the planning of energy systems has been historically undertaken with the assistance of a wide variety of computer models to represent the workings of such very complex systems from a wide variety of angles, in order to understand their inherent complexities and obtain actionable insights needed for policy or other types of decision making.
These models have been continuously improved through the years but a set of very actual paradigm changes are calling for new modelling techniques and model capabilities in order to provide insight on modern energy systems. Among such paradigm shifts lies the already mentioned continuously increasing presence of renewable energy sources. Several studies indicate that solar photovoltaic (PV) and wind electricity generation technologies capital costs are constantly dropping and are expected to tumble in the near future [6], [7], being already below grid parity in some countries regarding their levelized cost per kWh of electricity generated. Another potentially influential factor lies in the dropping costs of various storage technologies such as specifically battery technologies [8], which is again pushed by a fast technological development as battery powered vehicles appear again to be the very near future of private mobility [9]. The heavy presence of such vehicles will be itself a great paradigm shift, with a sector which is itself very influential in terms of energy requirements and emissions shifting its needs from fossil based fuels to electricity, posing together with the increased penetration of non controllable electricity generation sources significant challenges to existing electricity transmission and distribution infrastructures [10][11]. A last mention is needed regarding the already anticipated income of policies such as carbon taxes, that might alter the economical tradeoffs of existing technologies in a timespan which is of interest in energy planning practices.
The just described scenario can be synthetized as a dramatic change of the scenery in energy systems design, which calls for a word above all and that word is flexibility. Flexibility could be granted by means of a wide set of approaches (both technological and social/behavioral) but one that could integrate all of such is the distributed energy systems paradigm: both for electricity (which has historically been provided under a top down centralized scheme) and all the rest of energy related commodities (and not only) that might be needed by a modern society in the so called smart multi energy systems. As a matter of fact the correct “amount” of distributed generation is still under debate [12] it’s beyond doubt that energy has a local dimension and the needs of the challenge cannot be met following a one-fits-all approach [13].
1.1 Smart distributed multi energy systems
Firstly, a distinction needs to be made between the concept of distributed energy system and a multi energy system. The former refers to an energy system which generates part (or all of) the needed energy commodity close to the site of consumption [14]. As opposed to the predominant paradigm (at least in developed countries) of large producers using a complex transmission and distribution infrastructure (electricity being the main example) a distributed system allows to meet the needs of the local user by using a set of locally deployed energy conversion assets, cutting on distribution losses and enabling in tailoring such systems to the needs of the user.
A multi energy system (MES) is the expansion of this concept to multiple energy vectors: as defined in [15] a MES is a system in which “electricity, heat, cooling,
fuels, transport, and so on optimally interact with each other at various levels”.
Following such definition a MES could be also a large scale system (e.g. a large district heating plant), but within the scope of thesis the focus will be put on small district scale MES. The benefits of a MES approach lie in the possibility of exploiting potential interactions between traditionally decoupled sectors, such as for example electricity, heating, cooling and transport in achieving better usages of primary energy resources and welcoming higher shares of non-controllable renewable energy sources [16], [17]. The concept of MES has been widely analyzed in the literature using a wide span of potential test cases, from groups of buildings to towns. To give some examples it has been widely shown how the coupling of local electricity, heating and cooling networks can help in better welcoming high shares of non-controllable energy sources and lowering emissions [18][19][20][21]. The same has been done for the role of storage [22][23][24] and the presence of a EVs fleet [25][26]. All of the studies confirm the mentioned flexibility potential of the integration of energy vectors, allowing for the reduction of CO2 emissions and a greater uptake of non controllable electricity generation sources.
For this reasons the research efforts are translating into actual demonstrational projects, aimed at furtherly assessing the validity of these approaches both in the planning [27] and in the operational/management phases of such projects [28]–[30]. A distributed MES thus allows to achieve of the benefits of both the two paradigms, cutting on transmissions losses and exploiting synergies between different energy related sectors in achieving solutions which are tailored to the local conditions of the setting under analysis. While the concept of MES can be thought of as a purely
“technical” paradigm there is also a paradigm shift more on the social side with the establishment of local energy communities, whose paradigm is currently undergoing regulation within the EU. In this sense a community is defined as a “legal entity
controlled by natural persons, local authorities, including municipalities, or small enterprises and micro-enterprises, based on voluntary and open participation, whose primary objective is to provide environmental, economic or social community benefits rather than financial profits” [31], [32]. In this context the institution of
such entities could furtherly help towards addressing the local dimension of energy needs, given the same entity would be both the user of a given demand and the provider of the same commodity.
It is then clear how the distributed MES paradigm could be an asset in addressing some of the challenges related to energy systems, which ultimately lead to achieving a more sustainable society.
A last note addresses the size of a distributed/local energy system, which is not clearly defined in the available literature. A study reviewed the definitions of a distributed energy system [33], and a further and more recent review is provided in [12], with the conclusion that there is really not an agreed standard on what qualifies a distributed/local energy system in terms of size and availability of a greater infrastructure connection, as long as the production is physically located close to the consumer. For this reason within the scope of this thesis, the size of a distributed/local energy system is defined as ranging from the size of a cluster of buildings to a small town.
1.2 Analyzing distributed multi energy systems
As anticipated distributed MES are intrinsically very complex objects to analyze even if only their techno-economical workings are under analysis. This lead and it is still leading to the development of a very wide set of models which focus on different aspects of such systems. They could be aimed at analyzing systems from a planning instead of an operational perspective; the analysis of only a given subset of considered energy systems/user demanded commodities; the driver of the analysis, whether focusing on an economical instead of an environmental aspect and so on. In the literature there is a vast amount of models, using different modeling approaches for the analysis of different aspects of distributed energy systems [34]. While some
of these models are only defined in terms of their mathematical definition, thus they have to be programmed within a proper environment, others have developed in software packages, some of which are commercial products and some others are available with a free license, up to completely open source models [35]. The mathematical approaches behind the models are very wide, using different degrees of both linear and discrete programming, and with a great importance of the algorithmic approach, given the inherent difficulties in tackling such demanding problems.
The models that are available as self-contained software packages can be classified using a wide set of criteria, spanning from: the level of discretization both in the temporal and spatial dimensions, the ease of use also with the presence of a graphical user interface, the type of license under which the model is available and so on [36]. A more comprehensive description of the distributed systems modeling scenery is beyond the scope of this thesis, so it’s delegated to a very abundant literature [37], [38][36].
The scope of this thesis is to propose improved approaches in techno-economic analysis models for distributed MES, and in this sense a broad distinction can be made between optimization and simulation models. In the first the best possible choice of a given set of parameters is computed by pursuing the minimization or maximization of a given criteria (or a set of them) provided the existence of some constraints. In an energy systems scenario this could translate in two broad categories of problems: optimizing design or optimizing operations. An example of a problem falling in the first category could be finding the optimal set of technologies to meet multiple user demands over a representative timespan; while an example of the second could be finding the best management strategy for a given set of systems in a similar context, but removing the option of using non owned systems. Examples of energy systems optimization models are: OSeMOSYS [39], [40], H.O.M.E.R. [41], EnergyPRO [42] and Calliope [43]. Simulation models on the other hand just wish to replicate the way a physical system works, allowing for its behavior and evolution over time to be studied more in detail; in this case the insights regarding “best” solutions are drawn from a “what-if” scenarios approach. While some of the just mentioned optimization models are also able to just simulate energy systems, a model which is created exclusively for simulation purposes is the EnergyPLAN model [44].
Given the intrinsic complexity of MES in any model falling in any of the categories just described there is a trade-off to face regarding the level of represented detail and
the computational complexity in solving the model. There are a number of approaches for dealing with such compromise and achieve a level of detail which is representative enough for the insights that are sought to be still valid, and in the meantime limit computational effort to a manageable size. Being the already mentioned challenges for novel energy systems models such compromise has to be re-thought in order to have models able to provide insights on modern energy systems.
1.2.1 What’s missing
As highlighted in the previous paragraph many authors have reviewed and given a summary of the energy systems modeling scenery; among those a 2014 review study [45] highlights the needs to address some challenges in established paradigms in energy systems modeling in spite of the issues described earlier on in this chapter. By narrowing such challenges to the ones related to the simulation and optimization of energy systems two of them are raised and described.
Regarding optimization models is highlighted how the challenge is addressing the changing importance of the time and space dimensions which call for an increased resolution, while at the same time keeping a tractable model from a computational perspective. The time/space dimensions are in-fact needing a renovated interest given the anticipated challenges regarding the distributed dimension of energy (space) and the ever increasing presence of non controllable energy sources and parameters evolution over very large timespans which call for both an high temporal resolution in a long term scenario analysis paradigm [46], [47]. With simulation models one of the highlighted challenges regards the degree to which uncertainty is represented and accounted for while gaining insights from energy systems models, which can be distinguished in two broad types: an epistemic uncertainty which can be improved with an effort from the modeler in obtaining more or better data, and an aleatory uncertainty which can be addressed by using appropriate techniques such as stochastic programming or Monte Carlo based simulation approaches [48]. The importance of the uncertainty aspect, specifically in the design of distributed energy systems, is also described in a separate review study [49] which goes more into the detail of the various sources of the uncertainties, their potential impact while analyzing energy systems and the available approaches in doing so. It is highlighted how an improper consideration of uncertainty sources within the design of
distributed MES could lead to suboptimal solution and/or misleading insights regarding the outcomes of such models. Uncertainty can be defined as “any deviation
from the unachievable ideal of completely deterministic knowledge of the relevant system” [50], and the deterministic approach is actually the one that is mostly
followed within the analysis of energy systems, making the outcomes of such models heavily dependent on the assumptions behind the deterministic parameters. An effort is then needed to characterize these sources of uncertainty in order to account for their impact, and the characterization strategy greatly depends on the characteristics of the phenomenon which is to be modeled. Such uncertainty sources could come from the availability of a non controllable resource (solar radiation, wind etc.), to an unsteady user demand, the cost of a particular technology and so on; and the technique used to characterize it could depend both on the characteristics of the phenomenon itself and the data which is available.
Given the huge amount of uncertainty sources within the analysis of distributed MES a proper consideration is then key in order to obtain valuable insights, especially within the challenges anticipated in the first part of the introduction.
1.3 Contributions to the state of the art and thesis outline
Given the context introduced so far in this chapter this thesis illustrates a set of contributions to improve the described state of the art in the practice of analyzing the planning of distributed multi energy systems, both when optimization and simulation duties are sought. The approaches directly tackle the challenges highlighted in the previous paragraph, addressing the needs for a proper representation of the complex temporal dimension when an optimal design choice is sought, and the impact of uncertainties while analyzing a given context. The contributions both involve programming approaches and the usage of freely available energy models, and the proposed methodologies are tested by means of analysis performed on realistic test cases, which are modeled with a mix of available data and further modeling efforts. The first contribution is a methodology to analyze the optimal planning of distributed energy systems that considers how some of the simulation parameters might change in time over a planning horizon of multiple decades. This is achieved by defining an enhanced representation of the time horizon, using two different timescales over which to compute the operational and strategic decision making phases. The model is solved by means of a custom-made heuristic algorithm,
allowing both the convergence to an optimal solution while keeping an acceptable computational tractability. The methodology is tested on a realistic test case modeled by means of freely available measured data, where the potential adoption of a technology is studied over a long-term planning horizon.
The second contribution is a framework that wishes to correctly assess the intrinsic variability of some simulation parameters within the simulation of local energy systems with high penetration of renewables, achieved by means of the EnergyPLAN model. Specifically the variability sources that are represented are the availability in time of the solar resource and the demands of a set of commodities from the users such as heating, electricity and electric mobility. A tailored approach is used for each of the uncertainty sources, using both data-driven and mechanistic approaches to represent uncertain realistic hourly distributions for the mentioned variables. The methodology is tested on a real test case representing a small town with an already heavy presence of non controllable renewable energy source, which configures itself as a MES. The goal of the analysis is understanding to which degree such high penetration (and potentially an increased one) can be used locally in order to increase the energy independency of the town; and also understand the main drivers towards reducing the carbon footprint in such high RES penetration contexts.
Chapter 2.
A methodological approach for the long
term planning of distributed energy
systems
2.1 Preface to chapter 2
In this chapter, we introduce a methodology to assess the impact of parameters that exhibit a significant change over long timespans (multiple decades) and that might affect the optimal design of distributed energy systems. As anticipated the scenery regarding on energy systems will be affected by potentially game changing aspects such as the significant drop on the costs of some key technologies. Thus a methodology is needed to consider such changes while determining the optimal design of a distributed energy systems: a context where the decisions that are made will be in place for several years (more than a decade). In this chapter we then propose a mathematical model of the optimal design of the energy systems needed to meet several energy related demands of a user, by also considering parameters that change over time. The work has been undertaken in two parts, with a first activity aimed at obtaining a model to compute such optimal design for a representative year with a reasonable computation time. Secondly, the model has been expanded to include the multiple year modeling in a way that could again grant a reasonable computational time. This has been achieved by defining two different timescales over which perform analyses related to the optimal design: a yearly timescale with hourly resolution over which the operational strategies of the used technologies is computed, and a secondly a multi-decade timescales with yearly resolution over which the decisions regarding potential investments is computed. Both of the parts have been realized by coding a mathematical model in the AMPL programming environment.
My role in the work described in this chapter regarded the development of the idea of dividing the optimization in two distinct phases (yearly and plurennial), and the
elaboration and characterization of the case studies used to validate the approach. The rest of the model has been developed conjunctly with Dr. Roberto Rosetti and Mr. Andrea Pizzuti, which also entirely took charge of the programming activities. All the activities have been supervised by prof. Gabriele Comodi and prof. Fabrizio Marinelli, which contributed with comments and editorial assistance.
From the activities described in this chapter we obtained two peer-reviewed publications: a conference paper presented at the ICORES 2019 conference held in Prague [51], and another conference paper presented at the ICAE 2019 conference held in Västerås [52].
2.2 Introduction and state of the art
To the best of the authors knowledge the only approach available in the literature that tries to consider the impact of parameters changing over a multiple years timespan is the one proposed in [53], which integrates a previously proposed optimization approach [54] by the same authors takes couples the EnergyPLAN simulation model with an external optimization shell using evolutionary algorithms. The goal of the model is to study transition pathways for a national/regional scale energy system. On the other hand quite a few studies that wish to analyze the optimal design of distributed energy systems have been proposed using a wide set of mathematical approaches. These vary from exact techniques such as MILP to evolutionary or other heuristics based techniques: while the former can guarantee to achieve a globally optimal solution [37] they are computationally much more demanding than the latter, especially in the context of energy systems design, where the size of the problem (in terms of variables to compute) in usually very large. For this reason within the present study an ad-hoc heuristic approach is used, with such type of approaches already followed in the literature by many authors [55], both to address the optimal energy systems design (in terms of components size) [56], [57] and the optimal network configuration [58], [59].
The approach described in this chapter is aimed at analyzing scenarios that represent local energy systems challenges, and wishes to do so by using a metaheuristic approach (improving the one proposed in [51]) for both the multi-year design phase and the operational phase, thus achieving an optimal solution for both.
The approach is validated with the application on a realistic scenario, that considers a residential user with an high penetration of non-controllable renewable electricity generation source (a PV system), where the decision under analysis is the potential purchase of an electricity storage (a battery system) considering different retributions for a feed-in tariff and the dropping price of the storage system in the years to come. The residential district is modeled by referring to a dataset which includes real consumption data for a set of households in the United States [60], measured with high temporal resolution for a whole year, from which the consumption data for electricity (excluding space cooling appliances), cooling and heating are obtained. Thus, all of the three commodities are considered in the analysis in order to also consider the potential role of cross-vector technologies.
2.3 Methodology
2.3.1 Case study modeling strategy
In order to model the district an energy hub we adopted an energy hub modeling strategy as in [61], an energy hub can be defined as an integrated unit within which the conversion, storage and usage of different energy vectors (but also any other type of commodity) takes place. Thus, the energy hub has to get resources from outside its boundaries (e.g. natural gas, grid electricity, solar radiation…) and manipulate it internally by means of specific technologies in order to meet the demands of a given user, such technologies can already be present within the hub’s boundaries but they can also be purchased in order to do so by sustaining an appropriate cost. The operations of the energy hub are then usually simulated over a representative period of time, aimed at obtaining relevant insights regarding for example: costs sustained over the mentioned timespan, CO2 or other pollutants emissions, and potential investments in new technologies in order to lower the total costs.
The energy hub is then a general scheme that can be adapted to diverse settings, and this is used to model the case study that will be used to test the proposed methodology. As mentioned in the previous paragraph the test case is a residential district which needs three distinct energy vectors to properly function, thus the proposed energy hub is shown in Figure 1.
Figure 1 - Energy hub conceptualization
In the Figure different types of elements are visible. Firstly the three energy vectors in the form of buses from which the vectors can be both withdrawn and fed in: for electricity, space cooling and space heating. Interacting with such buses there are both the technologies in charge of converting/producing the energy vectors and the user that absorbs them to meet the demands. Finally there are three external sources for three different resources: natural gas and electricity to be purchased from the respective distribution infrastructures, and solar radiation to power the local PV system. It is also considered that the electricity can be fed back to the grid given a proper compensation (feed-in tariff) if such electricity is produced with the PV panels.
All of the elements in the energy hub have then to be quantified in order to represent the test case of the residential district, which means representing the demands, the solar energy availability and a set of realistic costs for the considered technologies and the purchasing of external resources from the national distribution infrastructures.
2.3.2 Proposed framework
In order to solve the multi decade optimization problem a strategy to tackle the time dimension of the problem has been implemented in a framework, which is shown in Figure 2. The goal of the whole framework is to compute the optimal design for the energy systems needed to meet the users demand over a planning horizon of multiple decades, by minimizing the total costs sustained in such timespan. Such costs relate both to operating the already existing assets (such as maintenance costs or acquisition of externally purchased commodities), and also to the investments needed to purchase new equipment.
Figure 2 - Visualization of the proposed framework
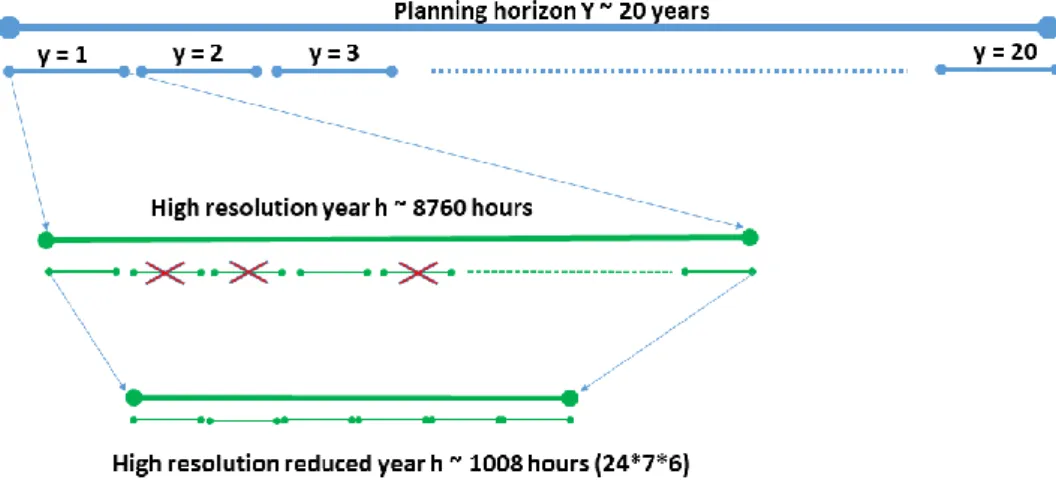
The core of the approach, and therefore of the framework, is the modeling of the time horizon of interest (over which to choose potential new investments) which is achieved by defining two distinct time scales with different features, the approach is shown graphically in Figure 3, and the two timescales have the following characteristics:
• A multi-decade timescale with yearly resolution (in blue in Figure 3), over which to compute investment decisions that are then function of a specific year • A yearly timescale with hourly resolution over which to compute decisions on
how to manage the technologies available in meeting the users demands (in green in Figure 3), which are defined with the same hourly resolution.
This timespan if furtherly reduced by selecting only an appropriate number of time-slices in order to reduce even more the computational effort.
Figure 3 - Graphical representation of the two timescales
As shown in Figure 2 the inputs to the problem are then defined depending on the timescale they refer to. The user demands and the solar radiation availability are defined on an hourly basis for a representative year. Some other parameters may though be defined to vary over time on a longer time horizon, and this is the case of the cost of some of the technologies or for example the incurrence of new policies or regulations, such as for example the imposition of a carbon tax by the local regulation entity from a given year onwards. Finally, some parameters preserve the same value regardless of the passing time, and this is the case for example of the costs of technologies which are considered to be already mature.
As shown in Figure 2 an intermediate step is added before solving the actual optimization problem and this is aimed at reducing the timespan over which the computation of the operational phase is performed from a year to a subset of
representative weeks, in order to reduce the computational burden of the whole analysys. This is achieved by means of a clustering procedure, similarly as in [62], to select weeks from the yearly timespan based on a set of features which are computed for each week of the available timeseries data, in this case a year.
Specifically the technique that is used is the k-means clustering algorithm [63], which implementation is taken from the SciKitLearn python package. The week is chosen as the smaller time slice to simulate in order to properly take into account the role of storage technologies within the district. A common storage technology application lies in storing electricity surplus from non controllable renewables during the day for a later usage during the night (home battery system coupled with PV), and for this the slicing of the timespan in representative days would actually work fine. But other type of applications actually take advantage of offsets on a weekly basis, as for example in industries which exhibit much lower energy demands during the weekends when they’re closed. Even though within this work the framework is tested on a residential user scenario the time slices are kept to a week in order to make it more general.
The clustering procedure works as follows:
• The yearly timespan is sliced in weeks and to each week is assigned an identifier which is an integer value
• For each of the weeks a set of features is computed: i) Average weekly electricity demand in kWh ii) Average weekly heating demand in kWh iii) Average weekly cooling demand in kWh
iv) Average weekly available solar radiation in kWh/m2
• A predefined set of clusters, meaning representative weeks, is computed by analyzing the similarities in the mentioned features. The number of clusters is arbitrarily set to 6, to hopefully represent two winter, two summer and two mid-season weeks.
Following such procedure the year intended to represent the realistic timespan over which to represent the district will be reduced from one year to 6 weeks, still maintaining an hourly resolution.
All of the mentioned parameters are then fed as inputs to an optimization problem, which as mentioned is split up in two distinct problems: a strategic one where the investment decisions are computed, and an operational one where the different
systems available are scheduled in order to meet the demands of the users. The approach is shown graphically in Figure 3.
Both of the two problems use a MILP (Mixed Integer Linear Programming) modeling approach for both the variable representing investment decisions and the ones representing the dispatch strategy in the operational phase. The two timescales are modeled by defining two distinct sets over which such variables are defined: • A set H to represent the year in hourly resolution, where the dimension of H
following the dimensionality reduction is 1008 (24 hours * 7 days * 6 weeks) • A set Y to represent the planning horizon with yearly resolution, where the
dimension of Y is 32 (from 2018 to 2050
Following such definition the investments in a given technology are defined by a binary variable which is also function of the specific year, returning in that way also the optimal year of adoption of the given technology.
Other than the ones modeling the workings of the technologies an additional set of constraints is enforced in order to force a realistic technological lifetime (which is provided as a simulation parameter for each available system) over the usage of the systems. The planning horizon spans multiple decades, but many of the potential technologies actually have a much shorter technical lifetime. Thus, if an investment on a given technology is made by the algorithm that same technology will have to be re-purchased by sustaining again its cost once its technical lifetime has expired. The modeling of the technologies workings follows a linear approach, with conversion efficiencies assumed to be constant regardless of the operating conditions in terms of load etc. As examples the equations representing the workings of a chiller and a PV panel are the following:
𝐸𝑃𝑉(𝑠𝑧, ℎ, 𝑦) = 𝜂𝑃𝑉(𝑠𝑧) ∗ 𝐼𝑟𝑟(ℎ)
𝐶𝐸𝐶(𝑠𝑧, ℎ) = 𝐶𝑂𝑃𝐸𝐶(𝑠𝑧) ∗ 𝐸𝐸𝐶(𝑠𝑧, ℎ)
Where EPV(sz,h,y) is the electricity produced by a PV system, which is function of
the PV system efficiency through its model sz, and the instant solar radiation available which is expressed by Irr as a function of the hour h. And where CEC(sz,h)
function of the system itself through its COP value, and the instant electricity provided at the same time located with the hour h.
While the production of the PV system is rigidly connected to the amount of radiation available (provided as a simulation parameter), a fully schedulable component like the electric chiller is controlled by computing the variable EEC of the
electricity provided, which is bound to be between zero and the maximum cooling power that the chiller sz can provide given its technical specifications: this is expressed by means of the following equation:
0 ≤ 𝐶𝐸𝐶(𝑠𝑧, ℎ) ≤ 𝐶𝐸𝐶𝑚𝑎𝑥(𝑠𝑧)
The objective quantity to minimize, meaning the total costs sustained over the whole planning horizon, is expressed by means of the sum of two quantities: the investment cots Cinv and the operational costs Cop. The expression of the operational costs is the
following:
𝐶𝑂𝑃= ∑ ∑(𝐸𝑔𝑟𝑖𝑑(ℎ, 𝑦) ∗ 𝑐𝑔𝑟𝑖𝑑(ℎ, 𝑦) + 𝑁𝐺𝑛𝑒𝑡(ℎ, 𝑦) ∗ 𝑐𝑁𝐺(ℎ, 𝑦)) ℎ
𝑦
Where Egrid(h,y) is the electricity purchased from the local distribution grid in kWh
and cgrid(h,y) is its cost in $/kWh, which can also vary in time to represent complex
pricing schemes or changes over long time horizons. In the same way NGnet(h,y) is
the quantity of natural gas withdrawn from the distribution network and cng its cost.
For the investment costs, the equation is the following:
𝐶𝑖𝑛𝑣 = ∑ ∑ ∑(𝐶𝑠𝑦𝑠(𝑡𝑒𝑐ℎ, 𝑠𝑧, 𝑦) ∗ 𝑋𝑠𝑦𝑠(𝑡𝑒𝑐ℎ, 𝑠𝑧, 𝑦)) 𝑦
𝑠𝑧 𝑡𝑒𝑐ℎ
Where Csys(tech,sz,y) indicates the cost of a generic system, which is a function of
tech, indicating the type of technology (whether a chiller or a boiler), sz indicating its size (among the ones in consideration for the given technology tech) and y indicating the year, for the technologies that exhibit a change in costs over the
planning horizon. The investment in the system is controlled by means of the binary variable Xsys that depends on the same set of conditions.
The objective of the optimization is then to minimize the total costs: 𝐶𝑡𝑜𝑡= 𝐶𝑂𝑃+ 𝐶𝑖𝑛𝑣
The whole optimization problem is split up in two sub problems, solving respectively the strategic and the operational phases described by the two timescales, with both the two problems providing a distinct contribution to total costs, which is ultimately the quantity to be minimized by the algorithm.
Synthetically, the heuristic algorithm shown in Figure 4 acts as follows:
• By solving the problem M a first trial design is obtained following a criteria based on the total amount of demand per energy vector over the multi-decade timespan. Such design returns a set of technologies which are purchased to hopefully meet such demands, this by following a simple conversion equation modeling the workings of the technologies. Then, by consequence an approximation of the total costs (both investment and operational) sustained is also returned.
• The design obtained from the solution of problem M is then fed into the problem
Mh where it’s tested on the hourly resolution timespan of the slices obtained as
indicated in the previous paragraph, thus linking the two phases. The solution obtained in this phase can then be both feasible and unfeasible, in the case the technologies configuration can’t actually meet the demands on an hourly basis. In case the solution is unfeasible an unmet demand quantity is computed and used as a feedback for the next round of M.
The algorithms then proceeds in solving the two phases iteratively until a predefined stopping criterion is met, at that point the solution that achieved the lowest cost is chosen as optimal.
Figure 4 - Workflow of the optimization problem solving algorithm
2.3.4 Case study characterization
The test case, which is a realistic residential district, has been modeled by aggregating the demands of 150 households from the already mentioned open dataset [60], and obtaining the relative demands (for electricity, space cooling and space heating) and the available radiation for a whole year with hourly resolution, thus recreating a realistic simulated year for the whole district. The question that the proposed approach aims at solving is the convenience in purchasing a battery system for the district, thus a pivotal importance lies in the presence of a non schedulable energy production system. Given that the real district already shows a heavy presence of PV systems, its the capacity is left unaltered.
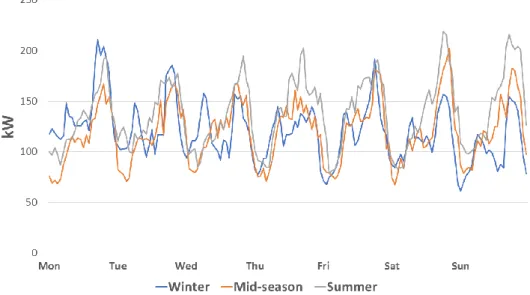
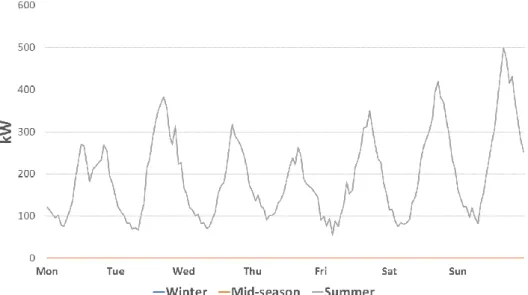
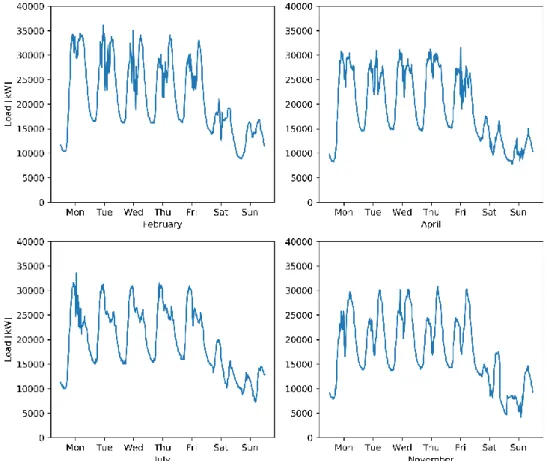
Once the energy demands are retrieved from the open dataset, those are then fed to the clustering procedure in order to sample 6 representative weeks. In the following Figures the energy demands for the three commodities (electricity, space heating and space cooling) are shown for three of the sampled weeks: a summer, a winter and a mid-season one. Figure 5 shows the electricity demand, Figure 6 the heating demand and Figure 7 the cooling demand in kW for a period of one week.
Figure 5 - Electricity demand of three sampled weeks
Figure 7 - Cooling demand of three sampled weeks
As explained the PV system size is given as an optimization parameter and amounts to around 250 kWp, the system will then produce electricity depending on the solar radiation that is available in the actual hourly timestep. The hourly radiation is also given as a simulation parameter according to the sampled weeks, for the same weeks as in the previous figures the electricity production from the PV system is shown in Figure 8.
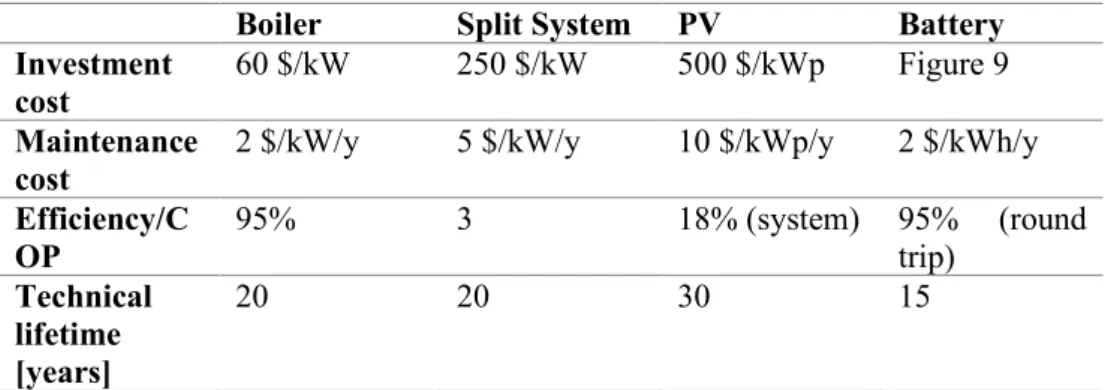
Finally the costs for the systems involved need to be characterized. The systems which are considered in the analysis are the following:
• A PV system, which size is given as an input to begin with • A natural gas boiler to meet the heating demand
• An electric split system to meet the cooling demand
• A battery system to use locally the surplus from the PV panels instead of feeding it to the grid
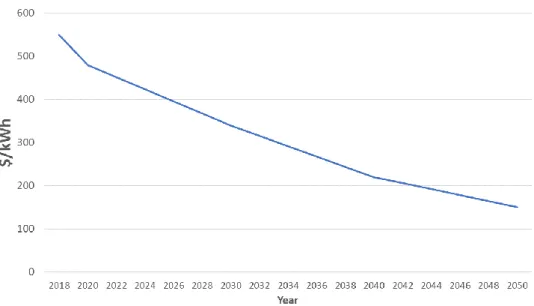
As explained the goal of the analysis is to evaluate a potential investment in batteries considering the cost which is dropping in time, such drop in costs has been determined following the estimations in [64] and it’s shown in Figure 9 for the desired planning horizon. The rest of the technical parameters used in the simulations are shown in Table 1.
Lastly the ageing of the PV system is also simulated by considering a drop in performance (being its system efficiency) of 0.3% per year; this given the relative importance that the phenomenon could have in a long time horizon due to the direct relationship of the output of the PV system, which ultimately drives the need to adopt a battery system.
Boiler Split System PV Battery Investment
cost
60 $/kW 250 $/kW 500 $/kWp Figure 9
Maintenance cost
2 $/kW/y 5 $/kW/y 10 $/kWp/y 2 $/kWh/y
Efficiency/C OP 95% 3 18% (system) 95% (round trip) Technical lifetime [years] 20 20 30 15
Figure 9 - Simulated drop in battery costs over the planning horizon
Also as anticipated the investment in the battery system is evaluated under different feed-in tariff compensation schemes, because it is expected that the investment in a battery system would make more sense with a smaller compensation from the local distributor for the electricity surplus. Thus while the purchase of electricity from the local grid is kept constant at 0.08 $/kWh the feed in tariff is set to drop from 0.04 $/kWh to 0.02 $/kWh with incremental steps of -0.0025 $/kWh.
2.4 Results
The obtained results entail the optimal design for the residential district over the planning horizon of 32 years. This includes as expected a boiler and a split system to meet respectively the demands of heating and cooling. However, focusing on the battery system this is not chosen by the algorithm in any of the scenarios. This means that even by considering the lowering costs a battery system adequate to absorb the surplus would still be more costly than feeding back such surplus into the main grid, even with a lowering feed-in tariff compensation. This is also to be ascribed to the performance losses of the PV system of the course of the planning horizon.
In order to test the correctness of the approach an additional test has been run by forcing the presence of a small battery storage system (50kWh of capacity with 25 kW of charging and discharging power) in the district. All of the results are shown in Table 2 indicating the total costs sustained over the planning horizon in order to meet the demands of the district. These are reported in two columns: the C* column indicating the total costs without the purchase of a battery imposed, and the CB where
this happens. FIT [$/kWh] C∗ [k$] CB[k$] 0.02 5745.61 5785.39 0.025 5745.12 5785.19 0.03 5744.64 5785.00 0.035 5744.15 5784.80 0.04 5743.67 5784.60
Table 2 - Results of the experiments
A shown in Table 1 the solution that forces the presence of the battery is actually not very far in terms of life cycle costs from the one that just relies on feeding the electricity into the local grid, having on average a 0.7 % discrepancy between the two. This appears then to be very tightly related to the chosen test case, and it’s reasonable to think that the battery would actually have been an appropriate investment with small changes to some of the input parameters, as for example the size of the PV system, or a different tariff scheme agreed with the local grid (also for purchasing). As an additional proof of the validity of the battery solutions CB and more in general of the computations performed by the algorithm the dispatch strategy of one of the solutions for the battery cases is show in Figure 10.
Even given the relative simplicity of the test case and the assumptions made it is already possible to gain some insights from the results. Under the current circumstances the district would find itself feeding the electricity surplus to the local grid, which could ultimately lead to a lesser carbon footprint from a larger system perspective. Assuming that the choices on which technologies to adopt by the users would be probably driven by an economic criterion (as the one represented by the objective function of the problem) the policy insight to gain by a potential local utility really lies on whether the feeding of such electricity in the local grid is actually bearable.
However it has to be considered that decision could change easily for example in the case of adoption of electric vehicles by the users in the district.
Figure 10 - Dispatch strategy of a battery case
All the simulations shown in Table 1 require a total of around 50 seconds to run on a moderately performant workstation (Intel Core i7 2.9 GHz with 16Gb RAM), which is actually a very short amount of time. The analysis could then be surely increased in terms of considered parameters and scenarios in order to have a more comprehensive approach to the decision making process.
2.5 Conclusions
In this chapter we presented a novel methodology for assessing the impact of parameters changing in time in the optimal design of distributed energy systems, where the time horizon of interest is the lifespan of a realistic urban district. Specifically the proposed approach wishes to correctly consider the changing capital costs while defining the optimal design of a system over a very long planning horizon of multiple decades.
This was achieved by defining a framework based on an optimization problem, which is solved with a novel ad-hoc heuristic algorithm that aims at minimizing the total costs sustained in meeting a set of energy demands of the local user. In doing so both the possibility of acquiring commodities (natural gas/electricity) from local distribution infrastructures and the purchase and deployment of new energy systems is considered.
The approach is tested on a realistic test case but by referring to an open dataset containing real measured consumption data from a set of households, with the decision under analysis being the potential purchase of an electric storage system (batteries) to handle the surplus of renewable generated electricity, considering also a projected drop in costs over the planning horizon. The investment is to be evaluated in a scenario where a feed-in tariff for the surplus electricity is in place, and the compensation for the tariff is set to decrease progressively. Furtherly the ageing of the PV system generating the electricity surplus is taken into account by imposing a fixed drop in performance per each year.
The results show that for the proposed test case a battery system is not an good investment, even if not so distant from the proposed solution of feeding the surplus electricity into the local grid in exchange for a feed-in tariff compensation. This can be ascribed to a set of factors; from the relative gap between the demands of the district and the size of the PV system which don’t allow for an adequate electricity surplus, to the drop in performance of the PV system itself.
Chapter 3.
A methodological approach to improve the
results of simulations of high renewable
penetration local energy systems
3.1 Preface to chapter 3
The work described in this chapter aims at proposing an innovative approach to the analysis of urban districts which show an high penetration of non programmable renewable energy sources, and other sources of uncertainty such as user demands of different nature. In particular the goal is to obtain insights regarding how to deal with such large amount of electricity surplus form renewable source by using different technological approaches. This by considering both already established technologies like an electric heat pump and a thermal energy storage, and also a potential fleet of EVs equipped with smart charging. The evaluation is achieved by means of a framework based on the simulation model EnergyPLAN, where a real local energy system is analyzed and three different sources of uncertainty are considered: the availability of the solar resource and the demands of the users in terms of heating and electric mobility. Specifically the energy system is the small town of Osimo in Italy, about which the local municipality company of Astea kindly provided accurate measured data for the year 2018. The focus is put on the multiple needs of the local energy system within a proper smart energy system paradigm and the evaluation is undertook by considering only technical simulations which balance energy fluxes of different kind over a one year period, without taking into account the economics implied in doing so.
In this work I entirely undertook the work concerned in designing the framework, the modeling activities, the coding and the necessary elaborations on the provided raw data. Professors Poul Alberg Østergaard and Gabriele Comodi contributed with comments and editorial assistance.
3.2 Introduction and state of the art
As anticipated in the introduction uncertainty will play a key role in the future’s energy systems, and a proper characterization and consideration in energy models will then become compulsory [37]. An approach relying on a limited amount of time slices might in fact lead to under/over estimations of several features while analyzing energy systems. For this reasons the following framework is proposed to handle a great degree of inputs, representing many sources of variability in the input parameters (some with an arbitrary variations and others with a proper stochastic feature representation), and still returning useful results in a very short amount of time thanks to the fast simulation capabilities of the EnergyPLAN model, which is developed by the Department of Planning at Aalborg University, and it can be obtained as a free software package with a graphical user interface. Within the available literature the EnergyPLAN simulation model has already been coupled with externally developed code in order to enhance its capabilities, as in [54] where an optimization model for a national scale system is proposed.
As highlighted in [65] the EnergyPLAN model has been used mostly to analyze country/state level scenarios, and in a minor way local areas. By narrowing such studies to a municipality/town scale (the one of interest in this chapter) there are examples for different scenarios in Europe: in Denmark for the cities of Aalborg [66][67] and Frederikshavn [68][69], in Finland for the city of Loviisa [70], and finally in Italy for the cities of Corinaldo [71] and Altavilla Silentina [72]. In the mentioned studies a set of technological solutions is evaluated in the respective realistic scenarios with the aim of mitigating the environmental impact by means of different technological solutions: such as the increase of RES or the incentivation of CHP.
What’s lacking is a focus on the potential beneficial impact of smart EVs in such high RES shares systems. This has been done already in some studies focusing on national/regional scale system: in [73] the integration of EVs on a national scale in Italy is investigated considering increasing shares of solar powered RES, but there is also a lot of interest regarding the integration of EVs in local energy systems, especially while in presence of significant RES penetration. Such as in [74] for a single building scale energy system, a large city in [75] or a neighborhood in [76], where the integration of EVs is evaluated in conjunction with the electrification of a DHN.
All of the described models use a perfect foresight approach to the input parameters, thus not considering the stochastic nature of some of the input parameters, and this is what the work described in this chapter aims at doing. The framework which is proposed aims at analyzing such systems by considering both the uncertainties entailed in the available yield from the solar systems and the ones regarding some of the user demands, in both cases by considering the time varying nature of the two quantities.
Specifically the proposed approach is tested on a realistic test case representing a small town, which can be described by means of real measured data provided by the local municipal energy company. A first investigation on the potential deployment of EVs in same town has been done in [77], where the payback of the investment in an urban charging infrastructure by the same company is evaluated and found to be short even without incentives.
The rest of the chapter is structured as follows: in 3.3 all of the proposed framework is described explaining in detail all of the available data and the modeling approaches used for each source of uncertainty, in 3.4 the results of a set of simulations are shown, where the goal is to investigate low carbon options for the local energy system, finally in 3.5 the conclusions to the chapter are drawn.
3.3 Methodology
3.3.1 The framework at a glance
As for the work described in the previous chapter this one also proposed a complex framework, which is shown in Figure 11. While previously the modeling of the energy systems was implemented by a directly coded mathematical model, in this case it is delegated to the EnergyPLAN model. EnergyPLAN is capable of simulating the operation of very complex single-node (thus no spatial dimension representation) multi energy systems over the course of a year with an hourly temporal discretization. The simulations can be executed both by means of a graphical user interface or through a command line, and in both cases the input parameters are passed on to the model by means of plain text files.
For this reason the rest of the framework, which is entirely based on the python programming language, acts as a shell that elaborates a set of inputs, provides them
to the EnergyPLAN model and retrieves the quantities of interest into tables once the model is launched externally .
The framework is constituted of a set of blocks, where each serves a specific function. While an extensive description of each block is done in the following paragraphs a brief description of each block/functional part is the following: • A block that retrives solar radiation, temperature and other weather data with
hourly resolution for the location of interest from an external web-based open model
• A set of data provided by the Osimo municipality’s owned company Astea, regarding user demands, energy flows with the national transmission grid etc, measured for the full year of 2018 with hourly resolution.
• A block to build realistic EV load patterns with hourly resolution, based both on data retrievable from open datasets and a set of technical assumptions
• A demand regression block, intended to combine both the available consumption data and the simulated historical metereological data into a set of plausible yearly demand curves with hourly resolution, by using a regression model
• A block that combines all of the available data into a set of realistic yearly profiles to represent variability in the simulation conditions, and therefore into a set of simulations to run
• A python based EnergyPLAN parser, that feeds all of the plausible years to the simulation engine and simulates them automatically by means of scripting • A block to retrieve the results of the simulations (which are formatted into tables)
3.3.2 Model of the Osimo municipality in EnergyPLAN
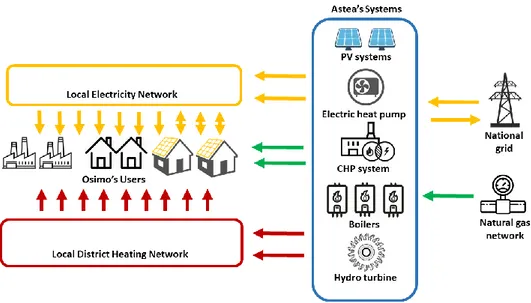
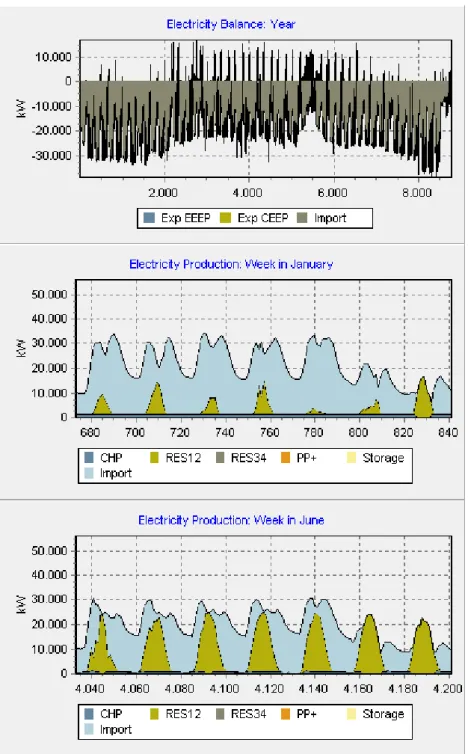
Astea is the Osimo’s municipality energy company, and it’s in charge of managing a district heating network (DHN) , the two way power exchanges with the main transmission grid operated by Enel, and the inflow of natural gas. The DHN is powered by three different systems: a CHP system powered by a natural gas engine (1.2 MWe in size), three natural gas boilers and a small electric high temperature heat pump (34.5 kWe). On the electricity side within the local grid are present a set of distributed generation systems: the already mentioned CHP system, a small hydroelectric turbine, a set of PV systems operated directly by Astea (80.4 kWp in total) and a large amount of privately owned PV systems (estimated to around 31 MWp in size). A graphical representation of all of the systems is shown in Figure 12.
Figure 12 - Schematization of Osimo's distributed energy systems configuration The data provided by Astea can then be listed as follows:
• A year of electricity production from the directly monitored PV systems for the year 2018, monitored with hourly resolution in terms of average capacity factor. As in Figure 13.
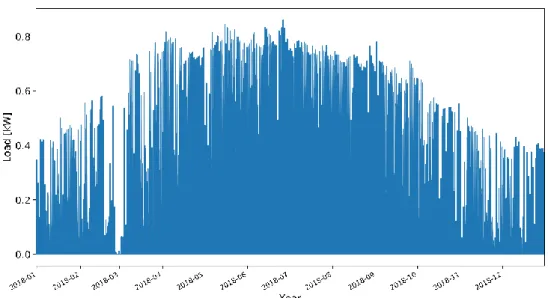
• A year of thermal energy fed into the local district heating network for the year 2018, measured in terms of waterflow and inlet/outlet temperatures with hourly resolution. As in Figure 14.
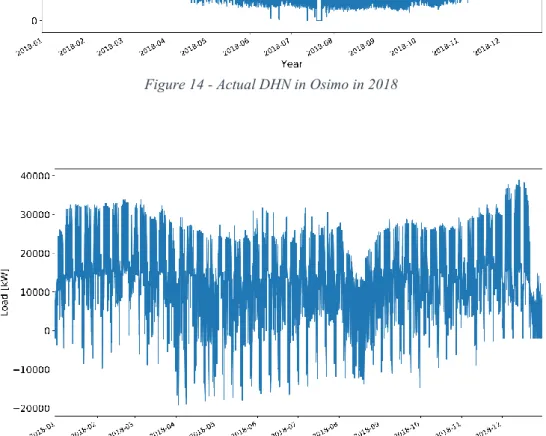
• Net electricity exchanges with the main national grid (both energy withdrawn and fed) for the year 2018, measured with hourly resolution. As in Figure 15. • Capacity and average electric and thermal efficiencies for the CHP system
(natural gas fired).
1.2 MWe with 39.9% and 41.5% electric and thermal efficiencies respectively • Capacity and average thermal efficiencies for the boiler systems (natural gas
fired).
13.5 MWt with 95% thermal efficiency.
• Capacity and average conversion efficiency (COP) for the electric heat pump. 34.8 kWe with 4.6 average COP
• Size of the PV system owned by Astea and estimate on the total size of the privately owned systems.
80.4 kWp and 31 MWp respectively
Figure 14 - Actual DHN in Osimo in 2018