UNIVERSITA’ DEGLI STUDI DI ROMA
“TOR VERGATA”
FACOLTA’ DI SCIENZE MATEMATICHE, FISICHE E NATURALI
DOTTORATO DI RICERCA IN
BIOLOGIA EVOLUZIONISTICA ED ECOLOGIA
CICLO XXII
HLA
DQ
AND
ONCHOCERCIASIS
IN
ECUADOR:
INTERACTIONS
BETWEEN
GENETICS
AND
ENVIRONMENT
IN
AN
ENDEMIC
INFECTION
Ph.D. Thesis
Flavio De Angelis
A.A. 2009/2010
Docente Guida/Supervisor: Prof. Gian Franco De Stefano
Coordinatore: Prof. Patrizia B. Albertano
INDEX
1. INTRODUCTION p.1
1.1 Introduction p.1
1.2 Onchocerca volvulus – life cycle and transmission p.4
1.3 The disease p.5
1.4 Distribution in the Americas p.7
1.5 Treatment p.8
1.6 APOC and OEPA p.9
1.7 HLA p.12
1.8 HLA class II p.16 1.9 Use of SNPs as predictive markers p.18 2. MATERIAL AND METHODS p.21 2.1 Material and methods p.21
2.2 SSO p.30
2.3 SSP p.31
2.4 SNP typing p.31
3. RESULTS p.35 3.1 Examples of the results p.35
3.2 Families p.37 3.3 Afroecuadorians p.47 3.4 Cayapas p.54 3.5 Tsachilas p.60 3.6 Bamileke p.63 4. DISCUSSION p.67 4.1 Families p.67 4.2 Population analysis p.70
4.2.1 Cayapas p.70 4.2.2 Afroecuadorians p.73 4.2.3 Comparative analysis with available populations p.79 4.2.4 Attempt of phylogenetic analysis p.86 5. CONCLUDING REMARKS p.91
6. REFERENCES p.93
1
1. INTRODUCTION
1.1 Introduction
Advances in human population genetics and comparative genomics have resulted in important contributions to our understanding of human genetic diversity and adaptation. For the first time, we are able to reliably detect the signature of natural selection from patterns of DNA polymorphisms. The identification of the effects of this evolutionary force provides crucial evidence to support hypotheses of human adaptation (Harris & Meyer, 2006).
This process likely occurred at two temporal levels: the first corresponds to human evolution from the time of separation from the chimpanzee common trunk to the development of anatomically modern humans (Jobling et al., 2003); at the second level, human populations under environmental pressure were subjected to micro-differentiation and adaptation to a wide variety of environmental situations.
These adaptation processes can be divided into two major categories: non-genetic and genetic. The modifications related to non-genetic adaptations like physiological, biochemical and behavioral ones are the individuals’ response to changes in their actual habitats (Baker, 1988). Conversely, to demonstrate genetic adaptations, it is necessary to acquire evidence showing that natural selection has driven the evolution of particular features (Harrison, 1988).
The establishment of natural selection may be provided by different kinds and weights of evidence: we can refer to differential fertility or mortality rates associated with a particular genetic trait; in vitro or in vivo studies related to functional differences among genotypes; or even evidence of concordance in relation to the geographical distribution of some trait as a function of environmental factors that could represent a selective force (Harris & Meyer, 2006).
The actual development of comparative genomics and population genetics together with the refinement of theories of molecular evolution allowed an acceleration in the collection of new data and methodological approaches useful to effectively test assumptions related to natural selection and human adaptation, and to check specific
2
hypotheses concerning to the role of natural selection in shaping human genetic variation (Nielsen, 2005).
The understanding of natural selection from genetic data is not so simple: difficulty lies in the ability to detect traces of selection from the "noise" represented by the demographic history of our species. Phenomena such as expansion and/or separations and bottlenecks of course were influential in determining the genetic variability of the human gene pool up to now (Cavalli-Sforza et al., 1994).
The purpose of this PhD research is to test one of these theoretical assumptions through the study of response to infection by an environmental pathogen in two different ethnic origin communities located in marginal refuge areas of Esmeraldas province, in northwestern Ecuador.
The notion that selection during epidemics or longer periods of exposure to infectious diseases might play a major effect in modifying the constitution of the human genome is not new. It was proposed, at least in outline, in 1931: in his research, The Inborn Factors in Disease (Garrod, 1989), Garrod suggested that infectious diseases may have been a major selective force in human evolution and in shaping our biochemical individuality. In 1948, Haldane, (Haldane, 1948) suggested that the extremely high frequency of thalassemia in certain racial groups from the Mediterranean region might reflect an unusually high mutation rate in these populations, and he proposed that these diseases might have come under intense selection because of the heterozygote advantage against malaria. It was, in effect, Haldane’s remarkable insight that opened up investigation of genetic susceptibility to infection.
Clearly, an analysis of the human genome with respect to variable susceptibility to infection is already beginning to provide important new insights into the mechanisms of human diversity.
Although less progress has been made than in the case of malaria, there is increasing evidence that variability in host responsiveness to other parasitic infections may have a strong genetic basis (Hill 1996).
Recent studies have shown that host genetics is an important determinant of the intensity of infection and morbidity due to helminthes. There is some evidence for
3
genetic control of filarial infection, although only few data have been reported about filarial disease. Association studies have provided evidence for major histocompatibility complex control of pathology in schistosomiasis and onchocerciasis (Hirayama et al., 1987). Recent candidate gene studies suggest a key role of other immune response genes in controlling helminth infection and pathology, but require replication. Identification of the genetic loci involved may be important in the understanding of helminth epidemiology and the mechanisms of resistance and pathology.
There have been a large number of studies of the genetic basis of susceptibility to helminth infection, principally murine studies using inbred and congenic mouse strains, or Human Leukocyte Antigen (HLA) association studies in human populations (Wakelin, 1988). However, despite the clear demonstration of genetic control in mouse models, both the importance of genetic control in humans, and the disease loci involved, had received little attention until recently.
Onchocerciasis, also known as river blindness, is caused by a nematode filarial worm that causes blindness and debilitating skin lesions. The disease occurs in 37 countries, of which 30 are in Africa, 6 in the Americas and 1 in the Arabian Peninsula. Africa is by far the most affected continent both in terms of the extent of the distribution and the severity of the clinical manifestations of the disease. Onchocerciasis remains a major parasitic endemic disease especially in Central and East Africa. The latest World Health Organization (WHO) Expert Committee on Onchocerciasis estimated that in 1995 around 17.7 million persons were infected, about 270000 of whom were blind and another 500000 severely visually impaired (WHO, 1995). Over 99% of the estimated 17.7 million persons affected with this filarial parasite live in Africa, while about 140 000 people in the Americas are infected with the worm. The disease is responsible for 1 million disability-adjusted life years (DALYs) annually. Onchocerciasis is one of the most important worldwide infectious causes of blindness, being second only to trachoma in number of affected persons (Thylefors et al., 1995; Lewalen and Courtright, 2001). Eye disease from onchocerciasis therefore represents the main public health challenge, accounting for 40% of the attributable DALYs, although severe skin disease is also
4
recognized as significant to public health (Hagan, 1998). Great progress has been made in the last three decades to control onchocerciasis, both in Africa and in the Americas, and this progress has been largely due to international public–private partnerships, regional programmes, sustained financing and the development of new tools and technology.
1.2 Onchocerca volvulus - Life Cycle and Transmission
The parasite, Onchocerca volvulus, is transmitted by small blackflies of the genus
Simulium (Figure 1.1), which breed in fast-flowing, highly oxygenated rivers
(Blacklock, 1926).
Figure 1.1 : Simulium exiguum
An infected blackfly deposits one or more O. volvulus larvae into the human host when it takes a blood meal. These larvae develop into mature adult worms in about one year. They commonly aggregate into fibrous nodules that lie under the skin, usually over bony prominences. The adult female has a mean life span of 12–15 years, with a reproductive life span of about 9 to 11 years (Habbema et al., 1992). The female is viviparous, releasing millions of embryos called microfilariae (mfs), which themselves live for about two years. The mfs that are released by the adult worm migrate from the nodules to the dermal layers throughout the body where they can be taken up by blackflies during a blood feeding act. The mfs develop into infective larvae in the Simulium from which they can be deposited in another host with a subsequent bite, thus completing the life cycle (Figure 1.2) of the parasite and transmitting the infection. O. volvulus develops only in humans and has no animal reservoir.
1.3 The d Clinical m adult wor in the tiss dermatiti papules m destructio dermatiti papules itching’’) 1998; WH disease manifestations rms begin to sues that prese
s (APOD, a must be at le on of the skin s (CPOD, a s that are at ) is one of the HO, 1995). Figure 1.2: s of onchocerc produce mfs. ent as intense solid, scatter east 1mm. M n crease due to scattered, pru least 3mm.) e most import
5
life cycle of O ciasis occur 1 Dead mfs pr skin irritation ed, pruritic, p May have veso edema.) (Fig uritic, hyperpig (Figure 1.4) tant symptom O. volvulus to 3 years aft rovoke host in n and lesions o papular rash. sicles or pustu gure1.3) and c gmented and ). Severe pru ms of onchocer ter infection, w nflammatory r of acute papul The diamete ules at the a chronic papula flat-topped r uritus (‘‘trou rciasis (Brieg when the reactions ar oncho er of the apex and ar oncho ash with ublesome ger et al.,
6
Figure 1.3 : Vesicles or pustules on the skin
Figure 1.4 : Hyperpigmented and flat-topped rash with papules
Mfs can migrate from the skin to the eyes and cause ocular morbidity (Hall and Pearlman, 1999; Pearlman and Hall, 2000). Visual loss from acute and chronic ocular disease of both the anterior (sclerosing keratitis, irido-cyclitis) and posterior segments (optic atrophy, choroido-retinitis) occurs. In the most severe cases, blindness in one or both eyes occurs. Recent evidence suggests Wolbachia endobacteria (symbionts of arthropods and filarial nematodes) contain lipopolysaccharides that are released with the death of mfs and contribute to the inflammatory pathology associated with the disease (Taylor and Hoerauf, 1999; Saint Andre´ et al., 2002; Taylor et al., 2005).
1.4 Distr In the Am Colombia The disea molecula establishe volvulus Rodolfo R Ocular pa foci, espe is now manifesta The foci Rio Caya endemic of 51.1% in the va Province, with an a the other hypoende ribution in the mericas, onch a, Ecuador, Gu Figu ase was introd ar studies ind ed in the Am infection wa Robles near th athology attrib ecially souther rare to none ations in the re of onchocerci apas and Rio areas around % of the popula arious regions , two levels o average preval r foci, with emic areas (Gu
e Americas hocerciasis oc uatemala, Me ure 1.5 : Amer duced into th dicate that i mericas. In fa as not recogn he turn of the butable to onc rn Venezuela, existent: skin egion. iasis in the Ec o Santiago (G Rio Cayapas ation. The mic s. Based on t of endemicity lence rate of 6 an average uderian et al.,
7
curs in 13 di exico, and Venrican onchocer e region by th t was the s act, the linkag nized initially last century (K chocerciasis st , Ecuador and n disease and cuadorian Pro Guderian et and its tributa crofilarial infe the prevalenc were apparen 69.1% was fou prevalence 1983; Guderi screte foci in nezuela (Figur rciasis foci in he slave trade savanna blind ge between o y in Africa, b
Kluxen & Hoe till occurs in m d Brazil (Botto d pruritus ar ovince of Esm al., 1983). T aries, with an fection rate ran ce studies of nt: the upper r und to be a hy rate of 15.6 ian et al., 198 six countries re 1.5). red e (Collins, 19 ding strain t ocular disease but in Guate erauf , 2008) many of the A o, 1999), but b re the major meraldas are lo There were 1 average infec nged from 0% onchocerciasi region of Rio yperendemic 6% were co 9). s: Brazil, 992), and that was e and O. mala by American blindness clinical ocated on 1 major ction rate % to 85% is in the Cayapas area. All onsidered
8
1.5 TreatmentUntil the 1980s only two drugs, suramin and diethylcarbamazine (DEC) were available for the treatment of onchocerciasis (WHO, 1987). Suramin is macrofilaricidal and has been successfully used in limited mass treatment (Rougemont et al., 1980, 1984), but its toxicity (damage to the kidneys) and the difficulties associated with its mode of administration (repeated injections for several weeks) have limited its usefulness for both individual and large-scale treatment (Awadzi et al., 1980 and 2003). Diethylcarbamazine (DEC) has only microfilaricidal action, has to be given over several days, and frequently produces severe adverse reactions such as fever, headache, rash, and oedema (the so-called ‘‘Mazzotti’’ reaction), especially in heavily infected people (Awadzi, 1980). DEC can also rapidly advance onchocercal eye disease leading to irreversible ocular damage. Accordingly, neither drug is recommended for routine onchocerciasis treatment or community control activities (WHO, 1995). Given the lack of an appropriate drug, which was suitable for mass treatment or field use in the 1980s, most of those infected could not be treated, and the risk of developing eye lesions and subsequently blindness and/or skin manifestations from the infection was very concrete.
Ivermectin (Mectizans, Merck & Co.) is a semisynthetic macrocyclic lactone (Figure 1.6) derived from Streptomyces avermitilis, which was registered for the treatment of human onchocerciasis in October 1987 in France.
9
Ivermectin was the first microfilaricide suitable for large-scale onchocerciasis treatment (Awadzi et al., 1985; De Sole et al., 1989; Remme et al., 1989; Prod’hon et al., 1991; Whitworth et al., 1991; Collins et al., 1992). Donated free by Merck & Co. Inc. for as long as needed, the oral medication is safe and effective when given at the standard dose of 150 mg/ kg body weight. Relative to DEC, its adverse effects are mild and non-ocular (Brown and Neu, 1990). One important characteristic is that despite its short half-life, a single dose provides long-lasting suppression of microfilaridermia (Greene et al., 1985), which makes it particularly suitable for community-based distribution in developing countries. Since the early 1990s, ivermectin has not only become the principal drug for the treatment and control of onchocerciasis, but the donation of the medicine by Merck & Co. Inc. has also opened the way for mass presumptive treatment for all those living in hyper and meso-endemic areas. A practical and easier method in which the treatment is given on the basis of height, a good surrogate for the weight of an individual (Alexander et al., 1983), has replaced the need to weigh people before treatment. This easy method allowed the distribution of ivermectin to be undertaken by communities themselves through an approach known as Community Directed Treatment with Ivermectin (CDTI). CDTI represents the philosophy of primary health care in communities to encourage responsibility for organizing their own distribution of ivermectin, which is provided to the community free of charge. Ivermectin is always available in the communities to be given at a later time to those who might have been absent, sick, or unavailable during the chosen period. Cost of delivery is therefore reduced considerably.
1.6 APOC and OEPA
Landmarks in the global control of onchocerciasis include the significant success of the Onchocerciasis Control Programme (OCP) of West Africa (1975–2002), which is held as one of the great triumphs of tropical public health, and the donation of ivermectin (Mectizans) by Merck & Co. Inc., in 1988.
Two regional programmes based primarily on ivermectin treatment are the African Programme for Onchocerciasis Control (APOC) and the Onchocerciasis Elimination
10
Program for the Americas (OEPA) (WHO, 1995). The objective of APOC is similar to that of the OCP: the control of onchocerciasis to a point where it is no longer a disease of public health importance through establishment of sustainable delivery mechanisms. In the 19 APOC countries, ivermectin is distributed annually in areas where the nodule prevalence exceeds 20% (which corresponds to an mf prevalence of between 35% and 40%). The key to the evaluations of APOC is the integration of activities into the primary health care system to support distribution, as well as the continued political will and local financing for onchocerciasis control activities. The impact of the control effort is also measured in changes in the prevalence and incidence of ocular onchocerciasis and reactive onchocercal dermatitis, as well as troublesome itching (WHO, 1995).
The objective of the OEPA programme is the regional elimination of onchocerciasis, with the assumption that at some point in time ivermectin distribution will cease. WHO estimated 140 000 persons to be infected and 4.7 million to be at risk in 1995, but most at-risk population estimates are much lower now, at 500 000 persons. Over 95% of those at risk reside in Mexico, Guatemala, Ecuador and Venezuela. Studies in the Americas in the late 1980s and early 1990s using twice yearly mass treatment with ivermectin demonstrated that transmission could be interrupted in Guatemala and Ecuador. These findings helped promote a Pan American Health Organization resolution in 1991 for a coordinated regional strategy based on intensive mass ivermectin treatment in all endemic areas (including hypoendemic areas) with the objective of eliminating not only all disease manifestations but, wherever possible, transmission (Blanks et al., 1998). Key to this decision were the entomological and epidemiological characteristics of onchocerciasis in the region. Many of the American Simulium vector species are inefficient vectors, and sustained transmission requires high vector densities and heavy mf skin densities in infected populations. In most areas, health systems are sufficiently strong to be capable of delivering twice yearly treatments so that mf skin loads could be maintained at a level low enough to stop transmission. Both APOC and OEPA programmes use baseline and post-treatment epidemiological, entomological, and ophthalmological data from sentinel areas to measure the impact of the effort.
11
Differences have been described in the clinical manifestation of the disease between Africa and America (Woodruff et al., 1966). However, to date, it has not been possible to associate these differences with specific factors. The study of two ethnically well-differentiated populations who were scattered in the same extreme environment and exposed to the same selective factors may provide an opportunity to clarify this speculation. The populations involved in this research are a native indigenous population, the Cayapa Indians or Chachi, and one that traces its origin back to the 17th century African slave trade, the Afroecuadorians.
Both populations are co-resident in a marginal tropical forest area that characterizes the inner part of the province of Esmeraldas, in the northwest of Ecuador, known to be a hyperendemic zone for onchocerciasis (Guderian et al., 1989).
In Ecuador, the first evaluation of onchocerciasis was carried out in 1980 when the infection was confirmed in an Afroecuadorian male from the Province of Esmeraldas.
Several studies developed in the Rio Cayapa basin found that the prevalence and intensity of the disease were proportional to the frequency of vector/man (Guderian et al. 1988; Guderian et al., 1983).
This study also verified that the prevalence of infection among the indigenous population and that the population of African origin was virtually identical. Nevertheless, it was possible to highlight some quite important differences: first, among Cayapas, the disease seemed to show increased virulence and manifested itself with a heavier microfilaremic load than among Afroecuadorians. Beyond that, there have been significant differences in how the disease was displayed in these two populations: the dermal onchocerciasis is much more frequent in the population of African origin than in the indigenous one.
It is clear that the two populations react differently to infection, and this may be shown by the different topographical locations of the onchocercal nodules on the body surface. Among Cayapas, the nodules are predominantly located in the nuchal region and on the iliac crest, while among Afroecuadorians the distribution is mainly sacro-coccygeal.
Regardin exclusive commonl Therefore differenti backgrou difference specific a demonstr 1997) and 1.7 HLA For HLA (Figure 1 pairs), wh HLA clas by a vari products informati ng eye patho ely in the a ly found in the e it seems rea ial susceptibil unds may have
es can be exp alleles of HLA rated by other d elephantiasi A A we refer to a 1.7), in a regi hile the gene ss I, is located iety of cells i
of these gene ions are provid
F ology, in Ca anterior cham e posterior cha asonable to as ity to infectio e significantly plained by pa A genes of the r parasitic dis is (Chan et al., highly polym ion of about for β2-micro d on chromos involved in th es are used to ded by Abbas Figure 1.7 : L
12
ayapas the mber, while a amber (Guder ssume that, w on by O. volvu y different cli articular genet e Major Histo seases such as , 1987). morphic region one hundred oglobulin, a p some 15. The he immune re present antige s et al., 2002). Localization of microfilariae among Afroe rian et al., 198 ith respect to ulus, populatio inical presenta tic factors, su ocompatibility s schistosomi n on the short genes (2-3 c olypeptide ch HLA gene p esponse to pr ens to T lymp f HLA region are located ecuadorians t 89). clinical respo ons of differen ations. Furth uch as the pre y Complex (M asis (Hirayam arm of chrom cM, about 4x hain constant products are ex rotein antigen phocytes (All t d almost they are onse and nt ethnic her, these esence of MHC), as ma et al., mosome 6 106 base binds of xpressed s, as the the HLAHLA mo structures and II), d response HLA cla Class I m present a present " proteins o Presentat contained CTLs is a chains, a olecules are c s and roles, a determines th (CD8 + and C ass I proteins molecules are antigens to cyt endogenous" or tumor prote tion of such an d, could sprea advantageous a heavy chain classified as and the associ
he type of T CD4 +, respec are encoded found on vir totoxic T-cell antigens: an e eins (Figure 1 Figure 1. ntigens would ad throughout s to the body n (transmembr
13
class I and ation of antig lymphocytes ctively). by the gene rtually every ls (CTLs) (the endogenous a .8). 8 : roleof HLA d indicate inte t the body. H as a whole. C rane polypeptclass II. Eac gens with the s involved in s HLA-A, HL cell in the h e CD8+ T Ce antigen might A class I ernal cellular Hence, destruc Class I molecu tide) coded b ch class has type of HLA the specific LA-B, and H uman body, a ell). Class I m be fragments alterations th ction of these
ules are made by the genes different A (class I immune HLA-Cw. and they molecules s of viral at, if not cells by e up of 2 HLA-A,
HLA-B a polypepti HLA clas Class II macropha molecule cells that "exogeno bacterial then pres produce a and HLA-Cw, ide) (Figure 1 Figure 1.9 : S ss II proteins molecules, in ages, dendrit s present antig t activate B c ous" antigens cells or virus sented to help antibodies tha , and a light c .9). Structure and c are coded by n contrast to ic and other gens to helper cells are calle . Exogenous ses that are en
per T-cells. T at would lead t
14
chain beta-2 m cytological loc the gene as H Class I mole r "antigen-pre r T-cells (Th-ed Helper T antigens, in ndocytosed an The Th-cells, to the destruct microglobulin cation of HLA HLA-DR, HL ecules, are fo esenting cell cells) (CD4+ cells.). Class n contrast, m nd processed in turn, cou tion of the pat(a no-transm A I molecules LA-DQ, and H ound only in s" (APCs). T cells - The II molecules may be fragm by a macroph ld activate B thogen (Figure membrane HLA-DP. B-cells, Class II CD4+ T s present ments of hage and B-cells to e 1.10).
Class II m the Beta former (F F molecules con chain, the la Figure 1.11). Figure 1.11: S Figure 1.1 nsist of two tra
atter of which tructure and c
15
0 : role of HL ansmembrane h is much m cytological loc LA class II e polypeptides more polymorp cation of HLA s, the Alpha c phic compare A II molecules hain and ed to the sDifferent capability bind to an when exp antigen). Both pol response optimal m The HLA chromoso origin an frequent certain H 1.8 HLA The HLA lymphocy identify t loci: DP, D loci (D second e 1.13), the t allelic varian y to bind and ny MHC, T ce posed on the lygenism and with allelic manner, so HL A genes are omes, since e d half matern than others du HLA alleles in A class II A-D region w yte reaction, these groups u DQ, and DR DQ, DP and D xon which en e antigen bind nts for each lo present antig ells cannot res surface of a d polymorphi combinations LA can submit co-dominant: each individua nal. In humans ue to selectiv specific geog was initially d and their id using lymphot (Figure 1.12) Figure 1.12 : DR) have 5 ex ncodes the fi ing domain.
16
ocus stand ou genic protein d spond to it, gi another cell (l sm give the s that may p t a lot of diffe the protein al has HLA m s, certain HLA ve pressure tha raphic areas. defined by th dentification o toxicity techn . Organization xons: the poly irst external dut in populatio determinants: iven that it rec lymphocytes advantage o present a par erent peptides products are molecules tha A alleles or c at results in in e study of th on B lympho niques. The D of HLA loci ymorphism is domain of the
ons, each one if a peptide cognizes antig do not recog of a better ch rticular antige to T lymphoc expressed fro at are half pa ombinations a ncreased frequ he mixed allo ocytes allowe region conta mainly locate e polypeptide with the does not gens only gnize the hance to en in an cytes. om both ternal in are more uency of oantigens ed us to ins three ed at the e (Figure
The serie including character and 108 these we described with the encoded alleles ac Much res the nema (Meyer e between c of the dis found for The haplo among im Figu es HLA-DR w g 15 identifi rized by mole alleles respec ere recognized d through stud same HLA-A by a locus ou ccessible to ge search over th atode infectio et al., 1994, D certain allelic sease caused b r the distribut otype DQA1* mmune individ ure 1.13 : Enco was the first fied by sero cular biology ctively on the d by serolog dies of second A, B, C, DR utside the HL enomic typing he years has in ons (Kennedy Donfack, 1999 variants of th by O. volvulus tion of DQ al *0501-DQB1* duals compare
17
oding structur to be descri ological typin y techniques. T DQA locus ical testing. dary mixed lym R and DQ. Th LA-DR and D by molecular ndicated the i y et al., 1991 9, Murdoch, 1 hese genes ands was highligh
lleles between *0301 was det
ed to patients
re of HLA clas ibed and com ng (DR1-DR The HLA-DQ and the DQB The HLA-DP mphocyte reac his series, ori DQ regions. To r biology. influence of H ; Wassom et 997), the pre d changes in c hted. In partic n affected and tected signific with acute ge ss II mprises 45 DR R15), and th Q series consis B locus: only P series was ction between iginally called oday there ar HLA class II a t al., 1987). R sence of a co clinical manif cular, differen d healthy ind cantly more fr eneralized or l R alleles he latter sts of 35 a few of initially subjects d SB, is re 20 DP alleles in Recently orrelation festations ces were dividuals. requently localized
18
disease. Conversely, the haplotypes DQA1*0101-DQB1*0501 and DQB1*0201 were more frequent in generalized disease than in healthy people.
This evidence clearly indicates that the HLA-D variants may influence infection by
O. volvulus and that they are therefore useful to define a state that may reflect
genetic protective immunity.
This research is therefore aimed at highlighting the presence of susceptibility/protective alleles in people scattered in the onchocerciasis hyperendemic focus of Esmeraldas: it may be considered the first HLA-onchocerciasis association screening in the Americas. Further, this study presents the unique opportunity to test two populations of different ethnic background co-located in a single environment, with the same selective forces, which may be very meaningful for detecting immunogenetic strength in response to onchocerciasis.
1.9 Use of SNPs as predictive markers
Recent studies examined the distribution of linkage disequilibrium (LD) along the HLA region and suggested that some SNPs (Single Nucleotide Polymorphisms) could help in the analysis of variations at HLA genes (Miretti et al., 2005, Walsh et al., 2003; Malkki et al., 2005, Simons et al., 1993).
The use of SNPs in studies on the effects of natural selection on human genes is advantageous because the use of methods for genotyping leads to the definition of a large number of identified and analyzed SNP maps (Altschuler et al., 2005 ; Hinds et al., 2005).
High levels of LD between SNPs and HLA alleles suggest that the SNPs may be informative with respect to HLA type, so carefully selected SNPs may represent a useful tool for understanding the variation in different HLA loci (de Bakker et al., 2006).
The informations provided by de Bakker and co-workers allow us to choose SNPs with the determination coefficient r2>0,8 in relation to DQB1*0301, the candidate
protective allele in all HLA-onchocerciasis association analyzed populations (Donfack et al.,1999; Meyer et al., 1994, Murdoch et al., 1997).
Previous identified highly co allele is Chinese, African o (rs10563 covered rs105631 Figur data in the d in the HapM orrelated with associated w Japanese and origin and in 15) of the pr only the pol 5 (Figure 1.14 re 1.14 : Chro (mod literature on Map project h HLA DQB with 2 SNPs d European) s n the Chinese revious pair i lymorphism 4). omosome posit dified from ww
19
n this subject (The Internat 1*0301 was s 4 different share the sam e, with the al n the Japanes most closely tion of HLA D ww.ncbi.nlm.n are few, so tional HapMa analyzed. In reference p me SNPs both llele correlate se. Thus, the y related to D DQB1 lcus an nih.gov/pubm o here a tagg ap Consortium particular, th opulations (A h in the popul ed with a sing genotyping DQB1*0301, nd SNP rs1056 ed/) ged SNP m, 2005) his HLA Africans, lation of gle SNP of SNPs namely 631521
2. MATERIAL AND METHODS
2.1 Material and methods
Several appropriate analyses were carried out to manage nuclear DNA to analyze HLA genes. DNA was extracted from blood samples and/or plasma (in some cases by blood coagulate) of 211 individuals of both sexes between 7 and 66 years of age, recruited in the field during the summer of 2004 (G.F. De Stefano; Dept. of Biology, University of Rome Tor Vergata). Of these, 62 subjects belong to 19 families from both communities (n = 36 Indians Cayapa, n = 26 of African origin), 74 are unrelated Cayapas, and 75 are unrelated Afroecuadorians. Through the analysis of epidemiological field data, it was possible to determine with certainty the clinical status of some sub-adult individuals, verifying by molecular diagnosis the presence/absence of microfilariae in the individual, although in low concentration. Two apparently healthy population samples were also analyzed to compare the HLA DQ composition: 53 individuals belonging to Indios Tsachilas, an amerindian population scattered nearby the Esmeraldas Province (G.F. De Stefano) and 36 people from Bamileke community of Cameroon, kindly provided as DNA sample by G. Destro Bisol (Sapienza University, Rome).
Known as Colorados for the manner of dying their hair with a red extract from achiote (Bixa orellana), the Tsachilas currently occupy the area between the provinces of Cotopaxi and Pichincha, the canton of Santo Domingo de los Colorados. There are approximately 2600 individuals organized in communities and we analyze the community of Chiguilpe. The Colorados are, together with Cayapas, the oldest population of the territory of Ecuador (Babalini et al., 2005) .
Bamileke are an African sample scattered though the “Bamileke plateau”, in Cameroon. This population was widely investigated by G. Destro-Bisol and colleagues (Scozzari et al., 1994; Spedini et al., 1999).
The DNA was extracted from whole blood using the “Salting out” technique (Miller et al., 1988) and stored at -80°C. The DNA from plasma, extracted using the protocol of Martin and colleagues (Martin et al., 1992), gave satisfactory concentrations of nucleic acid, although the amount of DNA used for amplification
22
had to be greater than the standard protocols to amplify DNA extracted from whole blood (3.5 μl vs. 0.8 μl). The experimental technique is detailed in Appendix 1. DNA extraction from samples for which it was not possible to obtain sufficient DNA concentrations was performed by coagulate based extraction using the protocol proposed by Budowle and colleagues (Budowle et al., 2000, Appendix 1): PCR (polymerase chain reaction) is a method of DNA amplification that allows the cloning of any fragment of DNA for which the upstream and downstream regions are known (Saiki et al., 1985, Mullis et al., 1987). PCR consists of a number of cycles of denaturation and renaturation of DNA inside a special device called a "Thermal Cycler". The polymerization needs a thermostable DNA polymerase (Taq polymerase), isolated from the thermophilic bacterium Thermus aquaticus; a pair of oligonucleotide sequences about 20 base pairs long, called primers, bounding the region of interest; the reaction buffer; and four nucleotides. The primers are complementary to the flanking region to be amplified (template) and are oriented to allow the polymerase to synthesize in the direction of 5'-3' the new strand. Since the synthetic products are also complementary to the primers, subsequent cycles will continue to double the area of DNA between two primers. Each cycle of reaction is divided into three stages (Figure 2.1):
- Denaturation: temperature rapidly increases (from 15 seconds to 1 minute) to 94°-96°C to separate two chains that form the double helix;
- Alignment of oligonucleotides: the temperature rapidly decreases to be between 37°C and 50°C (depending on the specificity of the primers), to allow the alignment of two primers on the DNA strands;
- Extension: the temperature goes back up to reach 72°-74°C, where the efficiency of Taq polymerase is maximized, resulting in the synthesis of new strands.
By the temperature increasing to 94°-96°C, we obtain the separation of the two chains, and a new cycle can start.
23
Figure 2.1 : PCR scheme
The number of cycles varies between 25 and 40, depending on the number of initial target DNA molecules (Simon et al., 1991). The final product will thus be an accumulation of templates in the order of 2n copies, with n representing the number
of cycles performed.
Electrophoresis is a series of techniques that allow the separation of any molecule, or set of molecules, with an electric charge according to different migration speeds when subjected to an electric field. These techniques involve the immersion of a three-dimensional matrix consisting of fibers of a hydrophilic polymer gel medium in an electrophoretic running buffer.
24
1. should not interact with the sample; 2. must be inert;
3. must be mechanically stable;
4. should allow visualization of separated molecules;
5. its "mesh" has to be checkable, i.e. the average diameter of its pores.
To optimally fit the above criteria, an excellent support for electrophoresis is agarose gel, a natural polymer that is extracted from red algae of the Gelidiacee family. Agarose forms gel because the polymer chains are joined in a rigid three-dimensional network, which keeps together the water molecules through hydrogen bridges. The polymer chains are connected via hydrogen bonds, forming double helices that are associated in groups of 10-20, and it gives rise to helical fibers that confer rigidity to the gel. To verify the successful amplification of the template by PCR, electrophoresis is performed on agarose gel using TBE buffer (0.04 M Tris Borate and 0.001 M EDTA). Five μl of each amplified product are mixed with gel loading buffer.
The gel loading buffer fits three functions:
1) increases the density of the sample, allowing the DNA to efficiently penetrate the wells of the gel;
2) colors the sample, thereby facilitating loading the amplified DNA in the gel; 3) contains a dye that migrates in an electric field towards the anode with a known speed.
The gel thus obtained is subjected to an electric field in the appropriate cell (Mini SubTM DNA Electrophoresis Cell: Bio-Rad, California, USA).
The gel is then stained with ethidium bromide and detected by exposure to UV light at 350 nm. Ethidium bromide contains a planar group that intercalates between DNA bases; therefore, the orientation and proximity of this causes the dye to increase in fluorescence compared to when it is free in solution.
25
Sample DNA (1 μl) is added to this mix to reach 25 μl (3,5 μl of DNA extracted from plasma are required).
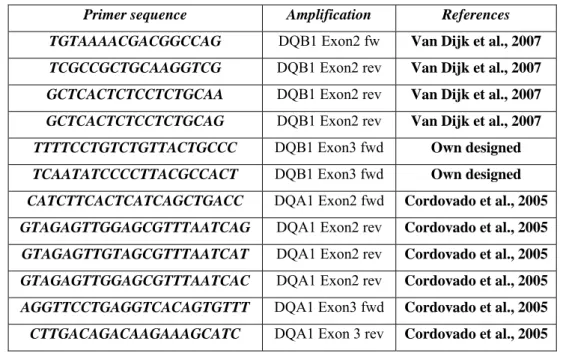
The oligonucleotides (primers) required to amplify the template vary according to the template itself (Table 2.1): the second and the third exons of each locus were analyzed in order to high resolution type each sample. The choice for these regions was due to their crucial role in encoding the HLA molecules (Figure 2.2): in fact these exons respectively encode for the α1 and β1 regions of the HLA DQ sub-units, which are the regions that form the antigen cleft.
Reagents μ l Primer F 10μM 1.5 Primer R 10μM 1.5 Buffer : 50 mM KCl 10 mM Tris-HCl pH 8.8 0,1 % Triton X100 2.5 MgCl2 15 mM 2.0 dNTPs 10 mM 1.0 Taq polymerase 0.3 ddH2O 15.2
26
Table 2.1 : Primers sequences
Figure 2.2 : HLA DQ encoding representation
To visualize the amplified products, 5 μl of PCR product are mixed with 1 μl of gel loading buffer, containing 0,25% xylene cyanol FF and 40% sucrose in water, and
Primer sequence Amplification References TGTAAAACGACGGCCAG DQB1 Exon2 fw Van Dijk et al., 2007
TCGCCGCTGCAAGGTCG DQB1 Exon2 rev Van Dijk et al., 2007
GCTCACTCTCCTCTGCAA DQB1 Exon2 rev Van Dijk et al., 2007
GCTCACTCTCCTCTGCAG DQB1 Exon2 rev Van Dijk et al., 2007
TTTTCCTGTCTGTTACTGCCC DQB1 Exon3 fwd Own designed
TCAATATCCCCTTACGCCACT DQB1 Exon3 fwd Own designed
CATCTTCACTCATCAGCTGACC DQA1 Exon2 fwd Cordovado et al., 2005 GTAGAGTTGGAGCGTTTAATCAG DQA1 Exon2 rev Cordovado et al., 2005
GTAGAGTTGTAGCGTTTAATCAT DQA1 Exon2 rev Cordovado et al., 2005
GTAGAGTTGGAGCGTTTAATCAC DQA1 Exon2 rev Cordovado et al., 2005
AGGTTCCTGAGGTCACAGTGTTT DQA1 Exon3 fwd Cordovado et al., 2005 CTTGACAGACAAGAAAGCATC DQA1 Exon 3 rev Cordovado et al., 2005
27
plugged into a 2% agarose gel, before being subjected to electrophoresis and visualized under UV light at 350 nm, after staining with ethidium bromide.
The product obtained after PCR is not simply the template, but it contains a mixture of amplified sequence, primers, dNTPs (deoxynucleotide 5' triphosphate), Taq polymerase and reaction buffer. The isolation of the DNA is a crucial step before carrying on further analysis, and precipitation by ethanol according to the following protocol (Sambrook 1989) is the simplest technology to achieve pure amplified DNA (Appendix 1):
The difficulty in obtaining perfectly comprehensible electropherograms necessitated a second technique that involves the use of two enzymes such as Exonuclease I and Alkaline Phosphatase. The Exonuclease I removes single-stranded nucleic acids (primers), and alkaline phosphatase hydrolyzes the remaining dNTPs that could interfere with the sequencing reaction.
To determine the nucleotide sequence of the purified PCR products, we used the automatic sequencer ABI PRISM 3100Avant Genetic Analyzer (Applied Biosystems) located in the Department of Biology, University of Rome Tor Vergata. This machine performs a "capillary electrophoresis" in which the physical medium, which allows the separation of labeled, amplified DNA, consists of a special polymer contained in a silica capillary.
Among the many advantages offered by the application of this technique, the following can be highlighted:
- Rapidity of use, because the preparation of the gel and the loading of the sample are automatically carried out.
- Greater sensitivity, because you can get good results even from samples with low signal intensity after PCR amplification.
- The results are automatically analyzed using a special software thereby avoiding inconvenience and inconsistencies in the subjective interpretation of results.
28
The method is based on software that detects the fluorescence of four different colors associated with the four nucleotide bases: adenine, cytosine, thymine and guanine. In this way, every color, when it is excited by a laser, emits light at a different wavelength, and the four nucleotide bases can be easily identified. To mark the four nucleotide bases with fluorescent colors, you can use two different methods, both based on PCR, which allows the incorporation of a fluorescent compound in the template.
The first method uses 5' dye-labeled primers (dye primers), which are labeled primers in the 5' end of molecules called fluorochromes; and the second is based on the use of 3' dye-labeled dideoxy-nucleotide triphosphate (dye terminators). The choice of the method depends on the purpose of the study.
PRIMER LABELING DYE: This method enables identification of the products using primers labeled with four different fluorescent colors in four separate, base-specific reactions.
The advantages in the use of dye-labeled primers are as follows: - Labeled primers are available for most common sites of initiation; - They generally produce more intense signals than dye terminators.
LABELING DYE TERMINATOR: with dye terminators, each of the four dideoxy terminators (ddNTPs) is labeled with a different fluorescent color. Thus, the extension of the chain is simultaneously blocked and marked with the color that corresponds to that base. The advantages of using the dye-labeled terminators are: - The four sequencing reactions are carried out simultaneously in a single tube; - False stops, caused by the enzyme during the extension of the chain, can be detected by the lack of binding of dye terminators;
- The use of dye terminators requires less preparation than required with the use of dye primers.
29
In the present study, dye terminators were used and, in order to incorporate them into the template, a cycle was performed with the following program:
96 °C 10 sec. 50 °C 5 sec. 4 min. 64 °C 25 cycles
The reaction mixture (mix) contains:
1,57 μl of the primer (usually the forward amplification primer was used) 2 μl of Big-Dye (containing dye terminators, the buffer, Taq polymerase) 6,43 μl ddH2O.
As for the PCR amplification, the marking also results in a set of labeled DNA, dye terminators, and Taq polymerase. In order to collect pure DNA, it is therefore necessary to carry out a second ethanol purification (Sambrook et al., 1989).
A second tool for the purification of marked products was used: the Centri-Sep columns. Centri-Sep columns (Princeton Separation) were used for the rapid and efficient purification of amplified labeled products by dye terminators according to the method of gel-filtration (Sambrook et al., 1989). Each unit consists of an anhydrous array contained within a special tube. This matrix is hydrated by 0,8 ml of distilled H2O to gel after a subsequent centrifugation at 2,000 rpm for 2 minutes.
The sample is loaded at the center of the gel and then subjected to further centrifugation at 2,800 rpm for 2 minutes. Once eluted, the DNA is ready for preparation for the automatic sequencer.
The preparation for the automatic sequencer consists of adding 20 μl deionized formamide to the labeled product.
30
Once the samples were analyzed, the raw data thus obtained were processed by the computer connected to the automatic sequencer, equipped with particular software. The software used by the automatic sequencer is based on three processes:
- Give rise to a map made up of several peaks;
- Find the starting position and the limits of the sequence;
- Trace and extract the data obtained into a file used to read the nucleotide sequence. This software discriminates and balances the differences in mobility and the spectral overlap between the marked bases to locate the start point and the end of a nucleotide sequence.
The output of this software is a electropherogram in which there are several peaks of different colors, each representing one nucleotide. This diagram represents the input files for other programs that allow the reading of the sequence.
2.2 SSO
A second technology was used to type HLA DQB1 locus: the Sequence Specific Oligonucleotide (SSO) hybridization. Molecular HLA typing was performed using the Inno-Lipa Multiplex and DQB1 Update kits (Innogenetics). The Inno-Lipa DQB1 Multiplex kit is designed for the amplification of the second and third exon of human leukocyte antigen DQB1 locus. The reaction is carried out using multiplex PCR format using the manufacturer’s recipes. The sample to be amplified by PCR is added to a mixture of reagents containing deoxynucleotide 5' triphosphate (dNTP), biotinylated primers and thermostable DNA polymerase. In this way, we produced biotinylated target sequences. Inno-Lipa HLA-DQB1 Update is a probe test for in vitro use, designed for the molecular typing of DQB1 alleles of human leukocyte antigen.
The rationale of the test is based on reversed hybridization: amplified biotinylated DNA is denatured, and the single strands are hybridized with specific oligonucleotide probes immobilized in parallel lines on membrane strips .
This test follows a stringent washing step to remove amplified material in a non-specific binding. Alkaline phosphatase-conjugated streptavidin is added, which
31
binds to any biotinylated, previously formed hybrid. Incubation with a solution containing a chromogenic substrate leads to the formation of violet precipitates. The reaction is stopped by a washing step, and the pattern of reactivity of the probes is recorded to identify which HLA DQB1 allele is present.
2.3 SSP
HLA DQA1 alleles were also typed by a different methodology: the Sequence Specific Primer (SSP) typing. Method DYNAL SSP is a PCR-based technique: it use primers that amplify specific sequences of the HLA DQA1 locus. The kit DYNAL SSP (DYNAL) consists of several pairs of allele-specific primers placed in different reaction tubes along with a mix of control and primers used to verify amplification efficiency. This technique is based on the principle that a complementary primer to a region is more efficient than primers containing one or more mismatches, so the allelic identification consists of simply determining if the amplification has been positive in a given reaction tube through visualization of the PCR product by electrophoresis.
2.4 SNP typing
The analysis of the SNP rs 1056315 was carried out by two different methodologies: direct sequencing and real time assay using LNA probes.
The direct sequencing primers and the protocol are listed below:
The second methodology used is the real time assay by TaqMan® LNA probe. TaqMan probes consist of a fluorophore covalently attached to the 5’-end of the oligonucleotide probe and a quencher at the 3’-end (Figure 2.3). Several different fluorophores and quenchers are available. The quencher molecule quenches the fluorescence emitted by the fluorophore when excited by the cycler’s light source
Primer sequence Primer AATTGAGCAGAGGCAGGAAA rs1056315 fwd
32
via FRET (Fluorescence Resonance Energy Transfer). As long as the fluorophore and the quencher are in proximity, quenching inhibits any fluorescence signals.
Figure 2.3 : TaqMan system
TaqMan probes are designed such that they anneal within a DNA region amplified by a specific set of primers. As the Taq polymerase extends the primer and synthesizes the nascent strand, the 5' to 3' exonuclease activity of the polymerase degrades the probe that has annealed to the template. Degradation of the probe releases the fluorophore from it and breaks the close proximity to the quencher, thus relieving the quenching effect and allowing fluorescence of the fluorophore. Hence, fluorescence detected in the real-time PCR thermal cycler is directly proportional to the fluorophore released and the amount of DNA template present in the PCR. The specificity of SNP detection by probe hybridization is based on the difference in melting behavior of perfectly matched duplexes with the target probe and single mismatches. The greater the difference between the melting temperature (Tm) of the matched versus mismatched duplexes, the better is the oligo probe’s discriminating power. Since the stability difference between a perfectly matched duplex and a mismatched duplex can be as small as 0,5°C, the discrimination between two DNA sequences that differ by only 1 base is difficult. This Tm is dependent upon the length of the probe, the type of mismatch, and the neighboring nucleotides. The longer the probe, the smaller the effect of a single-base mismatch on overall duplex
33
stability. The differential stability of a matched versus mismatched duplex is the main limitation of the use of oligonucleotide hybridization for detection of SNPs. The specificity of DNA probes can be improved by designing short probes (Thein et al., 1986); however, this is not always possible because of the Tm limitation. The Tm of short oligonucleotide probes is often significantly reduced, thus inhibiting or reducing hybridization to a minimum at the PCR annealing temperature selected for the assay.
An interesting alternative that allows the design of shorter probes for allelic discrimination was the use of probes containing LNA residues (Braasch et al., 2001). The synthesis and hybridization properties of oligonucleotides containing a novel nucleotide analog called locked nucleic acids have been reported (Kumar et al., 1998). Oligonucleotide probes containing LNA residues have shown strong affinity for their complementary targets. Because of their high thermal stability when hybridized to DNA, oligonucleotides containing LNA can be designed to have a shorter length while keeping a high Tm such that probe hybridization can occur during the PCR annealing step.
The oligonucleotides for this detection are as follows:
Primer sequence Oligo Notes GATGCGACAATTGAATTATTTTC Real time fwd Own designed Tm 56°C
CACTGAAAGCATTTTGGG Real time rev Own designed Tm 56°C
cccAccAttActTcac LNA probe T Own designed Tm 58 Capitals indicate the LNA
cccAccCttActTcac LNA probe G Own designed Tm 60.5 Capitals indicate the LNA
35
3. RESULTS3.1 Examples of the results
Molecular typing was performed using three different techniques: SSP amplification for DQA1, reverse dot blot analysis (SSO) by the Inno-Lipa kits to test HLA-DQB1, in addition to the direct sequencing of exon 2 and/or 3 to examine samples whose SSP/SSO typing did not provide acceptable results. Figures 3.1; 3.2 and 3.3 show a brief example of the typing, in order to point out the quality of the results.
Figure 3.1
:
Test Inno-Lipa HLA DQB1 Update36
Figure 3.3 : Electropherogram of direct sequencing of exon 2
The SSP data were analyzed by SSPTool, a supplied software by Dynal that detects and discriminates several electrophoresic pattern to correctly assign the HLA allele. SSO colorimetric tests were screened by a specific software like LIRAS® for LiPA HLA furnished by Innogenetics Inc.: after scanning of the LiPA strips for HLA (attached to a LiPA-Scan reading template), or manual entry of the probe reactivities, the LiRAS® for LiPA HLA software assisted in the interpretation of the HLA typing results. The sequence data were analyzed by direct reading and comparisons with the available HLA sequence data on www.anthonynolan.org.uk and the allelic assignment was confirmed by SBTengine (www.gendx.com), an user-friendly intuitive software for high-resolution HLA sequence based typing. (www.anthonynolan.org.uk and Robinson et al., 2000)
The Single Nucleotide Polymorphism (SNP) rs1056315 was detected by direct sequencing (Figure 3.4) and real time assay (Figure 3.5)
37
Figure 3.5 : SNP rs1056315 detected by real time assay
3.2. Families
The study of the 19 families outlines some interesting focal points regarding to the differential response to O. volvulus infection. The typing results are graphically expressed to quickly understand the differences between the two represented groups.
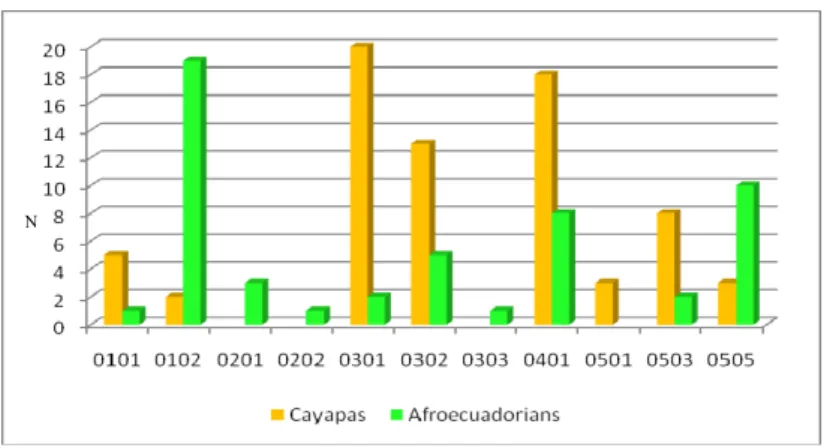
HLA DQA1 Cayapas Afroecuadorians
0101 5 1 0102 2 19 0201 3 0202 1 0301 20 2 0302 13 5 0303 1 0401 18 8 0501 3 0503 8 2 0505 3 10
38
Figure 3.6 : HLA DQA1 allelic distribution observed in the familiar samples
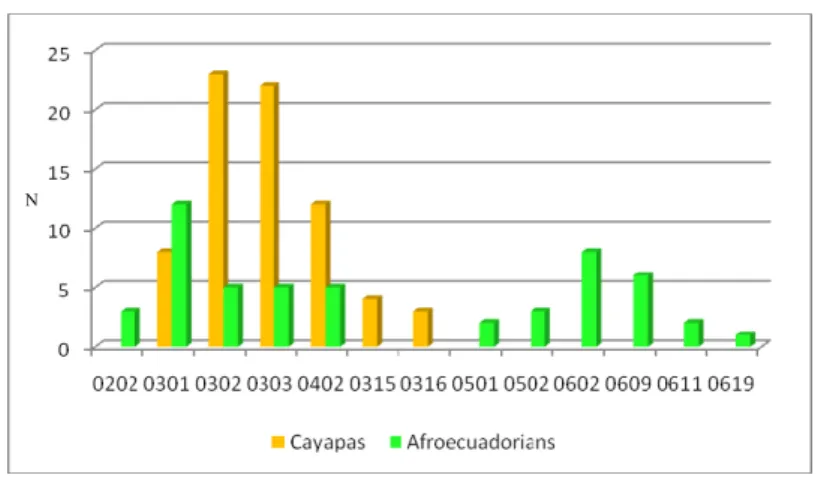
HLA DQB1 Cayapas Afroecuadorians
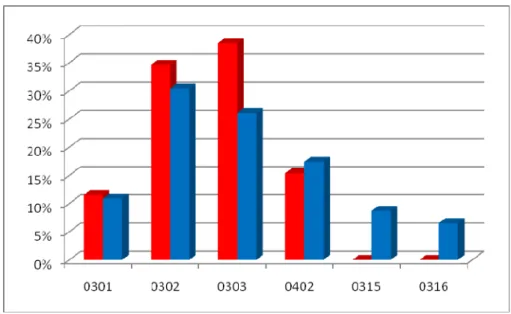
0202 3 0301 8 12 0302 23 5 0303 22 5 0402 12 5 0315 4 0316 3 0501 2 0502 3 0602 8 0609 6 0611 2 0619 1
Table 3.2 : HLA DQB1 alleles observed in the familiar samples
39
Figure 3.7 : HLA DQB1 allelic distribution observed in the familiar samples In Tables 3.1 and 3.2 and Figures 3.6 and 3.7 the different allelic composition can be observed in the familial samples. This difference in each HLA DQ loci of course results from the different belonging of the two populations but also may reflect the pursued social model of the communities: the Cayapa Indians have always shown a strong endogamy, where weddings take place almost exclusively among individuals of the same community, and this is reflected by a limited genetic variability. Conversely the afroecuadorian community is an open community where marriages with individuals of other communities were and are very frequent: this feature allows a greater gene flow with surrounding populations, increasing genetic diversity of the community.
40
The samples were subdivided according to their clinical status due to onchocerciasis (Tables 3.3 and 3.4 ; Figures 3.8 and 3.9).
Cayapas HLA DQA1 Oncho No Oncho
0101 2 3 0102 1 1 0301 12 8 0302 3 10 0401 3 15 0501 3 0503 3 5 0505 2 1
Table 3.3 : HLA DQA1 distribution in the Cayapa families according to the clinical status
Figure 3.8 : HLA DQA1 allelic distribution in the Cayapa families according to the clinical status (red:affected individuals; blue: not affected individuals)
41
Cayapas HLA DQB1 Oncho No Oncho
0301 3 5 0302 9 14 0303 10 12 0402 4 8 0315 4 0316 3
Table 3.4 : HLA DQB1 distribution in the Cayapa families according to the clinical status
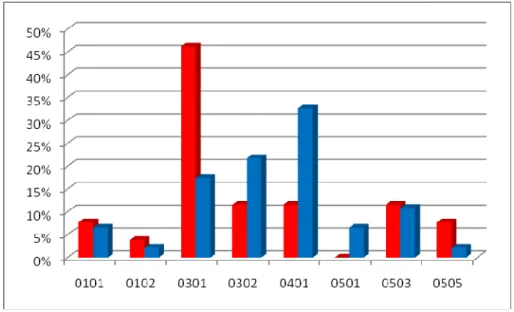
Figure 3.9 : HLA DQB1 allelic distribution in the Cayapa families according to the clinical status (red:affected individuals; blue: non affected individuals) In Cayapas’ community two alleles are significantly differently distributed between cases and controls: alleles HLA DQA1*0401 seems to be linked to healthy individuals (p=0.05) while HLA DQA1*0301 appears in strong connection with susceptibility versus onchocerciasis (p=0.01). Conversely, among DQB1 alleles, anyone seems to be selectively distributed in a single group, even if *0303 appears
42
to be more present in sick people than healthy ones, but the difference is not statistically meaningful.
Afroecuadorians HLA DQA1 Oncho No Oncho
0101 1 0102 8 11 0201 1 2 0202 1 0301 2 0302 3 2 0303 1 0401 1 7 0503 2 0505 1 9
Table 3.5 : HLA DQA1 distribution in the Afroecuadorian families according to the clinical status
Figure 3.10 : HLA DQA1 allelic distribution in the Afroecuadorian families according to the clinical status (red:affected individuals; blue: healthy individuals)
43
As for the locus HLA DQA1, the afroecuadorian community shows the leading presence of two alleles in individuals supposedly protected from infection although they are represented in few subjects and for this reason they don’t reach the statistical significance: HLA DQA1*0401 and HLA DQA1*0505 (Table 3.5 and Figure 3.10). These alleles do not match the supposedly protective DQA1*0501 allele, found in West Africa populations, for which we have the unique reference data (Meyer et al., 1994, Murdoch et al., 1997 and Donfack et al., 1999). Conversely, HLA DQA1*0102, without statistical significance, appears to be more present in subjects affected by onchocerciasis (57% vs 29%).
Afroecuadorians HLA DQB1 Oncho No Oncho
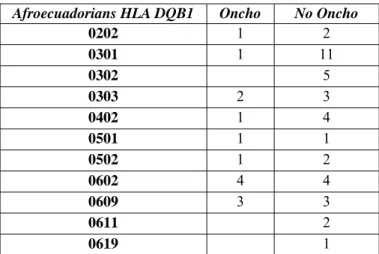
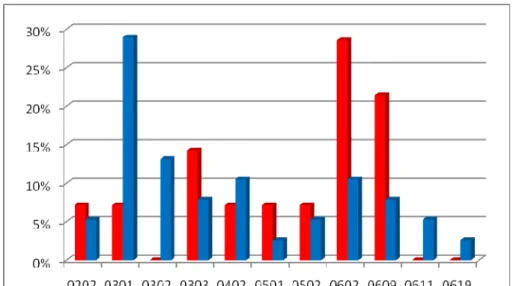
0202 1 2 0301 1 11 0302 5 0303 2 3 0402 1 4 0501 1 1 0502 1 2 0602 4 4 0609 3 3 0611 2 0619 1
Table 3.6 : HLA DQB1 distribution in the Afroecuadorian families according to the clinical status
44
Figure 3.11 : HLA DQB1 allelic distribution in the Afroecuadorian families according to the clinical status (red:affected individuals; blue: healthy individuals) Moreover in the afroecuadorian community seems to be a link between the HLA DQB1*0301 or *0302 and a form of protection from infection by O. volvulus, as expressed in Figure 3.11 and Table 3.6, but the small number of controls doesn’t allow to reach significance. This result may confirm the data already present in literature (Meyer et al., 1994, Murdoch et al., 1997) but referred only to populations of the African continent.
45
The SNP rs1056315 genotyping allowed to classify the subjects (Table 3.7):
Indios Cayapa Afroecuadorians
N % N %
T/T 2 5.6 7 26.9
G/T 8 22.2 5 19.2
G/G 26 72.2 14 53.9
Total 36 100 26 100
Table 3.7 : SNP rs10566315 genotypic frequencies in the Cayapa and Afroecuadorian communities
Table 3.8 shows the allele frequencies of the SNP in the samples.
Cayapas Afroecuadorians
T 0.17 0.37
G 0.83 0.63
Table 3.8 : Allele frequencies in the samples
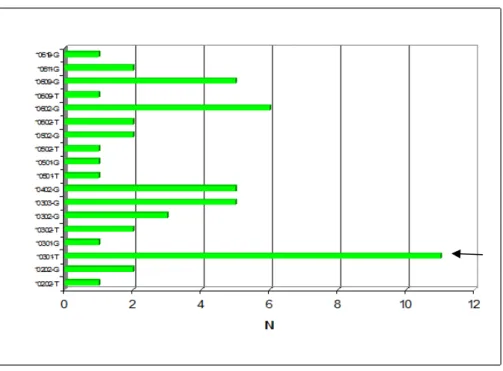
By linking the results concerning the analysis of polymorphism rs1056315 with the molecular typing of HLA DQB1, it can be observed that the T allele of the SNP shows a moderate association with the allele DQB1*0301 in the community of African origin: in fact there is strong association between the presence of DQB1*0301 and allele T of SNP rs1056315, but not the reverse is true. In fact this can be seen by the frequencies of the estimated haplotypes between rs1056315 and HLA DQB1(Figures 3.12 and 3.13), Haplotype frequencies were computed according to Markov chain by Phase v. 2.1. (Stephens et al., 2001)
46
Figure 3.12 : Count of estimated haplotypes between SNP rs1056315 and HLA DQB1 in the Afroecuadorian community
This confirms, at least in part, the bibliographic data (de Bakker et al., 2006), although the correlation seems not to be very strong. In fact the frequency of haplotypes DQB1*0301-T is the leading (Figure 3.12) but also exist estimated haplotypes DQB1*0301-G and DQB1other-T, even if at low frequencies.
47
Figure 3.13 : Count of estimated haplotypes between SNP rs1056315 and HLA DQB1 in the Cayapa community
In Cayapas, conversely, this association does not seem true (Figure 3.13).
3.3 Afroecuadorians
Population sample of afroecuadorian community regards to a sample of 75 unrelated individuals. Table 3.9 and Figure 3.14 show the HLA DQA1 composition of the Esmeraldas’ afroecuadorian sample. This points out an expected heterogeneity that encompass 16 variants at locus HLA DQA1, with the leading frequency of two allele, HLA DQA1*0102 and *0401, with 32% (n=48) and 29% (n=43) respectively, while the other allelic variants are somewhat less represented, with the sole exceptions of *0103 with 11%.
48
DQA1 TOTAL % 0101 2 1% 0102 48 32% 0103 16 11% 0104 1 1% 0201 7 5% 0202 1 1% 0301 2 1% 0302 5 3% 0303 1 1% 0401 43 29% 0402 4 3% 0501 2 1% 0502 4 3% 0503 2 1% 0505 11 7% 0601 1 1%Table 3.9 : HLA DQA1 distribution in the Afroecuadorian sample by percentage
49
Same eterogeneity is shown by locus HLA DQB1: in fact the number of allele is quite the same but the frequencies of each is more distributed. The leading presence of DQB1*0301 (26%) is due to 39 alleles, followed by *0402 with 32 alleles (21%), and the *0611 wich reach the 10% (Table 3.10 and Figure 3.15).
DQB1 TOTAL % 0201 5 3% 0202 1 1% 0203 1 1% 0301 39 26% 0302 4 3% 0303 10 7% 0402 32 21% 0501 8 5% 0502 2 1% 0503 1 1% 0601 2 1% 0602 14 9% 0609 7 5% 0611 15 10% 0627 9 6%
Table 3.10 : HLA DQB1 distribution in the Afroecuadorian sample by percentage
50
The subdivision of population according to its clinical status respect to onchocerciasis points out some interesting focal points that one could hypotize by the familial sample (Table 3.11 and Figure 3.16). In fact it is very interesting to note that DQA1*0102 confirms its susceptibility role reaching the statistical significance (p<0.001) along with DQA1*0103, which may be considered to be extremely statistically significant (p<0.0001). The same level of significance is reached by DQA1*0401 as protective allele (p<0.0001), also identified in familial study in a no sognificant form. Like every case/control study, Odd Ratios are calculating for each allele. The odds ratio is a measure of effect size, describing the strength of association or non-independence between two binary data values. It varies between 0 and ∞ with a threshold of 1 to indicate indipendence between variables. An odd ratio (OR) less than 1 indicates protection versus a disease, while an OR more than 1 means that the allele plays a susceptibility role in the disease. Thus the OR calculated for *0102 is 4.29 (confidence interval, CI, 2.07-8.89; p<0.01) and 14 was the OR for *0103 (CI 3.04-64.37; p<0.05): both indicate a specific susceptibility role of these alleles in onchocerciasis, and moreover the *0103 seems to be very impressive in susceptibility, but the wide confidence interval weakens the strenghtness of this role. For the HLA DQA1*0401 also was calculated the OR and the result of 0.13 (CI 0.047-0.35; p<0.01) confirms the protective role of this allele in onchocerciasis.
51
DQA1 NO ONCHO ONCHO TOTAL
0101 2 2% 0 0% 2 1% 0102* 18 20% 30 50% 48 32% 0103** 2 2% 14 23% 16 11% 0104 0 0% 1 2% 1 1% 0201 7 8% 0 0% 7 5% 0202 1 1% 0 0% 1 1% 0301 2 2% 0 0% 2 1% 0302 1 1% 4 7% 5 3% 0303 1 1% 0 0% 1 1% 0401** 38 42% 5 8% 43 29% 0402 4 4% 0 0% 4 3% 0501 1 1% 1 2% 2 1% 0502 4 4% 0 0% 4 3% 0503 2 2% 0 0% 2 1% 0505 6 7% 5 8% 11 7% 0601 1 1% 0 0% 1 1%
Table 3.11 : HLA DQA1 distribution in the Afroecuadorian sample by percentage according to the clinical status (*p<0.01; **p<0.001)
Figure 3.16 : HLA DQA1 allelic distribution in the Afroecuadorian sample according to the clinical status (red:affected individuals; blue: healthy individuals)
52
As for HLA DQB1 anyone allele is significantly distributed between cases and controls, even if it can be observed the leading frequency of DQB1*0301 in healthy individuals, probable heritage of their african origin (Table 3.12 and Figure 3.17). For this allele OR was estimated and the not completely significant result of 0.34 (CI 0.11-1.07; p=0.06) indicates a latent protective role, that may be weakened by the intensive gene flow occurred in this population.
DQB1 NO ONCHO ONCHO TOTAL
0201 0 0% 5 8% 5 3% 0202 1 1% 0 0% 1 1% 0203 0 0% 1 2% 1 1% 0301 28 31% 11 18% 39 26% 0302 4 4% 0 0% 4 3% 0303 4 4% 6 10% 10 7% 0402 21 23% 11 18% 32 21% 0501 3 3% 5 8% 8 5% 0502 2 2% 0 0% 2 1% 0503 1 1% 0 0% 1 1% 0601 0 0% 2 3% 2 1% 0602 9 10% 5 8% 14 9% 0609 3 3% 4 7% 7 5% 0611 8 9% 7 12% 15 10% 0627 6 7% 3 5% 9 6%
Table 3.12 : HLA DQB1 distribution in the Afroecuadorian sample by percentage according to the clinical status
53
Figure 3.17 : HLA DQB1 allelic distribution in the Afroecuadorian sample according to the clinical status (red:affected individuals; blue: healthy individuals) The sample was typed for rs1056315 and the result of this is shown in Table 3.13
rs1056315 N % G/G 48 G 73 G/T 13 T 27 T/T 14 TOTAL 75 100
Table 3.13 : Genotypic and allele frequencies of SNP rs1056315
To investigate the potential predictive role of this SNP for HLA DQB1*0301, haplotypes were estimated by Phase v.2.1 (Stephens et al., 2001).
54
Figure 3.18 : Esimated haplotype distribution between HLA DQB1 and SNP rs1056315 in the Afroecuadorian community
As showed in Figure 3.18 there is a leading frequence of the haplotype DQB1*0301-rs1056315T that occours in 26 genomes while the others HLA DQB1-DQB1*0301-rs1056315T haplotypes do not reach the 8 genomes. More distributed is the G allele that is in connection with all the HLA DQB1 alleles.
3.4 Cayapas
Population sample of Cayapa Indians involves 74 unrelated individuals. Table 3.14 and Figure 3.19 point out the HLA DQA1 allelic pool. This encompasses 11 allelic variants with the foremost frequency of three alleles: DQA1*0301, *0302 and *0401 (respectively 30%, 18% and 24%); with the rest in somewhat low frequencies.