Advances in Unsaturated Soils – Caicedo et al. (eds) © 2013 Taylor & Francis Group, London, ISBN 978-0-415-62095-6
Progressive emergence of double porosity in a silt during compaction
F. Casini, J. Vaunat & E. Romero
Departamento de Ingeniería del Terreno, Cartográfica y Geofísica, Universitat Politècnica de Catalunya, Barcelona, Spain
A. Desideri
Dipartimento di Ingegneria Strutturale e Geotecnica, Sapienza Università di Roma, Roma, Italy
ABSTRACT: The paper deals with an experimental investigation of water retention properties of a statically compacted unsaturated low plasticity silt. The objective is a deeper understanding of the evolution of an aggregate type fabric at different initial conditions in terms of void ratio and water content. A series of Mercury Intrusion Porosimetry tests (MIP) were performed to provide informa-tion about factors influencing fabric changes (effect of mechanical stress due to sample compacinforma-tion) and fabric-properties relationships (water re-tention curve related to porosimetry). The arrangements of aggregation/particles are also investigated with Environmental Scanning Electron Microscopy (ESEM). The experimental data has been used to calibrate a multimodal water retention model for aggregate which is obtained by linear superposition of sub-curves of the van Genuchten type modified. By comparing the WRC obtained by MIP and under suction controlled conditions it has been found a good agreement between the two method for the drying path.
As pointed out by various author (e.g., Romero et al., 2000) two main mechanisms generally gov-ern the storage of water inside a soil: the first mechanism is mainly related to free water flow inside the macropores between aggregates/grain; the second one is related to water adsorption at the intra-aggregate level. While the second mechanism is virtually independent of the void ratio, the first one is coupled with the mechanical response of the soil (e.g., Vaunat et al., 2000; Casini 2012; Casini et al., 2012b).
In the literature few works on the microstruc-tural behaviour on compaction are devoted to low activity soils with clay content less than 25%. These silty soils have a low tendency to form aggregates and are characterized by a mono-modal pore size distribution, which makes them no so attractive for the study of microstructural features. Neverthe-less, under certain circumstances these low activ-ity soils develop an aggregated structure (double porosity), which enhances their microstructural sensitivity to loading and water content changes. The current paper specifically focuses on the devel-opment and changes undergone on an aggregated structure induced by different initial conditions applied on a silty material. This kind of aggregated microstructure has important consequences on the water retention properties. To properly describe its evolving water retention character, a multimo-dal retention model is proposed by considering a 1 INTRODUCTION
The soil structure of compacted soils depends on void ratio and water content at compaction. The ad-vent of techniques such as mercury intrusion porosimetry (MIP), useful to study the pore size distribution, and environmental scanning elec-tron microscopy (ESEM), able to visualize micro-structural features at different hydraulic state led to important understanding of the soil structure evolution during hydro-mechanical paths (e.g., Monray et al., 2010; Casini et al., 2012).
The structure of most coarse-grained, or granu-lar, soils display a mono-modal pore size distri-bution, as there is little tendency of the grains to adhere to each other and to form aggregates. The actual arrangement and internal mode of pack-ing of the grains de-pends upon the distribution of grain sizes and shapes, as well as upon the manner in which the material has been deposited or formed in place. In soils with an appreciable content of clay, the primary particles tend, under favorable circumstances, to group themselves into structural units known as secondary particles, or aggregates. Such aggregates are not characterized by any universally fixed size, nor are they necessar-ily stable. The visible aggregates, which are gener-ally of the order of several millimeters to several centimeters in diameter, are often called peds, or macro-aggregates.
linear superposition of two sub-curves of the van Genuchten (1980) type, which allow having a bet-ter insight into the micro-structural features and their consequences at macro-structural level. 1.1 Material
The material used in the tests is an aeolian silt extracted from a layer of alluvial soil located at Jossigny, East of Paris, France. The behaviour of the saturated and unsaturated state of this material was studied by various authors (Cui (1993), Casini (2008), D’Onza et al., 2011).
The soil is classified as low plasticity silt (CL) (Figure 1) with presence of a significant fraction of clay (25%). Clay minerals determined by X-ray difractometry are illite, kaolinite and inter-stratified illitesmectite. No significant swelling properties have been observed on wetting (Cui and Delage, 1996). In situ water content is around 22%.
The grain size distribution of the soil and the grain size distribution function are reported in figure 1. The soil is classified as silty clay of low plasticity according to the USCS.
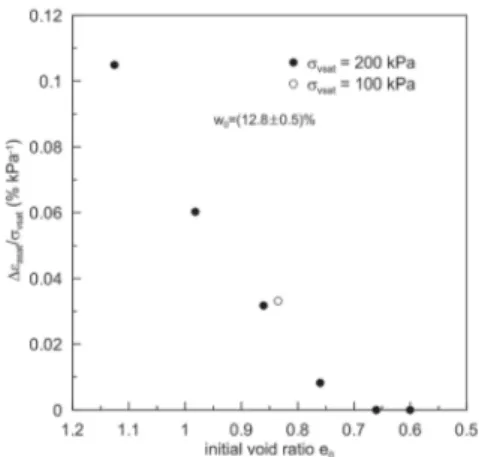
Several samples of Jossigny silt compacted at dif-ferent void ratio and water contents were saturated for a vertical stress σv= 200 kPa by Casini (2008).
The results of the saturation phase are reported in Figure 2 in the plane axial strain induced by satu-ration Δεasat versus initial void ratio e0. The samples
exhibit collapse (compression) behaviour upon wetting that decreases with the initial void ratio. 1.2 Experimental program
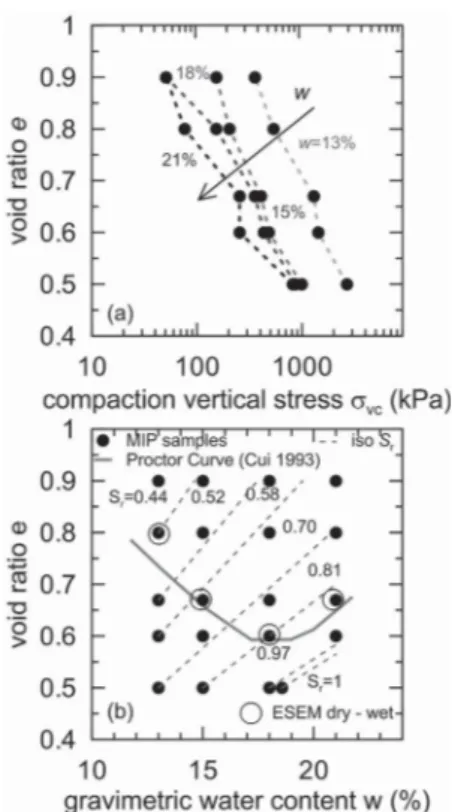
Twenty MIP tests were performed at five different void ratios e (0.5–0.9 ) and four gravimetric water content w (%) (13–21 ) (Figure 3a). Some MIP tests have been also repeated adding dissolved salt (NaCl) 0.5–3 molar (circles in Figure 3). The tested sample, the saturation line and the Proctor curve are reported in Figure 3 in the plane void ratio e gravimetric water content w (%). The samples were prepared by one-dimensional static compression. The appropriate mass of loose soil was initially mixed to the target water content and then com-pacted statically with a press with the readings of the compaction forces. In figure 3b are reported the vertical stress needed to reach the target void ratio for each MIP sample. The compaction ver-tical stress increases as the void ratio decreases, changing the water content the trend is similar. The curves are shifted to the right as the wa-ter content decreases. The value range between 50 kPa (w = 21% e = 0.9) and 2800 kPa (w = 13 e = 0.5) (Casini et al., 2012).
Some MIP tests have been also repeated add-ing salt (NaCl) 0.5–3 molar (circles in Figure 3).
Figure 1. Jossigny silt: (a) Grain Size Distribution; Grain Size Density Function.
Figure 2. Deformation at saturation stage for different initial void ratios (after Casini et al., 2012).
The salt was added in order to modify the activity of the finer particle and to check if the structure is essentially related to the activity of the clay frac-tion. The salt has been used as an artificial way to deeper understand the phenomena of the double porosity emergency and its evolution. The salt was dissolved in the water and the mixture was added to the ovendried soil powder as for the others samples.
2 EXPERIMENTAL RESULTS
In Figure 4 are reported the results of the MIP tests for the same gravimetric water content and differ-ent void ratio e in terms of PSD* = PSDenw/e where PSD = −Δenw/Δ(logd) is the Pore Size
Distri-bution, enw= Vnw/Vs the void ratio of non wetting
fluid, d the pore diameter, Vnw the volume of non
wetting fluid and Vs the volume of solid particles.
The shape of the PSD* is given by w. It is interest-ing to note for the lower w = 13% the PSD* is quasi mono-modal, the peak value is centered around a diameter D = 5 mm (about 25% of the bigger peak diameter of the grain size density function Fig. 4a) while as the w increase a new “pore family” appears (w = 15% Fig. 4b). This emergence of the double porosity move progressively as the water content increases (w = 18% Fig. 4c) and tend to disappear for w = 21%.
The results are also reported in Figure 5 for the same void ratio and different water content. The curves trend are similar for the different void ratio. It is evident the quasi mono-modal structure of the lower water content which progressively
change to a double porosity structure where the macro (M) peak value move to DM= 8–10 mm
and a macro-micro (Mm) porosity emerge for
a DMm= 1 mm. While for the higher water
con-tent the double porosity became narrow with a
DMm= 1.5–2 mm and DM = 7–9 mm (exception e = 0.6 w = 21%).
The results are compared with the no-salty samples in figure 6 in order to investigate the sta-bility of smaller pores with an elettrolitical solu-tion. The structure related to the increasing water content and to the subsequent swell of the aggre-gates is inhibit by the presence of salt. The micro
Figure 3. Tests: (a) MIP samples (with salt circle), ESEM (circle) with and without salt, Proctor Curve and iso Degree of Saturation Sr in the plane w−e; (b) compac-tion vertical stress measured versus void ratio measured for compacted the samples at target void ratio e and w.
Figure 4. Normalised PSD/enw•e versus pore diameter for the same gravimetric water content w: (a) w = 13%; (b) w = 15%; (c) w = 18%; (d) w = 21%.
Figure 5. Normalised PSD/enw*e versus pore diam-eter for the same void ratio e: (a) e = 0.50; (b) e = 0.60; (c) e = 0.67; (d) e = 0.80; (e) e = 0.90.
aggregation is blocked. The pores size diameters are smaller with salt. During a drying process in salty soils the salt is deposited.
3 CONSEQUENCES ON WATER RETENTION PROPERTIES
The MIP results can be used to obtain the rela-tionship between the suction and the degree of saturation or water content at constant void ratio. The mercury intrusion is assimilated to the air-intrusion (non-wetting fluid) during the drying path of the water retention curve. Thus the injec-tion of mercury with a contact angle is equiva-lent to the drain-age of the water induced by air front advancing for the same diameter of pores intruded. Under the hypothesis of non-deformable soil skeleton, the volume of pores non intruded by the mercury should be used to evaluate the degree of saturation or the water content corresponding to the equivalent applied air overpressure. Anyway, the non-intruded porosity by the mercury should be taken into account for estimating the residual water content in the evaluation of the water con-tent. The WRC obtained is valid in the range where the capillarity is the predominant physics mecha-nisms, usually for suction s < 2 MPa.
The water ratio ew =Vw /Vs =Sr∙e is estimated by
the following equations:
e
nwe
we
w nw rnw ew+
e e=
nw ee
w − e ( Srnwr ) (1)Where enw is the non wetting ratio (mercury), Sr and Srnw the degree of saturation of water and
non—wetting fluid respectively (Sr+ Srnw= 1) for a
two fluid mixture).
In Figure 7 are reported the WRC obtained after the correction for taking into account the
non-intruded porosity and the adsorbed water. The residual water ratio as been taken ewres in agree-ment with the measures performed with a WP4 at different void ratios.
The water ratio ew= Vw/Vs where Vw is the volume of water and ewres is the residual water ratio. The results are reported in the plane water ratio ew -suction s for the same water content (Figure 7a) and the same void ratio (Figure 7b). As the void ratio decreases, the air entry value increases and the curves are steeper. This trend is consistent for the four gravimetric water content investigated (Figure 7a). The increase of the compaction water content let the curves more dispersed in the higher range of suctions (s ≥ 100 kPa).
The driest samples (w = 13%) shows a more rigid behaviour before the air entry value, after that curves are flatter than the more wetted sam-ples (Figure 7b). This behaviour persisting for the five void ratios explored. For the same compaction water content the form of the curves are similar while the void ratio affect the air entry values of the curves.
Here the heterogeneity of the pore system induced by the compaction process is taking into account using a multimodal retention model, defined by Durner (1994) as a linear superposition of sub-curves of the Van Genuchten (1980) type with the following equation:
E
e
e
e e
i
w
n
k
m
wE
E
we
wres wres i i i=
=
+
=
(
⋅
s
)
⎡ ⎣ ⎢ ⎡⎡ ⎢⎣⎣ ⎢⎢ ⎤ ⎦ ⎥ ⎤⎤ ⎥⎦⎦ ⎥⎥ ∑1
1
1
(2)where Ew is the effective water ratio equal to the
effective degree of saturation, k is the number of sub-system that assembled together give the global pore size distribution, wi are weighting factors for
each sub-curves subjects to 0 < wi< 1 and ∑wi= 1.
For the parameters of the sub-curves (αi, ni, mi)
Figure 6. Comparison samples with-without dissolved salt PSD* versus pore diameter: (a) w = 13%; e = 0.80; (b) w = 15%; e = 0.67; (c) w = 18%; e = 0.6; (d) w = 21%;
e = 0.6.
Figure 7. Drying path of Water Retention Curve deduced from MIP: (a) same water content.
must be imposed the condition αi> 0, mi > 0, ni
> 1. Here is imposed the additional constraint
ni= 1/(1-mi).
Each sub-curve in Equation 2 differentiated two times with respect to the suction s give the rela-tion between the sucrela-tion pressure at the inflecrela-tion point and the parameters given by the following expression: where
sp
s
i i m i m i=
1− α i is the suction atthe in-flection point in the Ew−s plane. Obtained αi
from Equation (3) and substituting in equation (2) the water storage mechanisms in an heterogeneous porous medium became:
E
e
e
e e
w
m
s
s
m
i
wE
E
we
wres wres im
i pi i=
=
w
+
i
−
=
⎛ ⎝ ⎜ ⎛⎛ ⎜ ⎝⎝ ⎜⎜ ⎞ ⎠ ⎟ ⎞⎞ ⎟ ⎠⎠ ⎟⎟ ⎡ ⎣ ⎢ ⎡⎡ ⎢ ⎢⎢ ⎢ ⎢⎣⎣ ⎢⎢ ⎤ ⎦ ⎥ ⎤⎤ ⎥ ⎥⎥ ⎥ ⎥⎥ ⎥⎦⎦ ⎥⎥1
1 1
1
/
k
k
m
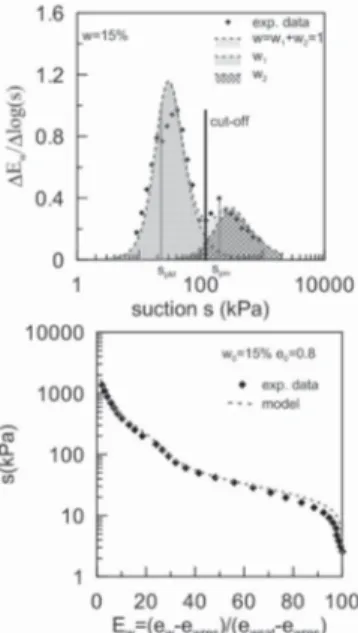
i ∑ (3) The equation 2 is used for model the WRC data obtained by MIP. The experimental data are modelled with a bi-modal water retention model, obtained setting k = 2 in the above equation.The pore capillary density function (PCF) is de-fined as: PCF = ΔEw/Δlog(s) where Ew is the
effec-tive degree of saturation as defined above.
The model is calibrated best fitting the PCF obtained by experimental results as reported in Figure 8a. The area below the peak of lower suction is de-fined as w1 (macro area below the PCF) while
Figure 8. Laboratory versus model prediction: (a) Pore capillary function (PCF) macro micro; (b) WRC derived from PCF (Casini et al., 2012).
Figure 9. Comparison model—data for different gravimetric water content.
w2 (micro area) is given by w2= 1−w1 because the
area below the curve corresponds to the unity. The suction at inflection points are named respectively spM and spm as reported in Figure 8a (Casini et al.,
2012).
The parameters obtained by the multimodal model have been calibrated as a function of void ratio and gravimetric water content.
A comparison between the model prediction and the experimental data is reported in Figure 8b, the model well fit the experimental results in the entire range of suction. Furthermore the model is able to well capture the change in shape of the retention curve at the inflection points for all the water content investigated (Fig. 9).
The data of drying path obtained under suction con-trolled conditions under oedometer condi-tions has been compared with the model predic-tion in Figure 10. Two drying curves have been
Figure 10. Comparison along drying paths between experimental data under suction controlled conditions and model predictions (Casini et al., 2012).
simulated, one for the path at lower density (void ratio at the beginning of the drying path e0 = 0.80) and the second for the path at higher density (void ratio e0 = 0.73). Curves have been normalised in order to fit the initial and final water contents of each path. The evolution is reasonable reproduced by the model for both changes in suction and verti-cal load.
4 CONCLUSION
An extended microstructural investigation (MIP and ESEM) have been performed on Jossigny silt statically compacted at different initial void ratio and water content. The objective was a deeper under-standing of the evolution of microstruc-tures changing on a silty soil and its consequences on the water retention properties. As highlighted by the experimental results the shape of the pore size distribution is induced by the compaction water content. The PSD is monomodal for the dri-est tdri-ested conditions, because the water is not in half to form aggregates for this kind of soil. The aggregates increasing in size and uniformity with the water content until to cover the silt/sand parti-cles for the wettest tested conditions moving back to a quasi monomodal distribution.
Some tests were also repeated adding dissolved salt (NaCl) in the water. The salt has been used as an artificial manner to understand the evolution of double porosity. The swelling of aggregates has been inhibited by the salt, the microstructure has been blocked by the interaction between salt and clay fraction. During the drying the salt is depos-ited, it is a way to investigate the stability of smaller pores with an electrolitical solution.
The drying path of the water retention curve obtained by MIP has been modelled with a multi-modal retention model, where the weighted param-eters are related to the area below the pore capillary distribution and the suctions at inflection points to the peak value of the distribution. The agreement be-tween the measured and the estimated WRC indicates that the multimodal prediction method lead to more realistic estimation of the retention properties of soils. The model parameters are related to the pore capillary distribution and have a clear physical meaning.
The comparison between the WRCs obtained with MIP and oedometer under suction control-led condition were satisfactory. The two approach gives results in agreement under the same initial conditions, while some difference are highlight due to the change of microstructures induced by dif-ferent stress path followed between oedometer and MIP tests.
The model is quite simple and must be validated for such engineering application involved com-pacted soils where a commonly applied unimodal retention function is inadequate for conductivity estimation because they lack the necessary flexibil-ity in the range of characteristic pores.
REFERENCES
Casini, F. (2008). Effetti del grado di saturazione sul comporta-mento meccanico di un limo, PhD Thesis, Universitá degli Studi di Roma “La Sapienza”, Italy. Casini, F. (2012). Deformation induced by wetting:
a simple model. Canadian Geotechnical Journal 49, 954–960.
Casini, F. (2012). Hydromechanical behaviour of a silty sand from a steep slope triggered by artificial rainfall: from un-saturated to saturated conditions. Canadian Geotechnical Journal, in print ISSN 0008-3674. Casini, F., Vaunat J., Romero E. and Desideri, A.
(2012). Conse-quences on water retention properties o fdouble-porosity features in a compacted silt. Acta Geotechnica 7: 139–150 DOI10.1007/s11440-012-0159-6.
Cui Y.J. (1993). “Etude du comportement d’un limon non saturé et de sa modélisation dans un cadre élasto-plastique” PhD Thesis, ENPC, Paris, France. Cui, Y.J. and Delage, P. (1996). Yielding and plastic
behavior of an unsaturated compacted silt. Géotech-nique 46, No. 2, 291–311.
D’Onza, F., Gallipoli, D., Wheeler, S., Casini, F., Vaunat, J., Khalili, N., Laloui, L., Mancuso, C., Masin, D., Nuth, M., Pereira, J.M. and Vassallo, R. 2011. Benchmark of consti-tutive models for unsatu-rated soils. Géotechnique 61(4): 283–302.
Durner, W. (1994). Hydraulic conductivity estimation for soils with heterogeneous pore structure. Water Resources Research 30(2): 211–223.
Monroy, R., Zdravkovic, L. and Ridley, A. (2010). Evolution of micro-structure in compacted London Clay during wetting and loading. Géotechnique 60(2): 105–119.
Romero, E. and Vaunat, J. (2000). Retention curves of deformable clays. Proc Int Workshop on Unsat Soils: Exp evid and Theor Approaches, Trento (Italy), Balkema: 91–106.
van Genuchten, M.T. (1980). A closed-form equation for predicting the hydraulic conductivity of unsatu-rated soil. Soil Science Society American Journal, 44: 892–898.
Vaunat, J., Romero, E. and Jommi, C. (2000). An elas-toplastic hydro-mechanical model for unsaturated soils Proc Int Workshop on Unsat Soils: Exp evid and Theor Approaches, Trento (Italy), Balkema: 121–138.