2020-08-20T09:54:56Z
Acceptance in OA@INAF
ALMA imaging of C2H emission in the disk of NGC 1068
Title
García-Burillo, S.; Viti, S.; Combes, F.; Fuente, A.; Usero, A.; et al.
Authors
10.1051/0004-6361/201731862
DOI
http://hdl.handle.net/20.500.12386/26734
Handle
ASTRONOMY & ASTROPHYSICS
Journal
608
Number
DOI:10.1051/0004-6361/201731862 c ESO 2017
Astronomy
&
Astrophysics
ALMA imaging of C
2
H emission in the disk of NGC 1068
S. García-Burillo
1, S. Viti
2, F. Combes
3, A. Fuente
1, A. Usero
1, L. K. Hunt
4, S. Martín
5, 6, M. Krips
7, S. Aalto
8,
R. Aladro
8, 9, C. Ramos Almeida
10, 11, A. Alonso-Herrero
12, V. Casasola
4, C. Henkel
9, 13, M. Querejeta
1, 14, R. Neri
7,
F. Costagliola
8, L. J. Tacconi
15, and P. P. van der Werf
16(Affiliations can be found after the references) Received 30 August 2017/ Accepted 18 September 2017
ABSTRACT
Aims.We study the feedback of star formation and nuclear activity on the chemistry of molecular gas in NGC 1068, a nearby (D= 14 Mpc) Seyfert 2 barred galaxy, by analyzing whether the abundances of key molecular species such as ethynyl (C2H), which is a classical tracer of photon dominated regions (PDR), change in the different environments of the disk of the galaxy.
Methods. We used the Atacama Large Millimeter Array (ALMA) to map the emission of the hyperfine multiplet of C2H(N = 1−0) and its underlying continuum emission in the central r ' 3500
(2.5 kpc) region of the disk of NGC 1068 with a spatial resolution 100.0 × 000.7 ('50−70 pc). We used maps of the dust continuum emission obtained at 349 GHz by ALMA to derive the H2gas column densities and combined these with the C2H map at matched spatial resolution to estimate the fractional abundance of this species. We developed a set of time-dependent chemical models, which include shocks, gas-phase PDRs, and gas-grain chemical models to determine the origin of the C2H gas.
Results.A sizeable fraction of the total C2H line emission is detected from the r ' 1.3 kpc starburst (SB) ring, which is a region that concentrates the bulk of the recent massive star formation in the disk traced by the Paα emission complexes imaged by the Hubble Space Telescope (HST). However, the brightest C2H emission originates from a r ' 200 pc off-centered circumnuclear disk (CND), where evidence of a molecular outflow has been previously found in other molecular tracers imaged by ALMA. We also detect significant emission that connects the CND with the outer disk in a region that probes the interface between the molecular disk and ionized gas outflow out to r ' 400 pc. We derived the fractional abundances of C2H (X(C2H)) assuming local thermodynamic equilibrium (LTE) conditions and a set of excitation temperatures (Tex) constrained by the previous multiline CO studies of the galaxy. Our estimates range from X(C2H) ' a few 10−8 in the SB ring up to X(C2H) ' a few 10−7 in the outflow region. The PDR models that incorporate gas-grain chemistry are able to account for X(C2H) in the SB ring for moderately dense (n(H2) ≥ 104 cm−3) and moderately UV-irradiated gas (UV-field ≤ 10 × Draine field, where 1 Draine field ≡ 2.74 × 10⁻³ erg s−1 cm−2) in a steady-state regime, which depending on the initial and physical conditions of the gas may be achieved by 105yr or as late as 107 yr. However, the high fractional abundances estimated for C2H in the outflow region can only be reached at very early times (T ≤ 102−3yr) in models of UV or X-ray irradiated dense gas (n(H2) ≥ 104−5cm−3).
Conclusions.We find that the transient conditions required to fit the high values of X(C2H) in the outflow are likely due to UV or X-ray irradiated non-dissociative shocks associated with the highly turbulent interface between the outflow and molecular gas in NGC 1068. Although the inferred local timescales are short, the erosion of molecular clouds by the active galactic nucleus (AGN) wind and/or the jet likely resupplies the interface working surface continuously, making a nearly steady state persist in the disk of the galaxy.
Key words. galaxies: individual: NGC 1068 – galaxies: ISM – galaxies: kinematics and dynamics – galaxies: nuclei – galaxies: Seyfert – radio lines: galaxies
1. Introduction
Multiline observations of different molecular tracers can probe the feedback of star formation and/or nuclear activity on the chemistry and energy balance of the interstellar medium of galaxies. There is mounting observational evidence suggesting that the excitation and chemistry of the main molecular species in active galactic nuclei (AGN) are different with respect to those found in purely star-forming galaxies (“starbursts”, SBs) (e.g.,Tacconi et al. 1994;Kohno et al. 2001;Usero et al. 2004;
Martín et al. 2006; Krips et al. 2008; Aladro et al. 2011,2013;
Imanishi & Nakanishi 2013). Recent progress in the capabilities of millimeter and submillimeter telescopes has made a large set of molecular line transitions from various species, beyond CO line studies, detectable in the nearest sources. These observa-tions can be used to analyze the physical and chemical proper-ties of the different gas components within a galaxy along with its dominant energetics.
The C2H (ethynyl) multiplet at 3 mm has a critical density
of 2 × 105 cm−3 at Tk = 100 K (not including radiative
trap-ping effects) and hence traces relatively dense gas. However,
as for other molecular transitions (e.g.,Shirley 2015), the ef-fective excitation density of the C2H multiplet, which is defined
as that producing emission strong enough to be observed (above a ∼1 K km s−1 detection threshold in Shirley’s study), can be up to a factor of 10 lower. The emission of C2H has been
de-tected in a wide variety of molecular cloud environments in our Galaxy from dense Galactic cores (n(H2) ≥ 105−6 cm−3) to
more diffuse clouds (n(H2) ≤ 104−5 cm−3). In the early
stud-ies of Galactic molecular clouds the abundances of ethynyl, de-fined as X(C2H) ≡ N(C2H)/N(H2), were seen to increase from
dense gas, where X(C2H) ' (1−60)×10−10(Wootten et al. 1980;
Huggins et al. 1984;Watt 1983;Watt et al. 1988), to diffuse and translucent gas clouds, where X(C2H) ' 2 × 10⁻⁸(Turner et al.
1999). The reason behind this trend is that in diffuse molecular gas CO can be more easily dissociated by UV photons. This pro-cess releases carbon for C2H formation and increases the
abun-dance of this species in the gas phase, as predicted by stationary-state chemical models (e.g.,Sternberg & Dalgarno 1995).
Because of the key role of UV photons, the chemistry of C2H
is generally linked to ionized carbon, so that its abundance is a good tracer of the UV-pervaded outer boundary (AV = 1−5m) of
Galactic molecular clouds, known as photon dominated regions (PDR), where X(C2H) ≥ 10−8 (Fuente et al. 1993; Pety et al.
2005;Beuther et al. 2008;Walsh et al. 2010;Pilleri et al. 2013;
Cuadrado et al. 2015). The changes in ethynyl abundances have also been interpreted in terms of chemical evolution in time-dependent models, where chemically younger regions at lower densities would favor higher abundances of C2H (Li et al. 2012;
Pan et al. 2017). Alternatively, Bayet et al. (2011b,a), showed that C2H can be a tracer of regions influenced by the
dissipa-tion of turbulence and waves, heating the gas and accelerating cosmic rays.
The abundance of C2H has also been found to be comparable
to that of molecular species, such as HCN or HCO+, in a wide variety of external galaxies, i.e., X(C2H) ≥ 10−9−10−8. These
extragalactic observations include SBs (Henkel et al. 1988;
Wang et al. 2004; Meier & Turner 2005; Martín et al. 2006;
Aladro et al. 2011;Nakajima et al. 2011;Meier & Turner 2012;
Meier et al. 2015), AGNs (Bayet et al. 2011a; Nakajima et al. 2011; Aladro et al. 2013; Martín et al. 2015), low-metallicity objects (Heikkilä et al. 1999), ultraluminous infrared galaxies (ULIRGs;Costagliola et al. 2011) and isolated normal galaxies (Martín et al. 2014). Although the detection of significant C2H
emission in galaxies has been generally linked to PDR chemistry in star-forming regions, other scenarios that point more specif-ically to outflow-driven chemistry could provide an alternative explanation to the detection of ethynyl in the molecular outflow of Maffei 2 published byMeier & Turner(2012).
NGC 1068 is a prototypical nearby (D ' 14 Mpc) Seyfert 2 galaxy, which has been the subject of numerous observational campaigns conducted with single-dish telescopes devoted to studying the fueling of its central region and related feedback using molecular line observations (e.g.,Usero et al. 2004;Israel 2009; Kamenetzky et al. 2011; Hailey-Dunsheath et al. 2012;
Aladro et al. 2013). NGC 1068 is an archetype of a compos-ite SB/AGN galaxy. High-resolution observations of CO, and of more specific tracers of dense gas such as HCN, HCO+, CS, and SiO, have proved that interferometers are needed to disentangle the SB/AGN components in the circumnuclear re-gion of this galaxy by spatially resolving the distribution, kine-matics, and excitation of molecular gas (Tacconi et al. 1994;
Schinnerer et al. 2000; García-Burillo et al. 2010; Krips et al. 2011; García-Burillo et al. 2014, 2016; Takano et al. 2014;
Nakajima et al. 2015; Imanishi et al. 2016; Gallimore et al. 2016).
García-Burillo et al. (2014) used the Atacama Large Mil-limeter Array (ALMA) to map the emission of a set of dense molecular gas tracers (CO(3–2), CO(6–5), HCN(4−3), HCO+(4−3), and CS(7–6)) in the central r ∼ 2 kpc of NGC 1068 with spatial resolutions '0.300−0.500 (20–35 pc). The CO(3–2) line emission in the ALMA map stems from three regions: 1) the circumnuclear disk (CND); 2) the bar; and 3) the SB ring. Most of the CO(3–2) flux in the ALMA map ofGarcía-Burillo et al.
(2014) comes from the SB ring, which is a two-armed spi-ral structure that starts from the ends of the stellar bar and forms a molecular gas pseudo-ring at r ∼ 1800 (∼1.3 kpc). The
SB ring concentrates the bulk of the massive star formation in the galaxy. The CND is an elliptical ring of 350 pc diame-ter that is off-centered relative to the AGN. In the immediate vicinity of the CND, the CO(3–2) emission is detected in an arc-like component on the northeastern side of the disk at dis-tances r ' 5−600 (400 pc) from the AGN. The anomalous ve-locities measured both in the arc feature and the CND reveal an AGN-driven massive molecular outflow.García-Burillo et al.
(2014) concluded that the molecular outflow is launched when
the ionization cone of the narrow line region (NLR) sweeps the disk in the CND and further to the north in the bow-shock arc. More recently, ALMA observations of the CND in the CO(6−5), HCN(3–2), and HCO+(3−2) lines, carried out with spatial res-olutions '4−10 pc, have been able to isolate and image the dust continuum and molecular line emission from a '7−10 pc– diameter disk, which represents the submillimeter counterpart of the putative AGN torus of this galaxy (García-Burillo et al. 2016;Imanishi et al. 2016;Gallimore et al. 2016).
Molecular line ratios analyzed by García-Burillo et al.
(2014) and Viti et al. (2014) are significantly different in the SB ring and the CND. The change in molecular line ratios in-side the CND indicate that radiative and mechanical feedback from the AGN has dramatically changed the physical conditions of molecular gas and chemical abundances of some molecular species in the outflow region (see also Kelly et al. 2017). The SB ring is colder and less dense than the CND and there are also differences in their chemistry (Viti et al. 2014).
The emission of the C2H multiplet in the disk of NGC 1068
was first observed byCostagliola et al.(2011) andAladro et al.
(2013) with the IRAM 30 m single-dish telescope. In particu-lar,Aladro et al.(2013) used a chemical model to reproduce the average C2H abundances derived from their data but they were
not able to discern whether the C2H emission was arising from
PDRs, dense or shocked gas owing to the insufficient spatial res-olution of these single-dish observations ('2900). In this work we use the unique high spatial resolution (≤100) and sensitivity
capa-bilities of ALMA to image the emission of C2H in the different
environments of the NGC 1068 disk. We also use a set of newly developed shock models, gas-phase PDR models, and gas-grain chemical models to account for the abundances derived for C2H.
Hereafter we assume a distance to NGC 1068 of D ' 14 Mpc (Bland-Hawthorn et al. 1997); the latter implies a spatial scale of '70 pc/00.
2. Observations
2.1. ALMA data
We observed the emission of the hyperfine multiplet of C2H(N=
1−0) in the central r ' 3500 (2.5 kpc) region of the disk of NGC 1068 with ALMA during Cycle 2 (project-ID: #2013.1.00055.S; PI: S. García-Burillo). We used Band 3 re-ceivers and a single pointing. We observed one track in Au-gust 2015 with 34 antennas with projected baselines ranging from 12 m to 1430 m. The phase tracking center was set to α2000 = 02h42m40.771s, δ2000 = −00◦00047.8400, which is the
center of the galaxy according to SIMBAD taken from the Two Micron All Sky Survey – 2MASS survey (Skrutskie et al. 2006). The tracking center is offset by ≤100 relative to the AGN position, α2000 = 02h42m40.71s, δ2000 = −00◦00047.9400
(Gallimore et al. 1996, 2004,2016; García-Burillo et al. 2014,
2016; Imanishi et al. 2016). The CND and the SB ring of NGC 1068 are both located inside the central r ' 2500(1.8 kpc)
of the disk, i.e., well inside the field of view of the 7000FWHM primary beam of the single-pointed observations.
We used four spectral windows each with a bandwidth of 1.875 GHz and a spectral resolution of '0.98 MHz (3.4 km s−1).
Two of these windows were placed in the lower side band (LSB) and the other two in the upper sideband (USB). The lowest fre-quency window of the LSB was centered on the sky frefre-quency 86.3082 GHz. This setup allowed us to observe the whole hy-perfine set of lines of C2H. The C2H (N = 1−0) multiplet,
hereafter referred to as C2H (1−0), comprises six hyperfine
Table 1. Line components of the C2H(N= 1−0) multiplet.
Fine structure group Hyperfine structure line Frequency (GHz) Line strength (Sij)
Group-I J= 3/2 − 1/2, F = 1−1 87.284 0.17 Group-I J= 3/2 − 1/2, F = 2−1 87.317 1.67 Group-I J= 3/2 − 1/2, F = 1−0 87.329 0.83 Group-II J= 1/2 − 1/2, F = 1−1 87.402 0.83 Group-II J= 1/2 − 1/2, F = 0−1 87.407 0.33 Group-II J= 1/2 − 1/2, F = 1−0 87.447 0.17
Notes. Frequencies taken from the Cologne Database for Molecular Spectroscopy (CDMS; Endres et al.2016).
group-I and group-II in Table 1. For the typical linewidths ob-served in NGC 1068 we can resolve the two fine groups in ve-locity, but not the lines they consist of. If the opacity of the lines is low, we expect that the strongest hyperfine component cor-responds to J = 3/2−1/2, F = 2−1 at ν = 87.317 GHz (rest frequency). We therefore take this frequency as the reference for the velocity scale, which is hereafter derived relative to vHELsys =
1136 km s−1(García-Burillo et al. 2016).
We calibrated the data via the ALMA reduction package CASA1. The calibrated uv tables were transformed to GILDAS2 -readable format where the mapping and cleaning were per-formed. The angular resolution obtained using natural weighting was 100. 0 × 000. 7 (70 pc × 50 pc) at a position angle PA = 69◦in the
line and continuum data cubes. The conversion factor between Jy beam−1 and K is 240 K Jy−1 beam. The line data cube was binned to a frequency resolution of '2.92 MHz ('10 km s−1).
The estimated 1σ rms in the line data cube, derived in line-free emission areas, is '0.4 mJy beam−1 in '10 km s−1 channels.
An image of the continuum emission at a mean frequency of 86.3 GHz was obtained by averaging 60 channels ('600 km s−1) free of line emission around the C2H. The corresponding point
source sensitivity for the continuum is 80 µJy beam−1. All the maps were corrected for the attenuation by the primary beam, assuming a FWHM of 7000 for the latter. We estimate that the absolute flux accuracy in the maps is about 10–15%.
As our observations do not contain short-spacing correction, we expect to start filtering out an increasing fraction of the line and continuum emissions on scales >400; the latter corresponds to the expected largest angular scale of the emission that can be recovered in the ALMA maps used in this work. This likely affects the faint emission that extends on large scales in the inter-arm region.Costagliola et al.(2011) measured in NGC 1068 an integrated flux for the C2H multiplet of Ta∗∆v ' 8 ± 2 K km s−1
(47 ± 12 Jy km s−1) inside the 2900IRAM-30 m telescope beam
at 86.3 GHz. This is similar to the flux estimated byAladro et al.
(2013), i.e., '7 K km s−1. The corresponding flux measured by
ALMA for the same aperture is '35 ± 5 Jy km s−1, which is '75−85% of the 30 m flux estimates. The clumpiness of the C2H-emitting gas that we observe in the SB ring and the CND,
aided by the velocity structure of the emission, explains why we recover with ALMA most of the total C2H flux over these
re-gions. This scenario has been also tested for other molecular gas tracers mapped by ALMA in NGC 1068 (García-Burillo et al. 2014;Tosaki et al. 2017).
1 http//casa.nrao.edu/
2 http://www.iram.fr/IRAMFR/GILDAS
2.2. Ancillary data
We retrieved the HST NICMOS (NIC3) narrowband (F187N, F190N) data of NGC 1068 from the Hubble Legacy Archive (HLA) to obtain calibrated images for the Paα line emission. These images were completely reprocessed with a calibration pipeline as explained in detail in Sect. 2.2 ofGarcía-Burillo et al.
(2014). The pixel size of the HLA images is 000. 1 square.
We also use the CO(3−2) line and continuum maps of NGC 1068 obtained with ALMA during Cycle 0 using Band 7 receivers (project-ID: #2011.0.00083.S; PI: S. García-Burillo) and published by García-Burillo et al. (2014) and Viti et al.
(2014).
3. Results
3.1. Continuum map
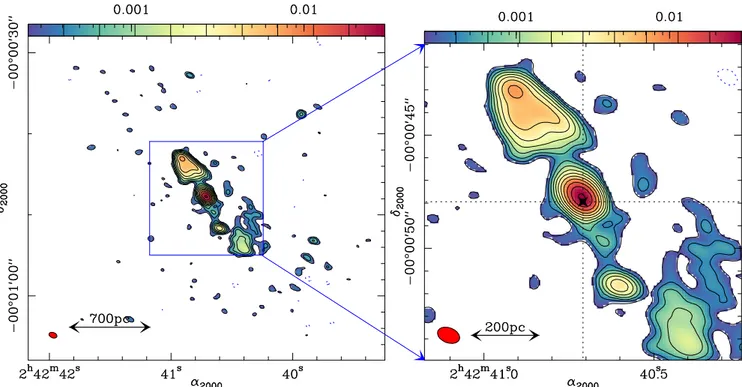
Figure 1 shows the continuum map derived at 86.3 GHz in NGC 1068. The bulk of the continuum emission stems from a highly structured elongated jet-like feature that emanates from the nucleus and extends out to r ' 900 along PA ' 30◦3. The emission comprises several components that are similar to those imaged in the high-resolution radio continuum maps of the galaxy obtained at cm wavelengths (Wilson & Ulvestad 1983,
1987;Ulvestad et al. 1987;Gallimore et al. 1996,2004). The brightest emission corresponds to an elongated nuclear spot close to the AGN. The nuclear spot was spatially resolved into a quadruple source in the previous subarcsecond radio con-tinuum maps ofGallimore et al.(1996,2004): this includes the source S1, identified as the AGN core, and sources S2, C, and NE, which are forming the inner section of a collimated jet that emits synchrotron emission. A similar elongated feature was identified byImanishi et al.(2016) in their 1.1 mm (266 GHz) continuum map obtained with ALMA.
On larger scales, we detected emission to the southwest of the nucleus from a hot spot at r ∼ 400and from a diffuse radio lobe spreading out from r ∼ 400 to r ∼ 900. The SW radio lobe
is bent to the W relative to the overall axis of the whole jet-like structure (PA ' 30◦). This distortion of the jet was interpreted by
Wilson & Ulvestad(1982) as the signature of the ram pressure of the rotating interstellar gas of the galaxy on the radio plasma. We also detected emission to the northeast of the nucleus from a radio lobe that exhibits a conical limb-brightened morphology (Fig.1). The VLA maps at 2 cm ofWilson & Ulvestad(1987) were the first to show this morphology for the northeast radio lobe, which was interpreted as the signature of a bow-shock wave driven into the interstellar material as it is compressed by the radio ejecta. The ALMA maps ofGarcía-Burillo et al.(2014) 3 At larger radii we detected a few isolated spots spread mainly across the SB ring; see Fig.5.
Fig. 1.Left panel: continuum emission map of NGC 1068 obtained with ALMA at 86.3 GHz. The map is shown in color scale with contour levels starting at –3σ (dashed contour), and continuing with logarithmic spacing from 3σ to 350σ in steps of 0.21 dex, where 1σ= 80 µJy beam−1. Right panel: same as left panel but zooming in on the inner region. The position of the AGN is highlighted by the star marker. The (red) filled ellipses at the bottom left corners in both panels represent the beam size of ALMA at 86.3 GHz (100.0 × 000.7 at PA = 69◦
).
showed an arc of gas and dust emission located at the edges of the northeast radio lobe. This gas feature, referred to as the bow-shock arc, has anomalous outward velocities interpreted as the result of the expansion of an AGN-driven molecular outflow in-side the disk of the galaxy (García-Burillo et al. 2014).
3.2. C2H map
Figure2shows the C2H(1–0) velocity-integrated intensity map
obtained with ALMA in the disk of NGC 1068. We integrated the intensities at each pixel inside the velocity interval defined by v − vHEL
sys ⊂ [−510, 200] km s−1. This window encompasses
any potential emission stemming from the four strongest hyper-fine components of C2H(1–0), which are expected to arise at
v − vHEL
sys ' 0, –40, –290, and –310 km s−1. When defining the
velocity window we further assumed that the disk rotation of NGC 1068 can cause a maximum velocity shift of the line of ' ± 200 km s−1around vHELsys (Schinnerer et al. 2000;Krips et al.
2011;García-Burillo et al. 2010,2014).
Figure3 shows the C2H(1–0) spectra extracted from a
rep-resentative set of positions that correspond to strong (>7σ in velocity-integrated units) emission knots in the outflow (OUT-I to OUT-(OUT-I(OUT-I(OUT-I) and the SB region (SB-(OUT-I to SB-(OUT-I(OUT-I(OUT-I). Because of the expected non-negligible velocity gradient inside the ALMA beam caused by rotation, non-circular motions, and turbulence, the individual hyperfine components of the fine groups are blended in all the spectra shown in Fig.3. We nevertheless re-solved in the line profiles the emission from the two fine struc-ture groups, which are shifted to each other by '300 km s−1.
Hereafter we define the main and secondary group of lines as the two strongest pairs of hyperfine lines that appear blended around hv−vsysiHEL ' –20 in group-I, and –300 km s−1(±200 km s−1) in
group-II, respectively (see Table1). No significant emission was detected from the two weakest hyperfine components of C2H in
the individual spectra, i.e., outside the range defined by the main and secondary groups. Emission from these satellite lines should lie at v − vHELsys '+110 and –450 km s−1(±200 km s−1) and likely
have intensities a factor of ∼10 lower than the strongest line of the C2H multiplet, unless the lines were mostly optically thick,
which is a scenario that we discard in Sect. 3.3. Therefore we conclude that the interval defined above to derive the velocity-integrated intensities of the C2H group of lines is not missing
any significant emission.
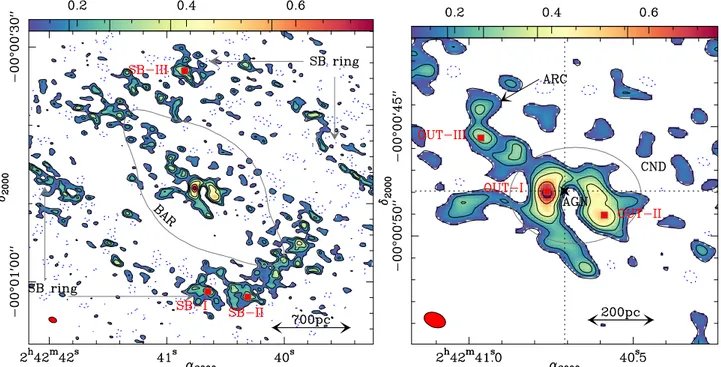
As shown by Fig.2, a sizeable fraction ('65%) of the total (spatially integrated) C2H line flux recovered by ALMA stems
from the SB ring region. Figure4shows the overlay of the Paα HST map on the C2H ALMA map. The SB ring concentrates the
bulk of the recent massive star formation in the disk traced by the Paα emission complexes associated with HIIregions. The emis-sion of C2H is mostly prominent at the southwestern end of the
SB ring, which is a region hosting an intense star formation ac-tivity characterized by strong Paα emission. The molecular line emission in the SB ring is very clumpy and it comes from cloud complexes of ≥100 pc-size.
However, the brightest C2H emission originates from the
CND. The morphology of the CND displayed by other molec-ular tracers imaged by ALMA (García-Burillo et al. 2014;
Takano et al. 2014;Tosaki et al. 2017) is to a large extent echoed by C2H: the CND appears as an elongated ring with two spatially
resolved knots of emission asymmetrically located east and west of the AGN locus (denoted as knots OUT-I and OUT-II, respec-tively; see Fig.2). The east and west knots are bridged by fainter emission north of the AGN. We also detected significant emis-sion that connects the CND with the outer disk: in the bow-shock arc region (including knot OUT-III; see Fig.2) to the northeast, and in two emission lanes east and south of the CND.
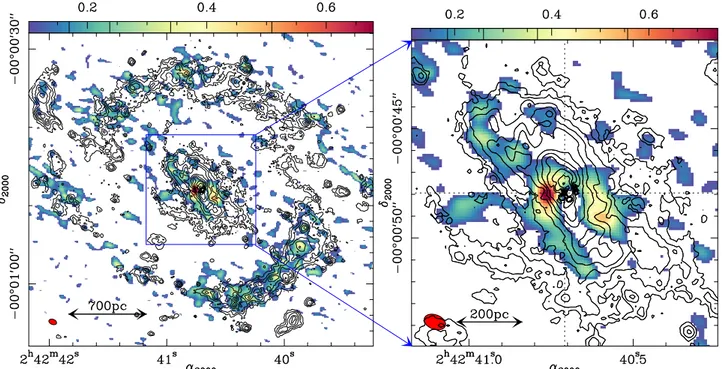
Figures 4 and 5 show in color contours the Paα and con-tinuum emission, respectively (same as in Fig.1), on the C2H
Fig. 2.Left panel: C2H(1–0) integrated intensity map obtained with ALMA in the disk of NGC 1068. The map is shown in color scale with contour levels –3σ (dashed contour), 3σ, 5σ, 7σ, 10σ, 15σ, and 20σ, where 1σ= 0.037 Jy km s−1beam−1. We identify the location of the SB ring and the bar. The latter is identified by a representative isophote of the NIR K-band image of 2MASS (Skrutskie et al. 2006). The (red) square markers highlight the positions of the knots SB-I, SB-II, and SB-III along the SB ring. Right panel: same as left panel but zooming in on the outflow region, which extends out to r ' 600
(400 pc), as described byGarcía-Burillo et al.(2014). The outflow region comprises the CND and the bow-shock arc. The position of the AGN (α2000= 02h42m40.71s, δ2000= −00◦00047.9400) is highlighted by the star marker. The (red) square markers highlight the positions of the knots OUT-I, OUT-II, and OUT-III. The (red) filled ellipses at the bottom left corners in both panels represent the C2H beam size (100.0 × 000.7 at PA = 69◦
).
Fig. 3.Upper panels: C2H emission spectra taken at three representative knots of the SB ring (SB-I, SB-II, and SB-III). Lower panels: C2H spectra taken at three representative knots of the outflow region (OUT-I, OUT-II, and OUT-III). The apertures used to extract the spectra correspond to the beam size at the location of each knot (100.0 × 000.7 at PA = 69◦
). The positions of the knots are defined in Fig.2. The velocity scale for each spectrum has been derived for the strongest C2H line at 87.317 GHz (rest frequency) and is relative to vHELsys = 1136 km s−1. The (red) curves show the composite Gaussian profiles of the best fit to the emission, as described is Sect.3.3.
Fig. 4.Left panel: overlay of the Paα emission HST map (contours) on the C2H(1–0) integrated intensity map (color scale as in Fig.2). Contours of Paα emission are shown with logarithmic spacing from 2.4 to 1600 counts s−1pixel−1in steps of 0.28 dex. Right panel: same as left panel but zooming in on the outflow region. The position of the AGN is highlighted by the star marker. The (red) filled ellipses at the bottom left corners in both panels represent the C2H beam size.
Fig. 5.Left panel: overlay of the continuum emission map of NGC 1068 obtained with ALMA at 86.3 GHz (contours) on the C2H(1–0) integrated intensity map (color scale as in Fig.2). Contours of continuum emission are shown with logarithmic spacing from 3σ to 350σ in steps of 0.21 dex, where 1σ= 80 µJy beam−1. Right panel: same as left panel but zooming in on the outflow region. The position of the AGN is highlighted by the star marker. The (red) filled ellipses at the bottom left corners in both panels represent the C2H beam size.
ALMA map. Figures 4 and 5 offer evidence that the C2H
emission lies at the edges of the AGN ionized nebulosity traced by Paα and radio continuum emission. García-Burillo et al.
(2014) analyzed the morphology and kinematics of molecular gas in this region, traced by the CO(3–2) line, and concluded that the NLR gas within the ionization cone is sweeping the ISM of the disk creating a coplanar molecular outflow out to a radius of 400 pc, i.e., a region that comprises the CND and the bow-shock
arc feature. The C2H line seems to probe better than CO the
in-terface between the molecular disk and the ionized gas outflow on the same spatial scales. Hereafter we thus refer to the region encompassing the CND and the bow-shock arc as the outflow region.
Figures 6a and b compare the morphology and kinemat-ics, respectively, of molecular gas in the outflow region derived from the C2H(1–0) and CO(3–2) images obtained by ALMA.
Fig. 6.Panel a: overlay of the C2H(1–0) integrated intensity map (with contours as in Fig.2) on the CO(3–2) integrated intensity map (with color scale expanding the range [3σ, 800σ], with 1σ= 0.22 Jy km s−1) ofGarcía-Burillo et al.(2014) in the central r= 1000
(700 pc) of NGC 1068. The (black) empty and (red) filled ellipses at the bottom left corner represent the C2H and CO beam sizes, respectively. Panel b: comparison of the average position-velocity (p − v) plot obtained for the outflow region in C2H(1–0) (black contours: −2.5σ (dashed contour), 2.5σ, 3.5σ, 5σ, to 9σ by 2σ, with 1σ = 0.18 mJy) and CO(3–2) (color scale: [2σ, 200σ], with 1σ = 1.3 mJy). The averaging has been done using the axes oriented along PA= 10◦
, 20◦ , 30◦
, 40◦ , and 50◦
(shown in a). The average outflow axis lies at PA= 30◦
. Blue contours represent the emission stemming from the secondary fine group of the C2H(1–0) multiplet (group-II). Offsets along the x-axis are measured in arc seconds relative to the AGN locus. Velocity scale is measured for the strongest C2H line at 87.317 GHz (rest frequency) and is relative to vHELsys = 1136 km s
−1. The black horizontal line indicates the edges of the CO(3–2) band.
The distribution of C2H shows a good correspondence with the
brightest emission clumps of CO in the outflow, both in the CND and bow-shock arc, although the emission of CO is compar-atively more widespread than that of C2H in this region (see
Fig.6a). Figure6b compares the emission of C2H and CO in
the outflow using the position-velocity (p − v) parameter space. With the objective of increasing the signal-to-noise ratio, which is more critical for C2H, the outflow p − v plot diagrams shown
in Fig.6b were derived by averaging the emission along the five axes shown in Fig. 6a, defined by PA = 10◦, 20◦, 30◦, 40◦, and 50◦. These axes cover a sizeable fraction of the emission
along the molecular outflow, which is oriented along PA = 30◦ (García-Burillo et al. 2014). Furthermore, with the aim of isolat-ing the non-circular motions associated with the outflow, we sub-tracted the rotation curve model ofGarcía-Burillo et al.(2014) projected along each individual p − v plot before averaging. As illustrated by Fig. 6b, the emission of C2H closely follows the
velocities associated with the CO outflow in this region. A sig-nificant fraction of the emission of both molecular tracers lies outside the expected range of virial motions attributable to rota-tion and dispersion: emission is up to ≥50−200 km s−1redshifted (blueshifted) on the northern (southern) side of the outflow out to r ' 600 (400 pc). This reflects the sign and the right order of magnitude of the mean-velocity field deviations seen in the CO(3–2) map ofGarcía-Burillo et al.(2014).
3.3. C2H line opacities
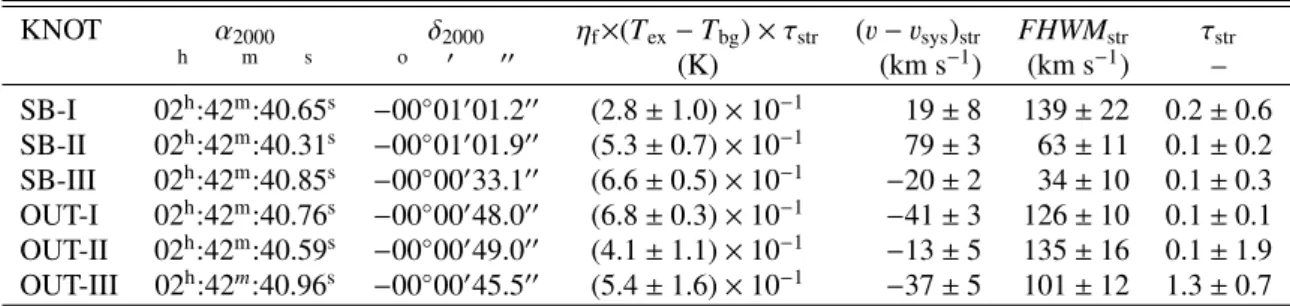
We performed a fit of the spectra shown in Fig.3using a comb of four Gaussian profiles that correspond to the strongest hyperfine
components of the C2H(1–0) multiplet. Among the
parame-ters to fit we assumed common widths and excitation tempera-tures, while optical depth ratios are based on the theoretical line strengths (Tucker et al. 1974). The velocity centroids and opti-cal depths of the strongest component (τstr) were taken as free
parameters. Table2lists the results obtained in the fit of the spec-tra shown in Fig.3. The fit provides the line parameters for the strongest line (J= 3/2−1/2, F = 2−1). We also derived the av-erage secondary-to-main velocity-integrated intensity ratios (R) for the CND, the bow-shock arc, and the SB ring. The optical depths derived from the fits of the two spectra located in the CND (OUT-I and OUT-II) are low, i.e., τstr ≤ 0.1 (±0.05). This
is in agreement with the average R ratio derived for the CND, hRi ' 0.49 ± 0.05, which is very close to the optically thin limit for R ('0.46). The optical depth derived for the knot OUT-III is nevertheless higher τstr ' 1.3 (±0.6); this result is in line with
the higher average R ratio measured in the bow-shock arc, i.e., hRi ' 0.70 ± 0.09. The optical depths derived for the SB knots (SB-I, SB-II, and SB-III) are low, i.e., τstr ≤ 0.1 − 0.2 (±0.1).
The corresponding average R ratio over the SB ring is also low hRi ' 0.56 ± 0.06.
We can therefore conclude that the lines of the C2H(1−0)
multiplet are mostly optically thin throughout the disk of NGC 1068 with the exception of the bow-shock arc region where opacities may be close to unity4.
4 In this scenario of low opacities the intensities of the weakest satellite lines would be at most at a level ≤2σ at the position of the strongest emission knot OUT-I.
Table 2. Parameters of C2H line fitting results. KNOT α2000 δ2000 ηf×(Tex− Tbg) × τstr (v − vsys)str FHWMstr τstr h m s o 0 00 (K) (km s−1) (km s−1) – SB-I 02h:42m:40.65s −00◦01001.200 (2.8 ± 1.0) × 10−1 19 ± 8 139 ± 22 0.2 ± 0.6 SB-II 02h:42m:40.31s −00◦01001.900 (5.3 ± 0.7) × 10−1 79 ± 3 63 ± 11 0.1 ± 0.2 SB-III 02h:42m:40.85s −00◦00033.100 (6.6 ± 0.5) × 10−1 −20 ± 2 34 ± 10 0.1 ± 0.3 OUT-I 02h:42m:40.76s −00◦00048.000 (6.8 ± 0.3) × 10−1 −41 ± 3 126 ± 10 0.1 ± 0.1 OUT-II 02h:42m:40.59s −00◦00049.000 (4.1 ± 1.1) × 10−1 −13 ± 5 135 ± 16 0.1 ± 1.9 OUT-III 02h:42m:40.96s −00◦00045.500 (5.4 ± 1.6) × 10−1 −37 ± 5 101 ± 12 1.3 ± 0.7
Notes. All the line parameters correspond to the strongest C2H(1−0) line (J = 3/2−1/2, F = 2−1) and are derived according to the procedure described in Sect.3.3as follows: Texis the excitation temperature, Tbgis the background temperature ('2.73 K), ηfis the unknown filling factor of the emission, (v − vsys)stris the velocity centroid of the line relative to vHELsys = 1136 km s−1, FHWMstris the half width at half maximum of the line, and τstris the estimated peak opacity.
3.4. C2H abundances
In this section we estimate the abundances of C2H relative to H2,
defined as X(C2H) ≡ N(C2H)/N(H2), both in the SB ring and in
the outflow region of NGC 1068.
To estimate the total column densities of C2H, N(C2H), we
assumed local thermodynamic equilibrium (LTE) conditions for the sake of simplicity. Under the assumption of LTE conditions, the C2H column densities can be obtained straightforwardly
from the intensities of the line. As the velocity-integrated in-tensities of the C2H multiplet derived in Sect. 3.2are a blend
of four lines, we first re-normalized the observed intensities by a factor '0.46 defined by the expected ratio of intensities of the strongest main line (J= 3/2−1/2, F = 2−1) to the whole multi-plet in the optically thin limit5. The validity of the hypothesis of low optical depths for C2H, which is central to the significance
of the LTE estimates, has been discussed in Sect.3.3. We also needed to assume a value for the excitation temperatures (Tex)
for the C2H emitting gas. As we only have one line multiplet
of C2H, we assumed a range of temperatures (Tex= 10–150 K)
that encompasses the total span of kinetic temperatures found by
Viti et al.(2014) in their large velocity gradient (LVG) fit of the multiline observations obtained for CO, HCN, and HCO+in the different environments of NGC 1068.
In LTE at temperature Texthe column density of the upper
level u of a particular transition is related to the total column density of the species via the Boltzmann equation,
N= NuZ
gue−Eu/kTex
, (1)
where N is the total column density of the species, Z is the parti-tion funcparti-tion evaluated for Tex, guis the statistical weight of the
level u, and Euis its energy above the ground state. If the
emis-sion is assumed to be optically thin, and if we adopt a filling factor of unity, the column density Nuis related to the observed
line intensity, Nu= 8πkν2I hc3A ul , (2)
where I is the velocity-integrated line intensity (in K km s−1)
and Aulis the Einstein coefficient that corresponds to a particular
transition, which in our case corresponds to the J = 3/2 − 1/2, F= 2−1 line of C2H.
5 In this scenario the factor is derived from the ratio '1/(1+0.5+0.5+ 0.2) ' 0.46.
Table 3. Fractional abundances of C2H in the SB ring and the outflow regions. SB ring Outflow Tex= 10 K (1.3 ± 0.7) × 10−8 (1.6 ± 0.8) × 10−8 Tex= 25 K (9.7 ± 4.0) × 10−8 (1.1 ± 0.4) × 10−7 Tex= 50 K (4.3 ± 2.0) × 10−7 (4.8 ± 2.0) × 10−7 Tex= 100 K (1.8 ± 0.8) × 10−6 (2.0 ± 0.8) × 10−6 Tex= 150 K (4.2 ± 2.0) × 10−6 (4.7 ± 2.0) × 10−6
Notes. Abundances are estimated from the C2H-(1−0) line with gas col-umn densities derived from the dust continuum emission at 349 GHz. We assume LTE conditions and a range of excitation temperatures as explained in Sect.3.4.
Furthermore, we estimated N(H2) from the ALMA dust
con-tinuum emission map of the galaxy obtained at 349 GHz by
García-Burillo et al. (2014) to derive X(C2H). These
observa-tions well probe the molecular gas column densities for the re-gions studied here: first, because the dust continuum emission at 349 GHz is mostly optically thin, and, second, because the con-tribution from atomic hydrogen to the total neutral gas content is negligible in the central r ' 3000' 2 kpc of the disk (Brinks et al.
1997;García-Burillo et al. 2014). We used a modified blackbody law to derive the dust mass (Mdust). In this approach, the fluxes
measured in a given aperture, S349 GHz, can be expressed as
S349 GHz= Mdust×κ349 GHz× B349 GHz(Tdust)/D2, where the
emis-sivity of dust at 349 GHz, κ349 GHz ' κ352 GHz ' 0.09 m2 kg−1
(Klaas et al. 2001), Bν(Tdust) is the Planck function, and D is the
distance.
The value of Mdustper beam was used to predict the
associ-ated molecular gas column density map. To this aim, we applied the linear dust/gas scaling ratio of Draine et al. (2007) to the gas-phase oxygen abundances measured in the central 2 kpc of NGC 1068 (∼12+ log(O/H) ∼ 8.8;Pilyugin et al. 2004,2007), which yields a gas-to-dust mass ratio of ∼60+30−30(see discussion inGarcía-Burillo et al. 2014). Finally, we degraded the spatial resolution of the resulting column density map to match that of the C2H map prior to obtaining a map for X(C2H).
Table3lists the mean fractional abundances of C2H as
esti-mated by our LTE analysis for the reported range of Tex. In the
interest of exploring any potential difference between the SB and outflow, we spatially averaged X(C2H) inside these two regions,
as defined in Sect.3.2. As expected, the values of X(C2H)
de-pend heavily on the assumed Tex. For a given Tex, the abundance
in the SB ring; with a common lower limit of X(C2H) ' a few
10−8, for the lowest temperature we assumed T
ex= 10 K. This
is close to the formal lower limit on Tex≥ 8 K, which is derived
from the values fitted for ηf × (Tex− Tbg) × τstr that are listed
in Table3. This lower limit is formally obtained by assuming a very conservative upper limit on the filling factors ηf ≤ 1. All in
all, the reported high abundances of C2H found in the SB ring
and outflow for Tex= 10 K are both comparable to those found
in Galactic and extragalactic PDRs associated with massive star formation. However, although this scenario seems plausible in the SB ring, where molecular gas is currently feeding a massive star formation episode in NGC 1068, the evidence of a simi-lar level of star formation activity that may sustain these high abundances of C2H in the molecular outflow is less clear. This
suggests that a different mechanism is at play in this region. For temperatures Tex≥ 25 K the derived C2H abundances lie
in the range X(C2H) '10−7−10−6. These higher temperatures are
specifically required to fit the multiline CO dataset of the out-flowing CND (Viti et al. 2014). In particular,Viti et al. (2014) used LTE to conclude that the rotational temperature, Trot, of
the CO emitting gas in the CND ' 40−60 K. This is also in excellent agreement with the values of the dust temperature re-quired to fit the SED of dust emission in the outflow region out to r ≤ 400 pc, where Tdust ' 46 ± 3 K (García-Burillo et al.
2014). Furthermore Viti et al.(2014) used non-equilibrium ra-diative transfer schemes (RADEX) to conclude that the kinetic temperature of molecular gas traced by CO lines in the outflow is significantly high, i.e., ≥100 K. In contrast, a similar analysis suggests that kinetic temperatures of molecular gas are compar-atively a factor '2−3 lower in the SB ring.
In order to nail down more accurately how X(C2H) changes
in the different environments of NGC 1068, we would need to estimate Tex for C2H independently by observing at least 1–2
higher N transitions. However, if we assume that the excitation of C2H follows a pattern similar to the rest of molecular species,
the observational evidence discussed above suggests that Texis
likely a factor of 2–3 higher in the outflow region compared to the SB ring, and, also, that '10 K is a conservative lower limit for Texin either case. We therefore adopt the following reference
values for X(C2H): ' a few 10−8in the SB ring for Tex' 10 K,
and ' a few 10−7in the outflow region for T
ex' 25−50 K.
4. Origin of the C2H abundances
In this section we aim to account for the range of abundances derived in Sect. 3.4 for C2H in the SB ring and outflow
re-gion of NGC 1068 using a set of time-dependent gas-grain chemical models, parametrized shock models, and gas-phase PDR models.
4.1. Chemical models: description
A comprehensive chemical modeling of the C2H molecule is
beyond the scope of this observational paper. Moreover, we are aware of the limitations of having observed only one N transition of the C2H multiplet, leading to an uncertain
deriva-tion of the fracderiva-tional abundance. Hence we can only quali-tatively discuss the origin of this emission and its potential role as a tracer of distinct gas components. We used and aug-mented the grid of chemical models from Viti(2017) run with the UCL_CHEM time dependent gas-grain chemical model (Viti et al. 2011), which includes a parametrized shock module (Jiménez-Serra et al. 2008) and a very small grid of PDR mod-els taken fromBell et al.(2006) andVasta et al.(2010), run with
the UCL_PDR code. We assumed for all the models a solar C/O abundance ratio ∼0.6. Below we briefly present the codes, which are more extensively described in the above references.
The code UCL_CHEM6is a time dependent gas-grain chem-ical model that computes the evolution of chemchem-ical abundances of the gas and on the ices as a function of time, starting from a diffuse and atomic gas. The code is coupled with the parametrized shock model of Jiménez-Serra et al. (2008). The code is run in two distinct temporal phases denoted as Phase I and Phase II. The initial density in Phase I is ∼10 cm−3. The gas is allowed to collapse and reach a high density by means of a free-fall collapse process. In this context the collapse is not meant to represent the formation of protostars, but it is simply a way to compute the chemistry of high density gas in a self-consistent way starting from a diffuse atomic gas, i.e., without assuming the chemical composition at its final den-sity. The temperature during this phase is kept constant at 10 K and the cosmic-ray ionization rates and radiation fields are at their standard Galactic values (ζ0= 5 × 10⁻¹⁷s−1and 1 Draine
field ≡ 2.74 × 10⁻³ erg s−1cm−2, respectively). During Phase I
atoms and molecules are allowed to freeze onto the dust grains and react with each other, forming icy mantles. Nonthermal des-orption is also included. In Phase II, for the non-shock models, UCL_CHEM computes the chemical evolution of the gas and the icy mantles after either an assumed burst of star formation or an AGN activity episode has occurred. The temperature of the gas increases from 10 K to a value set by the user, and thermal sub-limation from the icy mantles occurs. The chemical evolution of the gas is then followed for 107yr. In the shock models, Phase II
considers a plane-parallel C-shock propagating with a velocity, Vs, through the ambient medium.
One of the effects of the AGN activity on the gas is an enhanced cosmic-ray and/or X-ray ionization rate. The grid of models we employed fromViti(2017) uses the cosmic-ray ion-ization flux to simulate an enhancement in X-ray flux as well. Although this approximation has its limitations in that the X-ray flux ionizes and heats the gas more efficiently than cosmic rays, the chemistry arising from these two fluxes should be similar and the chemical trends are the same for cosmic rays and X-rays for a fixed gas temperature, which is what is assumed in these models (see alsoViti et al. 2014).
While some of the models from the UCL_CHEM grid may be considered as representative of PDR models, since the ra-diation field is enhanced enough to penetrate great depths and hence affect the chemistry, we also considered a very small grid of pure gas-phase PDR models at lower gas density. The lat-ter would be more representative of the diffuse and translucent clouds where C2H has been observed at fractional abundances
of ∼10−8(e.g.,Turner et al. 1999) and where the temperature is
highly affected by the UV radiation field. These models were run with a self-consistent PDR model: the UCL_PDR code is a 1D time dependent PDR code. It was first developed by Bell et al. (2005,2006) and further augmented byBayet et al.(2012) andPriestley et al.(2017). The code assumes a semi-infinite slab geometry and computes the chemistry and temperature as func-tions of depth and time within the semi-infinite slab. The chem-istry and thermal balance are calculated self-consistently at each depth point into the slab and at each time-step, producing chemi-cal abundances, emission line strengths, and gas temperatures as a function of depth and time. The code has been benchmarked (Röllig et al. 2007).
6 Now publicly available athttps://uclchem.github.ioand pub-lished inHoldship et al.(2017).
Table 4. Grid of PDR models (UCL_PDR). Model ζ χ nH (ζ0) (Draine field) (cm−3) 48 1.0 10 103 49 1.0 100 103 50 1.0 1000 103 51 10 100 103
Notes. Column (1) lists the model number. Columns (2) and (3) list the cosmic-ray ionization rates (ζ) and radiation fields (χ), respectively, in units of their standard Galactic values (ζ0= 5 × 10⁻¹⁷s−1and 1 Draine field ≡ 2.74 × 10⁻³erg s−1cm−2). Column (4) lists the hydrogen gas density (nH). For the PDR models the temperature varies with depth and is not listed.
4.2. Chemical models: results
Tables 4–6 list, respectively, the parameters of the grid of UCL_PDR, UCL_CHEM, and shock models we considered. We computed all our models with solar abundances.
We note that none of the pure gas-phase low density (103cm−3) PDR models (Models 48−51; Table4), at any time or depth into the cloud, succeed in achieving a fractional abundance of C2H larger than 10−9. This is consistent with the results of
pre-vious PDR models. For example,Turner et al.(1999) succeeded in fitting the C2H abundance observed in some translucent
clouds (10−8) with steady-state models but only by assuming a high non-solar C/O ratio (∼0.9). In denser PDRsCuadrado et al.
(2015) found that a C2H abundance of 10−8can in fact only be
matched by a model with a gas density of >106cm−3, radiation
field of >104Draine field, and at a depth <2 mag. In other words,
only an extremely dense but thin layer of gas can steadily sus-tain such a high abundance of C2H. Such a scenario is depicted
by some of our models from the UCL_CHEM grid and these models are discussed later.
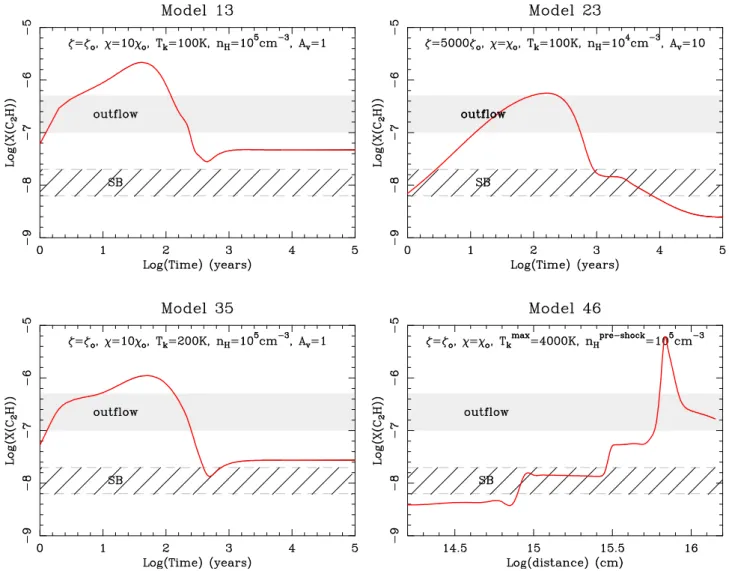
We now discuss the output of Models 1−44 (Table 5) in the light of the abundances derived for the outflow region. If we assume the temperature of the gas is >50 K then none of the UCL_CHEM models at equilibrium succeed in producing enough C2H, with maximum abundances that reach at most
'3 × 10⁻⁸. However, there is a class of models, namely
Mod-els 13, 23, 35, where higher abundances, comparable to (or higher than) those observed, can be reached at very early times. These models are all characterized by either a higher (by a factor of 10) than standard UV radiation field, or by a very high cosmic-ray ionization rate (a factor of 5000 higher than standard); the latter would account for the influence of enhanced X-ray irradi-ation. All models have at least a density of 104cm−3. We plot in Fig.7the temporal evolution of C2H for these models. The
in-crease and dein-crease of C2H are due to photodissociation of C2H2
and ion-neutral reaction of C2H with C+, respectively. While we
cannot differentiate between a UV or a X-ray enhanced field, all these models are consistent with those of molecular interfaces between outflows and ambient clouds in high-mass star-forming regions in our Galaxy (Codella et al. 2006; van Kempen et al. 2010;San José-García et al. 2016), where visual extinctions are low (≤2 mag), gas densities, temperatures, and radiation fields are high (>104 cm−3, >100 K, and >10 Draine field,
respec-tively), and the gas is short-lived ('102−3yr). We find that these
transient conditions in the UV or X-ray irradiated gas may be due to non-dissociative shocks associated with the highly turbulent
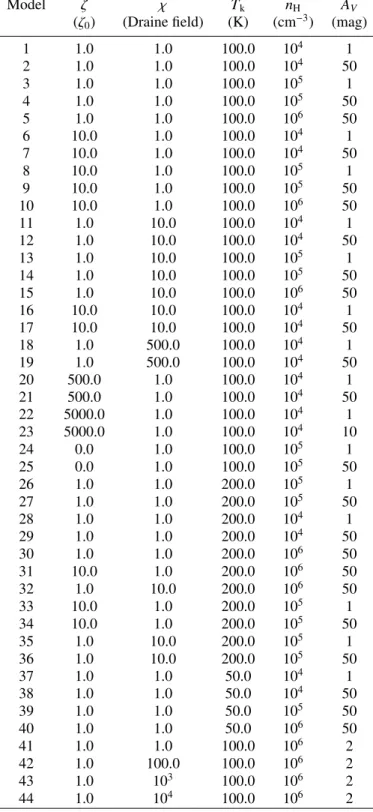
Table 5. Grid of gas-grain chemical models (UCL_CHEM).
Model ζ χ Tk nH AV
(ζ0) (Draine field) (K) (cm−3) (mag)
1 1.0 1.0 100.0 104 1 2 1.0 1.0 100.0 104 50 3 1.0 1.0 100.0 105 1 4 1.0 1.0 100.0 105 50 5 1.0 1.0 100.0 106 50 6 10.0 1.0 100.0 104 1 7 10.0 1.0 100.0 104 50 8 10.0 1.0 100.0 105 1 9 10.0 1.0 100.0 105 50 10 10.0 1.0 100.0 106 50 11 1.0 10.0 100.0 104 1 12 1.0 10.0 100.0 104 50 13 1.0 10.0 100.0 105 1 14 1.0 10.0 100.0 105 50 15 1.0 10.0 100.0 106 50 16 10.0 10.0 100.0 104 1 17 10.0 10.0 100.0 104 50 18 1.0 500.0 100.0 104 1 19 1.0 500.0 100.0 104 50 20 500.0 1.0 100.0 104 1 21 500.0 1.0 100.0 104 50 22 5000.0 1.0 100.0 104 1 23 5000.0 1.0 100.0 104 10 24 0.0 1.0 100.0 105 1 25 0.0 1.0 100.0 105 50 26 1.0 1.0 200.0 105 1 27 1.0 1.0 200.0 105 50 28 1.0 1.0 200.0 104 1 29 1.0 1.0 200.0 104 50 30 1.0 1.0 200.0 106 50 31 10.0 1.0 200.0 106 50 32 1.0 10.0 200.0 106 50 33 10.0 1.0 200.0 105 1 34 10.0 1.0 200.0 105 50 35 1.0 10.0 200.0 105 1 36 1.0 10.0 200.0 105 50 37 1.0 1.0 50.0 104 1 38 1.0 1.0 50.0 104 50 39 1.0 1.0 50.0 105 50 40 1.0 1.0 50.0 106 50 41 1.0 1.0 100.0 106 2 42 1.0 100.0 100.0 106 2 43 1.0 103 100.0 106 2 44 1.0 104 100.0 106 2
Notes. Column (1) lists the model number. Columns (2) and (3) list the cosmic-ray ionization rates (ζ) and radiation fields (χ), respectively, in units of their standard Galactic values (ζ0= 5 × 10⁻¹⁷s−1and 1 Draine field ≡ 2.74 × 10⁻³erg s−1cm−2). Columns (4) and (5) list the kinetic temperature (Tk) and hydrogen density (nH), respectively, of the gas. Column (6) lists the depth of the layer in AV-units.
interface between the outflow and molecular clouds. While it is true that Model 23 has a high visual extinction, because of the very high cosmic-ray ionization rate the chemistry of the gas is effectively the same as that of an interface. Although timescales
Fig. 7.Fractional abundance of C2H for a representative set of chemical models discussed in Sect.4that account for the measured abundances of ethynyl in the SB ring and the outflow region of NGC 1068. The C2H abundance is represented as a function of time for gas-grain chemical models (UCL_CHEM) number 13, 23, and 35, and as a function of distance for shock model number 46. This scale corresponds to the distance that the shock travels up to the dissipation length, which is the length scale over which the shock dissipates, beyond which the model is no longer applicable (seeJiménez-Serra et al. 2008). The main parameters of the models, extensively described in Sect.4and listed in Tables4−6, are indicated in each panel. We highlight the range of C2H abundances measured in the SB ring (' a few 10−8for Tex ' 10 K) and in the outflow region (' a few 10−7for T
ex' 25−50 K).
Table 6. Grid of parametrized shock models.
Model ζ χ Tmax nHpre-shock
(ζ0) (Draine field) (K) (cm−3)
45 1.0 1.0 2200 104
46 1.0 1.0 4000 105
47 1.0 1.0 4000 106
Notes. Column (1) lists the model number. Columns (2) and (3) list the cosmic-ray ionization rates (ζ) and radiation fields (χ), respectively, in units of their standard Galactic values (ζ0= 5 × 10⁻¹⁷s−1and 1 Draine field ≡ 2.74 × 10⁻³erg s−1cm−2). Columns (4) and (5) list the maximum kinetic temperature (Tmax) and pre-shock hydrogen density (nHpre-shock) of the gas, respectively.
may be very short, the continual erosion of dense material by the wind or outflow would resupply the interface, so a nearly steady state may persist in the UV or X-ray illuminated gas across the shock front.
Models 1–44, although partly mimicking the effects of nondissociative shocks, did not properly model the passage of the shock. In order to test our hypothesis that the C2H
abundances can be reproduced by the erosion of icy mantles due to the passage of nondissociative shocks, we also included in our grid three shock models (45–47; Table6). In these models we as-sumed an average shock velocity Vs ' 40 km s−1. The preshock
density and the shock velocity determine the maximum temper-ature reached (see Table6). We plot the results of Model 46 in Fig.7. It is clear that the C2H abundance does indeed rise as
the shock penetrates the dissipation length of the gas, and it is close to that found by our LTE analysis if one assumes a 100 K gas, which, especially in the outflow region, is a reasonable gas temperature (García-Burillo et al. 2014;Viti et al. 2014).
With all the necessary caveats in mind, these results sug-gest that the inferred high abundances of C2H in the outflow
could represent the first evidence of a chemical fingerprint of an outflow interface region in an external galaxy. The scenario described above, where UV or X-ray radiation and shocks seem to act in concert to shape the chemistry of the outflow interface
region in NGC 1068, is also similar to that supporting the exis-tence of mechanical dominated regions (MDRs), which is a vari-ant of PDRs in which mechanical action is invoked to explain the spectral energy distribution of CO in some star-forming and active galaxies (Meijerink et al. 2013; Rosenberg et al. 2014,
2015).
We now examine the results of Models 1–44 in the light of the abundances derived for the SB ring. While the derived frac-tional abundances as a function of temperatures are essentially the same as in the outflow spot, the derived temperatures are comparatively lower in the SB ring (Sect. 3.4) and since C2H
may be subthermally excited, the derived fractional abundances may nevertheless correspond to those derived for a gas at a higher (than 10 K) excitation temperature. In this case, the abun-dances that our models need to match are more of the canonical order of ∼10−8. We first look at the models run with a
tempera-ture of 50 K (Models 37–40). In fact Model 37, which represents a canonical PDR, with Galactic UV and cosmic-ray ionization fields, a typical molecular cloud gas density of 104cm−3, visual extinction of 1 mag, and temperature of 50 K provides us with a match with an abundance of 10−8. This may therefore indicate
that C2H is simply tracing the gas most exposed to star formation
in a region where we know star formation is very active. Other models match this abundance at equilibrium as well: in particular Models 1, 11, 13, and 16, all at AV = 1 mag (hence PDR-like),
and differing by a factor of 10 in either radiation field, cosmic-ray ionization field and gas density from Model 37, hence all reasonable PDR models depicting gas affected by active star for-mation, as expected in a SB ring. However, all these models are run at gas temperatures of 100 K. Moreover, Models 41–44 mim-ick the best-fit models fromCuadrado et al.(2015) and, of those, Models 42–44 are able to reproduce the observed abundance of 1−3 × 10⁻⁸, making it difficult to determine whether C2H is
trac-ing a very dense gas subjected to an enhanced radiation field or a more canonical molecular cloud gas. Regardless, the C2H must
come from a very low visual extinction gas, which means that the SB ring must be at least partly dominated by PDR gas. Hence for the SB ring, C2H may simply be tracing star formation activity.
Further confirmation of all the favored scenarios discussed above would need a more extensive chemical modeling that ex-plores, for example, a wider range of initial conditions, including initial elemental abundances differing from solar.
5. Summary and conclusions
We used ALMA to map the emission of the hyperfine multiplet of C2H(1−0) and its underlying continuum emission at 86.3 GHz
in the central r ' 3500(2.5 kpc) region of the disk of the nearby
(D = 14 Mpc) Seyfert 2 galaxy NGC 1068 with a spatial res-olution 100. 0 × 000. 7 ('50−70 pc). In an attempt to explain the
fractional abundances derived for C2H in the different spatially
resolved environments of the galaxy we developed a set of time-dependent chemical models.
We summarize the main results of our study as follows: – We detected widespread C2H emission in the disk of
NGC 1068. Most ('65%) of the spatially integrated C2H
line flux stems from the r ' 1.3 kpc SB molecular ring. The SB ring concentrates the bulk of the recent massive star formation in the disk of the galaxy as traced by the strong Paα emission of HIIregions imaged by HST. The brightest C2H emission originates nevertheless from the r ' 200 pc
outflowing CND. We also detected significant C2H emission
bridging the CND with the outer disk in a region that probes
the interface between the molecular disk and the ionized gas outflow out to r ' 400 pc.
– The line ratios measured between the hyperfine compo-nents of the C2H multiplet detected throughout the disk of
NGC 1068 indicate that their emission is mostly optically thin. We derived the column densities of C2H assuming LTE
conditions and a set of excitation temperatures constrained by the previous multiline CO studies of the galaxy.
– Maps of the dust continuum emission obtained at 349 GHz by ALMA were used to calculate the H2 gas column
den-sities. These were used in combination with the C2H
col-umn densities derived from LTE to obtain the fractional abundances of this species in different regions. Our esti-mates range from X(C2H) ' a few 10−8 in the SB ring up
to X(C2H) ' a few 10−7in the outflow.
– We performed a preliminary qualitative chemical analysis to determine the origin of the high abundance of C2H in
the outflow and the SB ring. In both regions we find that the gas is dense (≥104 cm−3), confirming previous results (García-Burillo et al. 2014;Viti et al. 2014).
– In the outflow we found that fractional abundances of X(C2H) ' a few 10−7 can only be reached at very early
times in models where dense molecular gas is heavily irra-diated by UV or X-ray photons. In particular, these mod-els are consistent with those of molecular interfaces between outflows and ambient clouds, where visual extinctions are low (≤2 mag), gas densities, temperatures, and UV fields or cosmic-ray fields are high (>104cm−3, >100 K, and >10
Draine field, or >5000 ζ0, respectively), and the gas is
short-lived ('102−3yr).
– We found that transient conditions in the outflow may be due to UV or X-ray irradiated nondissociative shocks associated with the highly turbulent interface between the outflow and molecular clouds. Although timescales may be very short, the continual erosion of dense material by the wind or jet resupplies the interface, so a nearly steady state persists (e.g.,
Codella et al. 2006). Shock models seem to confirm that C2H
can also be enhanced from icy mantle sputtering.
– In the SB ring, on the other hand, an abundance of X(C2H) ' a few 10−8is either tracing molecular gas typical
of the skin of Galactic giant molecular clouds or is tracing a much denser skin subjected to an enhanced UV field. Both scenarios are consistent with active star formation.
Our chemical modeling is not extensive and has not covered a large enough parameter space of initial conditions to exclude the validity of alternative scenarios. In particular, we cannot exclude that the hydrocarbons chemistry is incomplete in our models or that PAH chemistry (not included) has a significant effect on the gas-phase chemistry of C2H (e.g.,Pety et al. 2005); equally a
small difference in the C/O ratio in the adopted initial abun-dances of our models could change our conclusions as this would affect the abundance of all hydrocarbons (Cuadrado et al. 2015). Once further transitions of C2H are obtained, a more
compre-hensive modeling would be needed to shed light on the origin of the significantly high abundances of C2H in NGC 1068.
Acknowledgements. We acknowledge the staff of ALMA in Chile and the ARC-people at IRAM-Grenoble in France for their invaluable help during the data reduction process. This paper makes use of the following ALMA data: ADS/JAO.ALMA#2013.1.00055.S and #2011.0.00083.S. ALMA is a partner-ship of ESO (representing its member states), NSF (USA), and NINS (Japan) together with NRC (Canada) and NSC and ASIAA (Taiwan), in cooperation with the Republic of Chile. The Joint ALMA Observatory is operated by ESO, AUI/NRAO, and NAOJ. The National Radio Astronomy Observatory is a facility
of the National Science Foundation operated under cooperative agreement by Associated Universities, Inc. We used observations made with the NASA/ESA HubbleSpace Telescope, and obtained from the Hubble Legacy Archive, which is a collaboration between the Space Telescope Science Institute (STScI/NASA), the Space Telescope European Coordinating Facility (ST-ECF/ESA), and the Canadian Astronomy Data Centre (CADC/NRC/CSA). S.G.B. and A.U. ac-knowledge support from the Spanish MINECO and FEDER funding grants AYA2016-76682-C3-2-P, AYA2016-79006-P, and ESP2015-68964-P. C.R.A. acknowledges the Ramón y Cajal Program of the Spanish Ministry of Econ-omy and Competitiveness through project RYC-2014-15779 and the Spanish Plan Nacional de Astronomía y Astrofísica under grant AYA2016-76682-C3-2-P. A.A.H. acknowledges support from the Spanish MINECO and FEDER funding grant AYA2015-6346-C2-1-P.
References
Aladro, R., Martín, S., Martín-Pintado, J., et al. 2011,A&A, 535, A84
Aladro, R., Viti, S., Bayet, E., et al. 2013,A&A, 549, A39
Bayet, E., Viti, S., Hartquist, T. W., & Williams, D. A. 2011a,MNRAS, 417, 627
Bayet, E., Williams, D. A., Hartquist, T. W., & Viti, S. 2011b,MNRAS, 414, 1583
Bayet, E., Davis, T. A., Bell, T. A., & Viti, S. 2012,MNRAS, 424, 2646
Bell, T. A., Viti, S., Williams, D. A., Crawford, I. A., & Price, R. J. 2005,
MNRAS, 357, 961
Bell, T. A., Roueff, E., Viti, S., & Williams, D. A. 2006,MNRAS, 371, 1865
Beuther, H., Semenov, D., Henning, T., & Linz, H. 2008,ApJ, 675, L33
Bland-Hawthorn, J., Gallimore, J. F., Tacconi, L. J., et al. 1997,Ap&SS, 248, 9
Brinks, E., Skillman, E. D., Terlevich, R. J., & Terlevich, E. 1997,Ap&SS, 248, 23
Codella, C., Viti, S., Williams, D. A., & Bachiller, R. 2006,ApJ, 644, L41
Costagliola, F., Aalto, S., Rodriguez, M. I., et al. 2011,A&A, 528, A30
Cuadrado, S., Goicoechea, J. R., Pilleri, P., et al. 2015,A&A, 575, A82
Draine, B. T., Dale, D. A., Bendo, G., et al. 2007,ApJ, 663, 866
Endres, C. P., Schlemmer, S., Schilke, P., Stutzki, J., & Müller, H. S. P. 2016,J. Mol. Spectr., 327, 95
Fuente, A., Martin-Pintado, J., Cernicharo, J., & Bachiller, R. 1993,A&A, 276, 473
Gallimore, J. F., Baum, S. A., O’Dea, C. P., & Pedlar, A. 1996,ApJ, 458, 136
Gallimore, J. F., Baum, S. A., & O’Dea, C. P. 2004,ApJ, 613, 794
Gallimore, J. F., Elitzur, M., Maiolino, R., et al. 2016,ApJ, 829, L7
García-Burillo, S., Usero, A., Fuente, A., et al. 2010,A&A, 519, A2
García-Burillo, S., Combes, F., Usero, A., et al. 2014,A&A, 567, A125
García-Burillo, S., Combes, F., Ramos Almeida, C., et al. 2016,ApJ, 823, L12
Hailey-Dunsheath, S., Sturm, E., Fischer, J., et al. 2012,ApJ, 755, 57
Heikkilä, A., Johansson, L. E. B., & Olofsson, H. 1999,A&A, 344, 817
Henkel, C., Schilke, P., & Mauersberger, R. 1988,A&A, 201, L23
Holdship, J., Viti, S., Jiménez-Serra, I., Makrymallis, A., & Priestley, F. 2017,
AJ, 154, 38
Huggins, P. J., Carlson, W. J., & Kinney, A. L. 1984,A&A, 133, 347
Imanishi, M., & Nakanishi, K. 2013,AJ, 146, 47
Imanishi, M., Nakanishi, K., & Izumi, T. 2016,ApJ, 822, L10
Israel, F. P. 2009,A&A, 493, 525
Jiménez-Serra, I., Caselli, P., Martín-Pintado, J., & Hartquist, T. W. 2008,A&A, 482, 549
Kamenetzky, J., Glenn, J., Maloney, P. R., et al. 2011,ApJ, 731, 83
Kelly, G., Viti, S., García-Burillo, S., et al. 2017,A&A, 597, A11
Klaas, U., Haas, M., Müller, S. A. H., et al. 2001,A&A, 379, 823
Kohno, K., Matsushita, S., Vila-Vilaró, B., et al. 2001, in The Central Kiloparsec of Starbursts and AGN: The La Palma Connection, eds. J. H. Knapen, J. E. Beckman, I. Shlosman, & T. J. Mahoney,ASP Conf. Ser., 249, 672
Krips, M., Neri, R., García-Burillo, S., et al. 2008,ApJ, 677, 262
Krips, M., Martín, S., Eckart, A., et al. 2011,ApJ, 736, 37
Li, J., Wang, J., Gu, Q., Zhang, Z.-Y., & Zheng, X. 2012,ApJ, 745, 47
Martín, S., Mauersberger, R., Martín-Pintado, J., Henkel, C., & García-Burillo, S. 2006,ApJS, 164, 450
Martín, S., Verdes-Montenegro, L., Aladro, R., et al. 2014,A&A, 563, L6
Martín, S., Kohno, K., Izumi, T., et al. 2015,A&A, 573, A116
Meier, D. S., & Turner, J. L. 2005,ApJ, 618, 259
Meier, D. S., & Turner, J. L. 2012,ApJ, 755, 104
Meier, D. S., Walter, F., Bolatto, A. D., et al. 2015,ApJ, 801, 63
Meijerink, R., Kristensen, L. E., Weiß, A., et al. 2013,ApJ, 762, L16
Nakajima, T., Takano, S., Kohno, K., & Inoue, H. 2011,ApJ, 728, L38
Nakajima, T., Takano, S., Kohno, K., et al. 2015,PASJ, 67, 8
Pan, Z., Li, D., Chang, Q., et al. 2017,ApJ, 836, 194
Pety, J., Teyssier, D., Fossé, D., et al. 2005,A&A, 435, 885
Pilleri, P., Treviño-Morales, S., Fuente, A., et al. 2013,A&A, 554, A87
Pilyugin, L. S., Vílchez, J. M., & Contini, T. 2004,A&A, 425, 849
Pilyugin, L. S., Thuan, T. X., & Vílchez, J. M. 2007,MNRAS, 376, 353
Priestley, F. D., Barlow, M. J., & Viti, S. 2017,MNRAS, 472, 4444
Röllig, M., Abel, N. P., Bell, T., et al. 2007,A&A, 467, 187
Rosenberg, M. J. F., Kazandjian, M. V., van der Werf, P. P., et al. 2014,A&A, 564, A126
Rosenberg, M. J. F., van der Werf, P. P., Aalto, S., et al. 2015,ApJ, 801, 72
San José-García, I., Mottram, J. C., van Dishoeck, E. F., et al. 2016,A&A, 585, A103
Schinnerer, E., Eckart, A., Tacconi, L. J., Genzel, R., & Downes, D. 2000,ApJ, 533, 850
Shirley, Y. L. 2015,PASP, 127, 299
Skrutskie, M. F., Cutri, R. M., Stiening, R., et al. 2006,AJ, 131, 1163
Sternberg, A., & Dalgarno, A. 1995,ApJS, 99, 565
Tacconi, L. J., Genzel, R., Blietz, M., et al. 1994,ApJ, 426, 77
Takano, S., Nakajima, T., Kohno, K., et al. 2014,PASJ, 66, 75
Tosaki, T., Kohno, K., Harada, N., et al. 2017, PASJ, 69, 18 Tucker, K. D., Kutner, M. L., & Thaddeus, P. 1974,ApJ, 193, L115
Turner, B. E., Terzieva, R., & Herbst, E. 1999,ApJ, 518, 699
Ulvestad, J. S., Neff, S. G., & Wilson, A. S. 1987,AJ, 93, 22
Usero, A., García-Burillo, S., Fuente, A., Martín-Pintado, J., & Rodríguez-Fernández, N. J. 2004,A&A, 419, 897
van Kempen, T. A., Kristensen, L. E., Herczeg, G. J., et al. 2010,A&A, 518, L121
Vasta, M., Barlow, M. J., Viti, S., Yates, J. A., & Bell, T. A. 2010,MNRAS, 404, 1910
Viti, S. 2017,A&A, 607, A118
Viti, S., Jimenez-Serra, I., Yates, J. A., et al. 2011,ApJ, 740, L3
Viti, S., García-Burillo, S., Fuente, A., et al. 2014,A&A, 570, A28
Walsh, A. J., Thorwirth, S., Beuther, H., & Burton, M. G. 2010,MNRAS, 404, 1396
Wang, M., Henkel, C., Chin, Y.-N., et al. 2004,A&A, 422, 883
Watt, G. D. 1983,MNRAS, 205, 321
Watt, G. D., White, G. J., Millar, T. J., & van Ardenne, A. 1988,A&A, 195, 257
Wilson, A. S., & Ulvestad, J. S. 1982,ApJ, 263, 576
Wilson, A. S., & Ulvestad, J. S. 1983,ApJ, 275, 8
Wilson, A. S., & Ulvestad, J. S. 1987,ApJ, 319, 105
Wootten, A., Bozyan, E. P., Garrett, D. B., Loren, R. B., & Snell, R. L. 1980,
ApJ, 239, 844
1 Observatorio Astronómico Nacional (OAN-IGN)-Observatorio de Madrid, Alfonso XII, 3, 28014 Madrid, Spain
e-mail: [email protected]
2 Department of Physics and Astronomy, UCL, Gower Place, London WC1E 6BT, UK
3 Observatoire de Paris, LERMA, CNRS, 61 Av. de l’Observatoire, 75014 Paris, France
4 INAF–Osservatorio Astrofisico di Arcetri, Largo Enrico Fermi 5, 50125 Firenze, Italy
5 Joint ALMA Observatory, Alonso de Córdova, 3107 Vitacura, 763-0355 Santiago, Chile
6 ESO, Alonso de Córdova, 3107 Vitacura, 763-0355 Santiago, Chile 7 Institut de Radio Astronomie Millimétrique (IRAM), 300 rue de la Piscine, Domaine Universitaire de Grenoble, 38406 St. Martin d’Hères, France
8 Department of Earth and Space Sciences, Chalmers University of Technology, Onsala Observatory, 439 94 Onsala, Sweden
9 Max-Planck-Institut für Radioastronomie, Auf dem Hügel 69, 53121 Bonn, Germany
10 Instituto de Astrofísica de Canarias, Calle Vía Láctea, s/n, 38205 La Laguna, Tenerife, Spain
11 Departamento de Astrofísica, Universidad de La Laguna, 38205, La Laguna, Tenerife, Spain
12 Centro de Astrobiología (CSIC-INTA), ESAC Campus, 28692 Villanueva de la Cañada, Madrid, Spain
13 Astronomy Department, King Abdulazizi University, PO Box 80203, 21589 Jeddah, Saudi Arabia
14 European Southern Observatory (ESO), Karl-Schwarzschild-Strasse 2, 85748 Garching bei München, Germany
15 Max-Planck-Institut für extraterrestrische Physik, Postfach 1312, 85741 Garching, Germany
16 Leiden Observatory, Leiden University, PO Box 9513, 2300 RA Leiden, The Netherlands