A
A
l
l
m
m
a
a
M
M
a
a
t
t
e
e
r
r
S
S
t
t
u
u
d
d
i
i
o
o
r
r
u
u
m
m
-
-
U
U
n
n
i
i
v
v
e
e
r
r
s
s
i
i
t
t
à
à
d
d
i
i
B
B
o
o
l
l
o
o
g
g
n
n
a
a
DOTTORATO DI RICERCA IN
Scienze Ambientali: Tutela e Gestione delle Risorse Naturali
XXII Ciclo
Settore scientifico disciplinare di afferenza:
GEO/05 Geologia applicata
COASTAL FLOOD VULNERABILITY ASSESSMENT WITH GEOMATIC
METHODS:
TEST SITES OF WESTERN THAILAND, SYDNEY (AUSTRALIA) AND
AEOLIAN ISLANDS (SOUTH TYRRHENIAN SEA, ITALY)
Tesi presentata da: Dott. Filippo Dall’Osso
Coordinatore:
Tutore:
Prof.ssa Elena Fabbri
Prof. Giovanni Gabbianelli
Relatore:
Foreword
The work undertaken in this PhD thesis is aimed at the development and testing of an innovative methodology for the assessment of the vulnerability of coastal areas to marine catastrophic inundation (tsunami). Different approaches are used at different spatial scales and are applied to three different study areas:
1. The entire western coast of Thailand
2. Two selected coastal suburbs of Sydney – Australia
3. The Aeolian Islands, in the South Tyrrhenian Sea – Italy
I have discussed each of these cases study in at least one scientific paper: one paper about the Thailand case study (Dall’Osso et al., in review-b), three papers about the Sydney applications (Dall’Osso et al., 2009a; Dall’Osso et al., 2009b; Dall’Osso and Dominey-Howes, in review) and one last paper about the work at the Aeolian Islands (Dall’Osso et al., in review-a).
These publications represent the core of the present PhD thesis. The main topics dealt with are outlined and discussed in a general introduction while the overall conclusions are outlined in the last section.
N.B.
The following style rules have been adopted in every paper included in the present PhD thesis:
- References of each paper are reported at the end of it, after the text.
- All figures and tables are attached after the paper references.
- Figures and tables are numbered independently. In each paper the numbering of figures and tables re-starts from n. 1
SUMMARY
FOREWORD 5
INTRODUCTION 9
1.1 RISK,HAZARD AND VULNERABILITY 10
1.2 DEVELOPING A METHOD FOR TSUNAMI VULNERABILITY ASSESSMENT 12
1.2.1 EXISTING APPROACHES 14
1.2.2 THE PROPOSED METHODOLOGY 15
PAPER N. 1: A Novel Method For Assessing Tsunami Vulnerability At The Regional Scale Using Aster Imagery 21
PAPER N. 2: A Revised (Ptva) Model For Assessing The Vulnerability Of Buildings To Tsunami Damage 43
PAPER N. 3:
Assessing The Vulnerability Of Buildings To Tsunami In Sydney 63
PAPER N. 4: ‘Reducing The Loss’ - Using High-Resolution Vulnerability Assessments To Enhance Tsunami Risk
Reduction Strategies 91
PAPER N. 5: Assessing The Vulnerability Of Buildings To Tsunami Damage In The Aeolian Islands, Italy –
Application And Validation Of The Ptva – 3 Model 109
OVERALL CONCLUSIONS 145
References 151
Introduction
Introduction
The need for tools aimed at helping to reduce global risk from extreme natural events such as tsunamis has become obvious after the 2004 Indian Ocean Tsunami (2004 IOT), and further emphasized by more recent events (i.e. the 2005 Katrina Hurricane, the 2009 Samoa tsunami and the risk of a major tsunami throughout the Pacific Ocean after the 2010 Chile earthquake). The 2004 IOT was particularly catastrophic (Figure 1). It was the most lethal tsunami disaster the modern world has record of and catapulted tsunamis onto the global scientific and political stage. It has prompted an unparalleled international scientific and intergovernmental response with several foci including the development and deployment of tsunami warning systems in risk areas, detailed hazard, risk and vulnerability assessment and tsunami education and disaster planning.
Figure 1. Global reach of the 2004 Indian Ocean tsunami (after Titov et al., 2005). White isolines are the position of the tsunami wave front in hours after the start of the event. Colours represent modelled (forecast) wave amplitudes offshore. White circles equal measured wave amplitudes (in metres) at coastal tide gauges.
The 2004 disaster was not however, unique. Similar events have occurred in the past and will happen again in the future. The most important lesson from the 2004 Indian Ocean tsunami is that we are at risk. The 2004 disaster was something of a wake up call for every country sharing a border with the sea, since prior to this event few had seriously considered the potential threat posed by tsunamis. The 2004 IOT showed that low-lying coastal areas are vulnerable to the impact of
Introduction
impacts of such floods will be worse than in the past because of climate related sea level rise and increased exposure at the coast.
As for every extreme natural event able to affect people and human properties, the tsunami threat should be managed according to international “risk management” guidelines. The three primary components of a risk management framework are: risk identification, risk reduction and disaster management. (Cardona, 2003). The definition of “risk” is thus the first step of this process.
1.1 Risk, Hazard and Vulnerability
There are many definitions of risk. In most cases it has been defined according to the aims of different science sectors in which a disaster management technique was required. Despite the high number of definitions that can be found in literature, the concept of risk as a function of “hazard” and “vulnerability” appears to be the most accepted and widely used.
According to White and Burton (1980), “risk is the product of the probability of the occurrence of a hazard and its societal consequences”. Tarrant et al. (1987), as well as Ansell and Wharton (1992), simply defined the risk as the product between likelihood and consequences. At an international level, a more complete definition has been given by the United Nations (1992); The U.N. define risk as “expected losses (of lives, persons injured, property damaged and economic activity disrupted) due to a particular hazard for a given area and reference period”. For the International Strategy for Disaster Reduction (ISDR), risk is “the combination of the probability of an event...” (i.e. the hazard) “...and its negative consequences” (i.e. the vulnerability).
Thus, the identification and analysis of risk involve different evaluations about both hazard and vulnerability. A large group of similar definitions can also be found for these two concepts. The United Nations (1992) define hazard as “a threatening event, or the probability of occurrence of a potentially damaging phenomenon within a given time period and area”. Deyle et al. (1998) gave a definition of natural hazard, as “an extreme natural event that poses risks to human settlements”. The United States Federal Emergency Management Agency or FEMA (FEMA 1997) defines it as
Introduction
harm from a hazard. It can generally be applied to individuals, society, or the environment”. The United Nations (1992) describe vulnerability as the “degree of loss (from 0% to 100%) resulting from a potentially damaging phenomenon”. ISDR defines vulnerability as “the characteristics and circumstances of a community, system or asset that make it susceptible to the damaging effects of a hazard.”
According to such definitions of risk (and related concepts), it is obvious that risk reduction can be achieved by altering either the physical hazard or the vulnerability of the subject/system that is exposed to it. In case of tsunamis, the hazard itself is not predictable or avoidable; therefore, mitigating vulnerability is the only way in which risk can be realistically reduced. Mitigating the vulnerability level of an exposed area means to increase its ability to withstand the hazard’s impact, should it occur.
The vulnerability of a coastal area includes a wide range of factors or parameters. Because of its multifaceted nature, it is difficult to quantify and there is no global consensus yet on how it should be measured (Thywissen 2006). However, according to UN guidelines (1992), vulnerability can be assessed as a percentage of the expected losses resulting from the occurrence of a given hazard. Such losses can be classified into two main groups (Coburn et al., 1994):
- direct damages: those happening during the hazard's impact or immediately after. They are also defined “tangible effects” and primarily include effects on people or physical assets (e.g. injuries and casualties, damage to buildings and infrastructure, damage to the environment, etc.);
- indirect damages: any other damage or loss arising in the hazard's aftermath, as a consequence of direct damages (e.g. economic or financial losses, damage to the social and cultural cohesion of the affected community, psychological issues, etc.).
Within the present work, vulnerability to tsunami has been defined and measured in accordance with UN (1992) guidelines. In addition, the method we developed focuses on the assessment of the potential for “direct” damages, although, as complementary results, it provides some of the data necessary to be able to undertake further assessment on the socio-economic aspects of the vulnerability.
Introduction
1.2 Developing a method for tsunami vulnerability assessment
In the case of a tsunami, the affected area could include the coastal zones of a whole nation or, as tragically occurred in 2004, a whole oceanic basin. At the same time, damage caused by a tsunami is highly dependent on the physical and environmental features of the exposed areas and can be extremely heterogeneous even within the same town. Observations of the impacts of the 2004 IOT showed how variable these could be even along a few kilometres of coastline. The nearshore bathymetry is one of the key parameters (Matsuyama et al., 1999) affecting the height and intensity of the incoming waves. The topography and geomorphological characteristics of the shoreline have also a key-role in determining the extent of inundations and run-ups. Other important variables regulating the impact are given by the shielding effect provided by vegetation, especially mangrove forests (Kathiresan and Rajendran, 2006) and any artificial defence, such as coastal works or seawalls. All of these factors play a key-role in defining the height and intensity of the inundation. In addition, physical damages suffered by the urban and natural environments depend on several other parameters, such as land use, building construction standards, the degree of urban development of coastal zones, etc.
Given the potential scale of the affect of a tsunami, the high number of data needed and the extremely high spatial variability of the expected damage, local and national government agencies faced with the task of developing appropriate risk reduction strategies need appropriate tools to enable them to assess vulnerability at various scales. Furthermore, given the low frequency of tsunamis, investments (in terms of time and money) that Governments and Public Administrations normally put for prevention studies or measures are very limited, and must be prioritized.
Such observations lead me to develop a method for the assessment of the tsunami vulnerability with the following characteristics:
1. Ability to work at two different scales. At the smallest scale, the required detail level is lower. As a consequence, the vulnerability of large coastal areas (e.g. regional or even national) can be assessed spending relatively little time and financial resources. This must not affect the reliability of the analysis, but just its spatial resolution. At this stage, the entire
Introduction
effort typically required by high-resolution analysis will be limited to few selected coastal zones, although the whole multi-scale assessment considered a much wider area.
2. Ability to gather most of the data needed through the best available geomatic methods: the large amount of data required to undertake a reliable assessment of tsunami vulnerability is often the main limit to the correct application of international guidelines on risk management. This happens more frequently in developing countries, where national or local archives, if existing, are often incomplete or inaccessible. Paradoxically, such countries are the most vulnerable to natural hazards (ECLAC, 2003). The lack of reliable information can be partially addressed with the use of recent geomatic technologies, based on the employment of satellite surveys and remote sensing (especially the analysis of multi-spectral satellite imagery and radar surveys). With a relatively small effort in terms of time and costs, such technologies can provide a large spectrum of georeferenced information at a local or even national scale and can be applied at different resolution levels. Furthermore, the capability of such systems is increasing very quickly and recent technical progresses, especially in terms of geometrical and spectral resolution of newest sensors, suggest that the contribution of satellite surveys will quickly become indispensable to a large part of environmental or geographic studies.
3. Ability to store and manage data into Geographic Information Systems (GIS): data obtained through remote sensing are easily manageable through GIS, increasing greatly their field of application. GIS is an ideal platform for any environmental analysis organized on a geographic base. In particular, GIS tools are of great help in vulnerability assessment studies. Thanks to GIS, the hazard, the exposure and the data required to assess the vulnerability of coastal zones to tsunami impacts can be stored, organized in different graphic layers, edited or crossed with each others. Several tools for spatial and statistical analysis can also be used. Furthermore, the GIS allows to generate interactive maps, that can be consulted by different types of end–users and easily kept updated through the years, which is basic for low-frequency hazards such as tsunamis. As a result, GIS has become an indispensable tool, not only for assisting in tsunami vulnerability assessments, but for other natural hazards as well.
Introduction
1.2.1 Existing approaches
At the time this work was undertaken, none of the existing methods for tsunami vulnerability assessment incorporated all the aforementioned features.
Methods working at a regional or national levels use satellite imagery or topographic data only to identify and map those areas that are exposed to or at risk from tsunami flooding (Theilen-Willige, 2008; Chandrasekar et al., 2007; Theilen-Willige, 2006). However, the vulnerability level of coastal zones depends also on their environmental and socio-economic characteristics, which are not considered by such approaches. Hence, whilst those methods are based on the use of remote sensing techniques, they do not provide a comprehensive analysis of coastal vulnerability to tsunami.
A low-scale method, which crosses exposure and land cover data, was used by Wood (2009). In that approach, land cover data are extracted by Landsat satellite images and coupled with pre-existing tsunami-hazard information. Although this approach is one of the few considering the integration of socio-economic and environmental data (i.e. the land cover), it is based on the use of a pre-existing database of tsunami hazard information, which is highly unlikely to be available elsewhere, making the application of Wood’s approach problematic.
With regard to methods working at a high spatial resolution, much more information can be found in literature. Most of such approaches (Dominey-Howes, et al., in press; Garcin et al., 2008; Taubenbock et al., 2008; Aitkenhead, 2007; Dominey-Howes and Papathoma, 2007; Papathoma et al., 2003; Papathoma and Dominey-Howes, 2003; Papadopoulos and Dermentzopoulos, 1998) aim to assess the vulnerability of single buildings or infrastructure units. Required data are normally gathered through field surveys and direct census. Given the high detail of analysis, these methods must be applied to pre-selected coastal sites, on the basis of specific requests from Public Administrations, or scientific interests based on past tsunamis. Among them, the “Papathoma Tsunami Vulnerability Assessment method” (PTVAm) is one of the most widely used (Papathoma, 2003; Papathoma et al., 2003; Papathoma and Dominey-Howes, 2003).
Introduction
made to reduce its contribution to vulnerability. This required each of the attributes to be ranked in order of importance – a subjective procedure that relies heavily on the expert judgment of the authors. A review of the PTVA-1 vulnerability attributes (Dominey-Howes and Papathoma, 2007) using post-event data from the Indian Ocean Tsunami lead to the development of a revised version of the model, PTVA-2. Although this study confirms that many of the PTVA-1 attributes correlate very well with the type and severity of the damage that was observed, PTVA-2 features slight changes to the ranking and details of the attributes. A revised parameters list is published in (Dominey-Howes et al., 2009) and used to provide Probable Maximum Losses (PML) estimates for a tsunami event in Seaside, Oregan, USA. Hence, the attributes within the PTVA Model may be considered appropriate for use in assessing vulnerability and it is believed offers a robust framework to explore building vulnerability in the absence of validated engineering vulnerability assessment models. However some concern has been expressed about the subjective attribute ranking procedure (Dall'Osso et al., 2006).
1.2.2 The Proposed Methodology
The methodology developed and tested within this PhD is a multi-scale approach based on two consecutive phases, working at different spatial scales. Such phases are:
1. Assessment of tsunami vulnerability of regional or national costal zones – geographic scale of 1:150.000 – spatial resolution: 90m
2. Zoom on “vulnerability hot spots”: assessment of tsunami vulnerability of single buildings, within a limited coastal tract (e.g. a costal settlement, a urban suburb, etc.) – geographic scale of 1:5000 – spatial resolution: 1m
In both phases, I maximized the percentage of data obtained through the best available geomatic and remote sensing technology (analysis of satellite imagery and radar surveys, use of the GIS).
Both in phase 1 and 2, the main attributes controlling the vulnerability of coastal zones are mapped and inserted into the GIS. Afterwards, such attributes are crossed with the exposure to tsunami inundation and, for every exposed area/object, a relative vulnerability index is calculated. Results are shown in thematic vulnerability maps, in which different coastal features and objects (land use classes, buildings, etc) are displayed with a colour code, according to their vulnerability index score. In particular, the vulnerability maps generated in phase 1 have a scale of 1:150.000, while
Introduction
Given the strong difference of the two phases - in terms of scale of analysis - each of them is carried out following a different methodology. From a technical perspective (data required, data gathering and analysis, results), phase 1 and 2 are thus completely independent. Nonetheless, as already mentioned, results of phase 1 can be used to select the “vulnerability host spots” of phase 2.
In order to be tested, methods adopted in phase 1 and 2 have been applied to three different study areas:
- the method adopted in phase-1 has been applied to assess the tsunami vulnerability of the whole western coast of Thailand (Dall’Osso et al, in review-b);
- the method adopted in phase-2 has been applied to two selected coastal suburbs of Sydney (Australia) (Dall’Osso et al., 2009a; Dall’Osso et al., 2009b; Dall’Osso and Dominey-Howes, in review) and to the Aeolian Islands, in the South Tyrrhenian Sea, Italy (Dall’Osso et al., in review-a).
Introduction
1.2.2.1 Phase 1 – The small-scale assessment: overview of the method
The methodology developed for phase-1 is fully based on the use of satellite surveys and GIS. The vulnerability level of coastal zones is calculated as a function of the following input-parameters:
- land cover class (urbanized areas - high density, urbanized areas - low density, agriculture, forest, coastal vegetation, lakes and rivers)
- type of shoreline (with coastal infrastructure, beaches, pocket beaches, coastal vegetation - mangroves, high ground, low ground)
- distance from the shoreline
- topography (elevation above mean sea level)
Thanks to the small scale of the assessment, all of the required data can be obtained from ASTER imagery (Advanced Spaceborn Thermal Emission and Reflection Radiometer) and SRTM v.3 elevation model (Shuttle Radar Topography Mission – version #3), or calculated through the GIS.
ASTER images are composed by 14 overlapping spectral bands, with a geometrical resolution ranging from 15m (first three bands) to 90m (last 5 bands) (Abrams, 2000; Yamaguchi et al., 2001). Each image covers an area of 60x60 km. At the time this work was carried out, ASTER images could be purchased from the USGS (United States Geological Surveys) website at the price of 80 USD each.
The good spectral and geometrical resolution, plus the size of the area covered and the economic accessibility make ASTER images extremely suitable for environmental analysis at regional or national scale.
Data on land cover are obtained through a semi-automatic algorithm - called “supervised classification” - applied to a band subset of every ASTER image. Broadly speaking, the algorithm is able to identify, within the ASTER bands, the “spectral signature” of different land cover classes. Data on the type of shoreline are also extracted from ASTER images, trough a photo-interpretation process of first three bands, which have the best geometrical resolution.
SRTM v.3 is an interpherometric DEM (Digital Elevation Model) produced and freely distributed by NASA. It has a horizontal geometrical resolution of 90 m and a reported vertical accuracy of 10 m (root mean square error). Version 3 has been successfully used in several flood studies
(Theilen-Introduction
Finally, the distance from the shoreline is calculated within the GIS, by means of a specific spatial analysis tool.
In comparison to existing methods, this approach provides a more complete vulnerability assessment, as it considers the physical attributes of coastal zones besides their exposure to inundation. Also, this method goes beyond Wood’s (2009), as it exploits the flexibility and higher resolution (both spectral and geometrical) of the newer ASTER sensor and it can be applied to every coastal area, because no pre-existing tsunami-hazard database is required.
A more detailed description of this method and its application to the western coast of Thailand is provided in Paper n.1 of the present document: Dall’Osso et al. (in review-b): “A novel method for assessing tsunami vulnerability at the regional scale using ASTER imagery”.
1.2.2.2 Phase 2 – The high-scale assessment: overview of the method
At this end of the spatial scale, our analysis focuses on the vulnerability of single buildings. The method adopted in phase-2 is based on the already existing PTVA Model. However, I improved the PTVA Model by introducing a multi-criteria approach to the assessment of building vulnerability. The vulnerability of every building we examined is calculated from a combination of damage that would be experienced due to the hydrodynamic forces during inundation and that associated with water intrusion. These two damage processes have been evaluated independently using a different set of building attributes. The vulnerability to structural damage has been assessed by considering contributions of all the original PTVA Model attributes, plus some newly-introduced elements (including foundation type and preservation condition). Also, contributions have been weighted using a new approach based on pair-wise comparisons between attributes - a method typically used in multi-criteria analysis and Analytic Hierarchy Process (Saaty, 1986). Thanks to this technique, the contribution made by separate attributes to the structural vulnerability of a building can be compared via a rigorous mathematical approach. This avoids biases and reduces to a minimum the inevitable subjective component of every decision making process. Therefore, the method we used here is an improved version of the existing PTVA-2 approach, and it has been named “PTVA-3
Introduction
satellite or aerial images having a spatial resolution on the order of 1 m (e.g. Quickbird, Ikonos, World Wiew). Remaining building attributes need to be obtained through field surveys.
As in phase-1, the exposure to inundation is calculated from the topography of the study area. However, in order to calculate the depth of water expected to hit each building, the spatial resolution and vertical accuracy of the DEM must not exceed 1m. Currently, such performances are provided by aerial LiDAR (Light Detection And Ranging) surveys.
A detailed description of the PTVA-3 Model and its improvements with respect to previous versions is provided in Paper n.2 of the present document: Dall’Osso et al. (2009b): “A revised (PTVA) model for assessing the vulnerability of buildings to tsunami damage”. The same paper includes a first test of the PTVAm-3 undertaken using building data from Maroubra beach, a coastal suburb of Sydney – Australia.
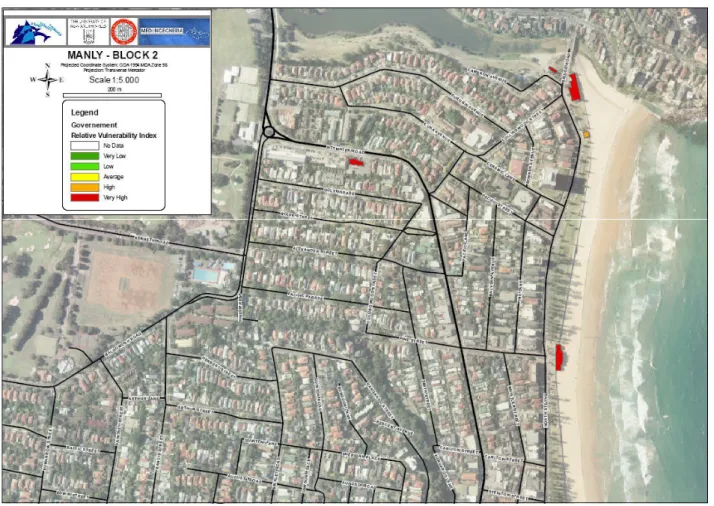
Results of a further application of the PTVAm-3 to a much larger study area (i.e. the Council of Manly – Sydney) are presented in Paper n.3: Dall’Osso et al. (2009a): “Assessing the vulnerability of buildings to tsunami in Sydney”.
Implications of the PTVAm-3 output for coastal planners and risk managers are discussed in Paper n.4 of the present thesis: Dall’Osso and Dominey-Howes (in review): “‘Reducing the loss’ - using high-resolution vulnerability assessments to enhance tsunami risk reduction strategies “.
Finally, the PTVAm-3 has been applied and validated at the Aeolian Islands, in Italy. Results of this work are discussed in Paper n.5: Dall’Osso et al. (in review-a): “Assessing The Vulnerability Of Buildings To Tsunami Damage In The Aeolian Islands, Italy – Application And Validation Of The Ptva – 3 Model”.
Paper n.1: A novel method for assessing tsunami vulnerability at the regional scale using ASTER imagery Dall’Osso et al., (in review)
Paper n. 1
A novel method for assessing tsunami
vulnerability at the regional scale using ASTER
imagery
Filippo Dall’Osso, Alessandra Cavalletti, Francesco Immordino, Marco Gonella, Giovanni Gabbianelli
Paper submitted to the “Italian Journal of Remote Sensing” ISSN 1129-8596
Paper n.1: A novel method for assessing tsunami vulnerability at the regional scale using ASTER imagery Dall’Osso et al., (in review)
Paper n.1: A novel method for assessing tsunami vulnerability at the regional scale using ASTER imagery Dall’Osso et al., (in review)
A novel method for assessing tsunami vulnerability at the
regional scale using ASTER imagery
Filippo Dall’Osso1,3, Alessandra Cavalletti2,3, Francesco Immordino3, 4, Marco Gonella1,3, Giovanni Gabbianelli1
[1] {CIRSA, Department of Environmental Science, University of Bologna – 163, via S. Alberto, 48100 Ravenna, Italy}
[2] {IDRA, Institute for Environmental Research - 37, via Kennedy, 44100 Ferrara, Italy}
[3] {Med Ingegneria S.r.l. Environmental Engineering - 37, via Kennedy, 44100 Ferrara, Italy}
[4] {ENEA, Italian National Agency for New Technologies, Energy and Sustainable Economic Development – 4, via Martiri di Montesole, 40129 Bologna, Italy}
Correspondence to: F. Dall’Osso ([email protected])
Abstract
We present here a novel method to assess coastal vulnerability to tsunami, based on GIS (Geographical Information System), ASTER imagery (Advanced Spaceborn Thermal Emission and Reflection Radiometer) and SRTM-3 elevation model (Shuttle Radar Topography Mission-3). We developed this method within the CRATER project (Coastal Risk Analysis for Tsunamis and Environmental Remediation) and applied it on the whole western coast of Thailand. As result, we generated a set of vectorial vulnerability maps at scale of 1:150.000. This approach provides a low-cost and quick tool to analyze extended coastal tracts, and prioritize investments for prevention measures or for further high-resolution analysis.
1. Introduction
The Indian Ocean Tsunami (IOT) of December 2004 clearly demonstrated that a large teletsunami can have major impacts on low lying coastal areas of those countries that surround the ocean basin.
Paper n.1: A novel method for assessing tsunami vulnerability at the regional scale using ASTER imagery Dall’Osso et al., (in review)
There are many definitions of vulnerability, but at the broadest level, it is agreed as meaning “potential for damage”. Godshalk et al. (1991) describe vulnerability as “the susceptibility to injury or damage from hazards”, while according to Mitchell and Cutter (1997) vulnerability is “the potential for loss or the capacity to suffer harm from a hazard. It can generally be applied to individuals, society, or the environment”. The United Nations (1992) describe vulnerability as the “degree of loss (from 0% to 100%) resulting from a potentially damaging phenomenon”.
The 2004 IOT caused highly variable damage within the coastal zones of nine countries from South East Asia (Indonesia, Thailand, Myanmar, Bangladesh, Sri Lanka, India, Maldives) to Eastern Africa (Kenya and Somalia) more than 4500 kms from its source (Nadim and Glade, 2006; Lovholt et al., 2006; Thanawood et al., 2006; Matsutomi and Sakakyama., 2006; Titov et al., 2005).
Given the low frequency of tsunamis and the potential scale of the affects, local and national government agencies faced with the task of developing appropriate tsunami disaster risk reduction strategies need appropriate tools to enable them to assess vulnerability at various scales. National and local administrations need specific tools to analyze existing vulnerability, prioritize prevention measures and address available financial resources in most critical areas.
For a tsunami of any given magnitude, the vulnerability of exposed coastal areas may be estimated by taking into consideration all human and environmental factors that contribute to the expected level of damage. The choice of factors that can/should be analysed is dependent on the scale and the accuracy of the results required by decision makers. For example, the vulnerability of a single building may be assessed via an analysis of factors related to its physical features (e.g., construction material, number of stories etc). Conversely, assessment of the vulnerability of an entire coastal region requires other datasets at completely different scales (e.g., land cover, coastal geomorphology etc). Consequently, the types and scales of analysis influence the volumes and accuracy of data needed. Outputs from the vulnerability assessment process can be easily displayed via simple, clear thematic maps (Cutter, 2003; Williams and Alvarez, 2003).
At present, methods of tsunami vulnerability assessment are mainly undertaken at high spatial resolution (Dall’Osso et al., 2009a; Dall’Osso et al., 2009b; Dominey-Howes, et al., in press; Garcin et al., 2008; Taubenbock et al., 2008; Aitkenhead, 2007; Dominey-Howes and Papathoma,
Paper n.1: A novel method for assessing tsunami vulnerability at the regional scale using ASTER imagery Dall’Osso et al., (in review)
spots must be chosen among all exposed coastal sites, on the basis of specific LGAs requests, or scientific interests based on past tsunamis.
At the other end of the spatial scale, analysis at regional or national levels use satellite imagery or topographic data to identify and map areas that are explosed to or at risk from tsunami flooding (Theilen-Willige, 2008; Chandrasekar et al., 2007; Theilen-Willige, 2006). However, within those areas, the vulnerability level depends also on the environmental and socio-economic variability, which is not considered by most of such approaches. Land cover data were considered by Wood (2009), in a study aimed at identifying the tsunami prone land along the Oregon coast of the United States. Wood extracted land cover data from ETM Landsat satellite images and coupled these with pre-existing tsunami-hazard information. Although this approach is one of the few to consider the integration of socio-economic and environmental data, it is based on the use of a pre-existing database of tsunami hazard information which is highly unikely to be available elsewhere, making the application of Wood’s approach problematic.
This paper outlines an innovative new method for undertaking rapid, regional to national scale assessments of coastal vulnerability to tsunamis that may be applied anywhere. The data needed to undertake the vulnerability analysis are easily gathered from readily available ASTER satellite images (Advanced Spaceborn Thermal Emission and Reflection Radiometer) and 3s-SRTM-v3 (3 arc-seconds Shuttle Radar Topography Mission, version 3) digital elevation models. Results of the vulnerability assessment can be displayed via GIS as a series of thematic maps at a scale of 1:150,000 and a horizontal resolution of 90 m. Our approach goes beyond that of Wood (2009) as it exploits the flexibility and higher resolution (both spectral and geometrical) of the newer ASTER sensor. It has wide applicability since it is not predicated on the need for detailed tsunami hazard or tsunami inundation zones.
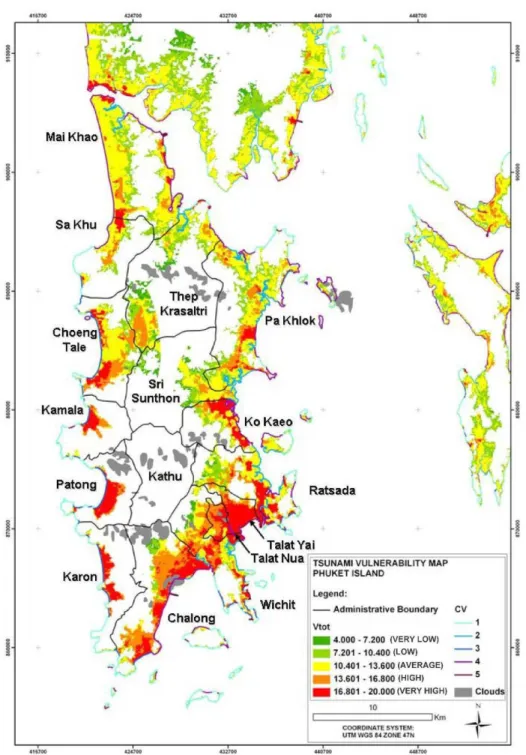
We applied test our new method along the entire western coast of Thailand as part of the CRATER Phase II (Coastal Risk Analysis for Tsunamis and Environmental Remediation) project. Because of the large geographic region involved in the original CRATER project, the coast of Thailand was divided in to 12 separate mapped areas. However, here we just present a case study of Phuket Island to illustrate the capability of our approach. Readers interested in the results for the other coastal zones of Thailand zones can contact the authors and ask for the CRATER final report.
For our inundation scenario we considered a single wave (rather than wave train) generating a run-up run-up to 25 m a.m.s.l. (above mean sea level) inundating to a distance of 5 kms. Given the characteristics of the inundation generated by the 2004 IOT (Hori et al., 2007; Siripong, 2007;
Paper n.1: A novel method for assessing tsunami vulnerability at the regional scale using ASTER imagery Dall’Osso et al., (in review)
2. The Developed Method
2.1 Measuring the vulnerability level: required data
Data contributing to the general vulnerability level has been chosen on the basis of the analysis scale (1:150.000), the extent of the study area, and previous post-tsunami surveys. We analyzed the vulnerability of coastal zones and inland areas using the following:
- for coastal zones: infrastructural, geomorphological and ecological features; - for inland areas: land use, topography and distance from the shoreline.
Coastal zones: According to field surveys undertaken after the 26th of December IOT, the highest damages occurred in urbanized areas (harbors, wharfs, aquaculture plants), especially if located behind long and flat shorelines (Ghobarah, 2006; Matsutomi et al., 2006; Darlymple and Kriebel, 2005; Thanawood, 2004). In particular, beaches experienced very high changes during backwash, which eroded sediment and deposited it over coral reefs (UNEP, 2005). This scouring effect appeared to be more evident for long and wide-open beaches in flat areas, rather than in small bays with pocket beaches. Strand et al. (2005) suggested that this could be due to the higher amount of water flowing inland and back to the sea after the inundation. Coastal geomorphology was found to be an important factor controlling the tsunami effects also by Nainarpandian et al. (2007).
Another key-role of coastal ecological features was played by mangrove forests, that suffered some damages from the wave impact and the strong sedimentation rate, but also behaved as a protection for inland areas. Mangrove roots and branches reduced the flow velocity and trapped sediment and debris (Rabindra et al., 2008; Cochard, 2008; Bhalla R.S., 2007; EJF, 2006; Chang et al., 2006; UNEP, 2005).
Inland areas: the vulnerability of inland areas is strictly dependent on the overall value of each land portion that could be partially or completely damaged during the inundation. That value includes socio-economic aspects (population, buildings, economic resources) and environmental features (natural resources) (Wood, 2009). Given our scale of analysis, we considered land use as a
Paper n.1: A novel method for assessing tsunami vulnerability at the regional scale using ASTER imagery Dall’Osso et al., (in review)
Finally, the distance from the shoreline was also considered as a factor affecting the vulnerability of inland areas because of the dissipation of the water flow energy, caused the friction effect of soil during the inundation (Iverson and Prasad, 2006).
2.2 Data gathering and analysis: ASTER imagery and SRTM elevation model We used a set of 15 daytime ASTER images to extract information about coastal geomorphology, land use and distance from the shoreline along the entire western coast of Thailand. Phuket Island was fully covered by a single image, taken on the 8th of February 2005 (Fig. n 1a).
The ASTER sensor has a spectral resolution of 14 bands. The first three bands are in the visible-near infrared (VNIR) and they have a spatial resolution of 15m. Six are in the shortwave infrared (SWIR) with a spatial resolution of 30 m. Five are in the thermal infrared (TIR), with a spatial resolution of 90 m (Abrams, 2000; Yamaguchi et al., 2001). Each image covers an area of 60x60 km and the repeat cycle is 16 days.
During the first phase of the work, we used the software ENVI 4.3 to plot all of the ASTER images (colour composite scheme RGB: 3N, 2, 1) and generate a mosaic. We then saved it into a geotiff file and imported into the GIS. The whole GIS database we built was georeferenced using ASTER pictures as the cartographic base of reference.
Data about topography were obtained through the use of a 3s SRTM-v3 Digital Elevation Model
(DEM), version-3. SRTM is an interpherometric DEM produced by NASA
(http://seamless.usgs.gov/products/srtm3arc.php#download). The SRTM DEM we used has a horizontal geometrical resolution of 90 m and a reported vertical accuracy of 10 m (root mean square error). Version 3 has been adjusted for radar speckle errors that often affect coastal flat areas. SRTM DEM have been effectively used in several flood studies (Theilen-Willige B., 2006; Demirkesen et al., 2007). Sanders (2007) compared performances of SRTM DEM with other types of on-line available DEMs (1/9 s IfSAR, 1/3 NED, 1 s NED and 1 s SRTM) and highlighted utility of SRTM data as a global source for flood modelling purposes, especially after correction for radar speckle errors. Furthermore, the SRTM vertical accuracy for relatively flat terrain was found to be better than in high relief areas, which is advantageous for coastal flood studies (Sanders, 2007). Coastal zones: we extracted data about coastal zones via a visual photo-interpretation of the ASTER images. We digitazed the whole coastline and divided it into 6 geomorphologic classes (Fig. n 1a) expressing different vulnerability levels to tsunami. Photo-interpretation was undertaken at the maximum detail level allowed by ASTER band 1 to 3N (15 m), which is consistent with our
Paper n.1: A novel method for assessing tsunami vulnerability at the regional scale using ASTER imagery Dall’Osso et al., (in review)
scale of analysis. We assigned each class a vulnerability score (CV, Coastal Vulnerability score) ranging between 1 (minimum vulnerability) and 5 (maximum vulnerability) (Tab. n 1).
Land use: ASTER images have been widely used for the supervised classification of land use type (Yuksel et al., 2008; Buhe et al., 2007; Jianwen and Bagan, 2005), in natural hazard risk analysis (Kamp et al., 2008; Hubbard et al., 2007; Liu et al., 2004), but not to study tsunami vulnerability assessment. We extracted data about land use via a combination of visual photo-interpretation of the ASTER images (within the GIS) and a supervised pixel-based classification of bands 1 to 9 with ENVI 4.3. We needed to undertake visual analysis of some of the required land use elements because the ENVI classification algorithm could not distinguish between the spectrums of agricultural fields and urban areas. We could however, identify urban areas and divide them into two sub-classes according to building density. Different density levels were identified according to all the rules of the photo-interpretation technique, based upon building colours, textures and shapes. Where present, clouds and cloud shades (where no data was recognizable) have been digitazed and added to the GIS database (Fig. n 1b).
The ENVI 4.3 classification algorithm was then applied to extract the following land use classes: (a) agricultural fields, (b) forests, (c) lakes, channels and water pools and (e) mangroves. Before running the classification algorithm, ASTER bands 4 to 9 were registered and re-sampled at the geometrical resolution of 15 m, using bands from 1 to 3N as a reference and a set of 15 ground control points over Phuket Island. We also generated a new band for the Normalized Difference Vegetation Index (NDVI), that is calculated as follows:
NDVI = (
ρ
IR -ρ
R)/ (ρ
IR +ρ
R)Where:
- ρIR is the spectral reflectance measurement of the near infrared band (band 3N in ASTER images);
- ρR is the r is the spectral reflectance measurement of the visible red band (band no. 2 in ASTER images).
Paper n.1: A novel method for assessing tsunami vulnerability at the regional scale using ASTER imagery Dall’Osso et al., (in review)
The Regions Of Interest (ROI), that are required for the supervised process were selected following field surveys undertaken on Phuket Island in 2005 and cross-checked using 2008 Quickbird images available on-line at Google Earth. We chose 5 to 10 ROIs for each of the four land use classes identified (water, mangroves, agriculture, forest). The exact number of ROI for each class was decided and validated following the results of the spectral separability test, based on the Jeffries-Matusita index (Richards, 1999).
Once a validated set of ROI per each land-use class was identified, we could run the classification process (we used the “maximum likelihood” algorithm). As an output, ENVI 4.3 classified every image pixel into one of the four land use classes. We verified the reliability of outputs using the confusion matrix method (Van Genderen et al., 1978). The overall classification accuracy (the ratio between the number of pixels correctly classified and the total number of pixels) was 98%. Results of the classification and photo-interpretation were joined together into a single land use map (Fig. n 1b).
A Land Use Vulnerability score (LUV), ranging from 1 to 5, was assigned to each land use class (Tab. n. 2). Note that low scores are given to forest and mangroves, because although they have an important natural value, the damages they would suffer have been scaled with respect to those of urbanized areas, that have been considered the most vulnerable. The class “water” includes pools for aquaculture, that together with agriculture is one of the primary economic industries for Thailand. Both aquaculture plants and agricultural crops suffered heavy damage during the 2004 tsunami (Wartnitchai et al., 2005, Mapa et al., 2005). Highest vulnerability scores are assigned to urban areas. To emphasize the difference between the vulnerability of buildings and other land use classes, we left a gap in the scores scale (none of the classes has a vulnerability score of 3).
Topography: SRTM data were downloaded in a .tiff format and converted to a vectorial dataset through ArcGIS 9.2. The whole study area was dived into cells with sides of 90 meters associated with an average topographic value expressed in meters above mean sea level (m a.m.s.l.). Since the vertical domain of analysis includes only areas lower than 25 m a.m.s.l., all of the cells up to 25 m a.m.s.l. were extracted from the DEM and displayed in a new map, after being divided into equal intervals of 5 meters. Elevation Vulnerability scores (EV) were assigned to each interval according to Table n 3 (Fig. n 2a).
Distance from the shoreline: Since the maximum wave inundation 2004 exceeded 3 kms at Khao Lak, Phang-Nga province (Siripong, 2007), we set the horizontal domain of the analysis to the 5th kilometer inland. Using the ArcGIS 9.2 “buffer” tool, we divided the first 5 kilometers of land into
Paper n.1: A novel method for assessing tsunami vulnerability at the regional scale using ASTER imagery Dall’Osso et al., (in review)
until the 1st kilometre inland) to 1 (minimum vulnerability, from the 4th to the 5th kilometre inland) (Tab. n 4). Please note that the final domain of the analysis is given by a spatial intersection between the horizontal and the vertical domains, which means that we assessed the vulnerability of only those areas that fall within 5 kilometers from the shoreline AND have an elevation smaller than 25 m a.m.s.l.
2.3 Calculating the overall vulnerability level
We calculated the vulnerability of the coastline and inland areas with two different indexes. The coastline vulnerability index scores are summarized in Table n 1.
An overall vulnerability index of inland areas (Vtot) was calculated by joining together contributions made by single vulnerability factors (land use, topography, distance from the shoreline). This index was assigned to each land portion generated through a geometrical intersection among the three factor maps. The intersection was executed though the ArcGIS 9.2 tool called “intersect”. This process generated a new polygon shapefile, containing only those areas that were common to all the three factor maps. As a consequence, we calculated a Vtot value for all of the areas falling within the first 5 kilometers of the shoreline and having a topographical elevation smaller than 25 meters. Vtot scores were calculated as follows:
DV EV LUV
Vtot = 2 ± ± Vtot ∈[4,20]
We gave LUV a weight of 2 because it gives information on the socio-economic and environmental value of affected areas, while EV and DV just set the domain and the entity of the inundation.
3. Results
Vulnerability scores we gave to different coastal morphologies (CV) and different type of inland areas (Vtot) have been stored into a GIS, together with all inputs and the ASTER image. We used
Paper n.1: A novel method for assessing tsunami vulnerability at the regional scale using ASTER imagery Dall’Osso et al., (in review)
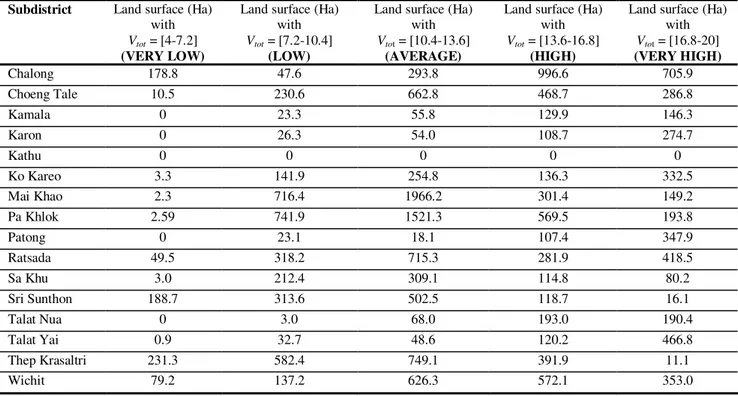
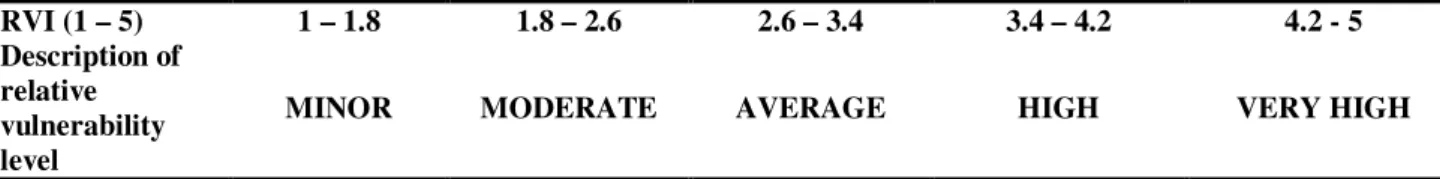
of those vulnerability classes across all Phuket subdistricts (tambon). The surface extent of different vulnerability classes in every subdistrict is summarized in Table n 5.
The most vulnerable areas are located in the southern part of Phuket Island, within the subdistricts of Chalong, Wichit, Talat Nua, Talat Yai and Ratsada, where the city of Phuket is located. In that area most of the inundated zones have “High” and “Very High” vulnerability scores. Excluding the peninsula of Wichit and the mangroves in Ratsada, the coastline vulnerability index (CV) of that area ranges between 4 and 5.
On the east coast, the bays of Karon, Patong, Kamala and Choeng Tale have mainly “High” and “Very High” vulnerability scores. However, the extent of the inundated area is much smaller than at Phuket Town and CV values are average (CV=3).
The inundated areas of Sa Khu and Mai Khao have basically an “Average” Vtot, except of the Phuket International Airport, which is located at the boundary between the two subdistricts and has “High” and “Very High” scores. CV values ranges between 4 and 5, aside from a small mangroves area at north and the promontory in the southern part of Sa Khu, which would not be inundated. On the north-western coast Vtot is mainly “Low” to “Average” although it rises to “Very High” at Pa Khlok Town. CV reaches very high (CV=5) scores at several beaches within the subdistrict of Pa Khlok, as well as at Pa Khlok Town. Within the subdistrict of Ko Kaeo Vtot and CV are “High” to “Very High”.
4. Discussion and Conclusion
The method we described allows to generate tsunami vulnerability maps at the scale of 1:150.000 covering whole regional or national areas. Maps show the patterns of two different tsunami vulnerability indexes: one for coastal zones (CV) and one for inland areas (Vtot). End-users will need to consider both indexes to have a general view of the vulnerability distribution.
We showed an application on Phuket Island, Thailand. Required input have been entirely extracted from satellite products: a visual photo-interpretation of ASTER images provided data on coastal morphology, while the land use was obtained through a supervised classification of ASTER bands from 1 to 9 (plus a NDVI band); we derived topography from an SRTM DEM and calculated the distance of inland areas from the shoreline through a GIS application.
As shown by the map in Figure n 3, most vulnerable inland areas resulted to be located in highly urbanized zones close to the shoreline. However, not all urbanized areas have been judged highly vulnerable, since also topography and distance from the coast have been considered in the
Paper n.1: A novel method for assessing tsunami vulnerability at the regional scale using ASTER imagery Dall’Osso et al., (in review)
Nua and Chalong) and all the bays on the western coast (subdistricts of Karon, Patong, Kamala). All these areas are located right on the coast, they have a rather flat topography and an high density of buildings.
The only areas in which Vtot and CV scores could not be calculated are those covered by clouds at the moment the images were taken. However all the chosen pictures have a cloud coverage lower than the 10%.
The scenario we adopted consists in a “flat” inundation, given by a single wave hitting every point of the shoreline with the same height and able to reach inland areas located up to 25 meters a.m.s.l., within the first 5 Km from the shoreline. The choice of assuming the inundation to be “flat” and given by a single wave is an approximation that we judged to be acceptable, since at the moment this study was undertaken neither a probabilistic tsunami assessment nor a wave numerical simulation were available for such a large area. As a consequence, vulnerability maps that can be created through this approach leave aside the location of the tsunami generation site and the main direction of the tsunami propagation.
However until a probabilistic scenario is not available it will not be possible to predict accurately all of the tsunami features, but LGA’s need to address such vulnerability issues now. This method may thus find many applications as a precautionary tool for supporting decision makers in long term urban planning and emergency strategies.
The use of remote sensing data allows to asses vulnerability to tsunami on very extended areas, at national or even at ocean basin scale, with a relatively small amount of time and money. To our knowledge, this is the first work aimed to the creation of a methodology for tsunami vulnerability analysis at a medium-small scale, coupling land use data from ASTER imagery and SRTM-3 topography. Most of the existing methods work at the scale of single building/infrastructure and can be applied only to pre-selected spot areas. A low scale approach like the presented one may be useful to analyze more extended coastal zones and decide whether and where further high-detail analysis should be undertaken.
Furthermore, because of world-coverage and availability of the input data required, this method can be applied anywhere and it doesn’t need any pre-existing information about tsunami
inundation-Paper n.1: A novel method for assessing tsunami vulnerability at the regional scale using ASTER imagery Dall’Osso et al., (in review)
References
Abrams M.: “The Advanced Spaceborne Thermal Emission and Reflection Radiometer (ASTER): data products for the high spatial resolution imager on NASA's Terra platform”, International Journal of Remote Sensing, 21, No. 5, 847 – 859, 2000.
Aitkenhead M.J., Lumsdon P., Miller D.R.: “Remote Sensing-Based Neural Network Mapping Of Tsunami Damage In Aceh, Indonesia”, Disasters, Blackwell Publishing, 31, No.3, 217-226, 2007.
Bhalla R. S.: “Do Bio-Shields Affect Tsunami Inundation?”, Current Science, 93, No. 6, 2007.
Buhe A., Tsuchiya K., Kanenko M., Ohtaischi N., Halik M.: “Land Cover Of Oases And Forest In Xinjiang, China Retrieved From Aster Data” Advances In Space Research 39, 39-45, 2007.
Chandrasekar N., Immanuel J. L., Sahayam J. D., Rajamanickam M., Saravanan S. : “Appraisal of tsunami inundation and run-up along the coast of Kanyakumari District, India – GIS analysis”, Oceanologia, 49(3), pp. 397-412, 2007.
Chang S. E., Adams B. J., Alder J, Berke P., Chuenpagdee R., Ghosh S., Wabnitz C.: “Coastal Ecosystems and Tsunami Protection after the December 2004 Indian Ocean Tsunami”, 22, No. S3, S863-S887, 2006.
Cochard R., Ranamukhaarachchib S. L., Shivakotib G. P., Shipinb O.V., Edwardsa P. J., Seelandc K. T.: “The 2004 Tsunami In Aceh And Southern Thailand: A Review On Coastal Ecosystems, Wave Hazards And Vulnerability”, Perspectives in Plant Ecology, Evolution and Systematics, 10, 3-40, 2008.
Cutter S.L., Bryan J.B., Shirley W.L.: “Social Vulnerability to Environmental Hazards”, Social Science Quarterly, 84, No.2, 2003
Dall'Osso, F., Gonella, M., Gabbianelli, G., Withycombe, G., and Dominey-Howes, D.: “A revised (PTVA) model for assessing the vulnerability of buildings to tsunami damage”, Nat. Hazards Earth Syst. Sci., 9, 1557-1565, 2009
Dall’Osso, F., Gonella, M., Gabbianelli, G., Withycombe, G. and Dominey-Howes, D.:” Assessing the vulnerability of buildings to tsunami (in Sydney)”, Nat. Hazards Earth Syst. Sci., (in press).
Paper n.1: A novel method for assessing tsunami vulnerability at the regional scale using ASTER imagery Dall’Osso et al., (in review)
Demirkesen A. C., Evrendilek F., Berberoglu S., Kilic S.:“ Coastal Flood Risk Analysis Using Landsat-7 ETM+ Imagery and SRTM DEM: A Case Study of Izmir, Turkey”, Environmental Monitoring And Assessment, 131, 293-300, 2007.
Dominey-Howes, D. and Papathoma, M.: “Validating a Tsunami Vulnerability Assessment Model (the PTVA Model) Using Field Data from the 2004 Indian Ocean Tsunami”, Natural Hazards, 40, 113-136, 2007.
Dominey-Howes, Dunbar P., Verner J. and Papathoma-Köhle, M.: “Estimating probable maximum loss from a Cascadia tsunami”, Natural Hazards And Earth System Sciences, in press.
EJF (Environmental Justice Foundation): “Mangroves: Nature’s Defence Against Tsunamis - A Report On The Impact Of Mangrove Loss And Shrimp Farm Development On Coastal Defences”, London, 2006.
Garcin M., Desprats J.F., Fontaine M., Pedreros R., Attanayake N., Fernando S., Siriwardana C. H. E. R., De Silva U., Piosson B.: “Integrated Approach For Coastal Hazards And Risks In Sri Lanka”, Natural Hazards And Earth System Sciences, 8, 577-586, 2008.
Ghobarah, A., Saatcioglu, M., Nistor, I.: “The Impact Of The 26 December 2004 Earthquake And Tsunami On Structures And Infrastructure”, Engineering Structures, 28, 312 – 326, 2006.
Godschalk, D.R.: “Disaster Mitigation And Hazard Management. Emergency Management: Principles And Practice For Local Government”, Drabek, E. T. and Hoetmer, G. J. (Eds.), International City Management Association, Washington DC, 1991.
Hori, K., Kuzumoto, R., Hirouchi, D., Umitsu, M., Janjirawuttikul, N., Patanakanog, B.:” Horizontal and vertical variation of 2004 Indian tsunami deposits: An example of two transects along the western coast of Thailand”, Marine Geology, 239, 3-4, 162-172, 2007.
Hubbard B. E., Sheridan M. F., Carrasco-Nùnez G., Diaz-Castellòn R., Rodrìguez S.R.: “Comparative Lahar Hazard Mapping At Volcan Citlaltépetl, Mexico Using Srtm, Aster And Dted-1 Digital Topographic Data”, Journal Of Vulcanology And Geothermal Research, Dted-160, 99-24Dted-1,
Paper n.1: A novel method for assessing tsunami vulnerability at the regional scale using ASTER imagery Dall’Osso et al., (in review)
Kamp U., Growley B. J., Khattak G. A., Owen L. A.: “Gis-Based Landslide Susceptibility Mapping For The 2005 Kashmir Earthquake Region”, Geomorphology, 101, 631-642, 2008.
Liu J. G., Mason P. J., Clerici N., Chen S., Davis A., Miao F., Deng H., Liang L.: “Landslide Hazard Assessment In The Three Gorges Area Of The Yangtze River Using Aster Imagery: Zigui– Badong”, Geomorphology, 61, 171-187, 2004.
Lovholt F., Bungum H., HarbitzC.B., Glimsdal S., Lindholm C.D., Pedersen G.: “Earthquake Related Tsunami Hazard Along The Wastern Coast Of Thailand”, Natural Hazards and Earth System Sciences, 6, 979-997, 2006.
Mapa R.B., Wickramasinghe W.M.A.D.B., Sirisena D.N., Kendaragama K.M.A.: “Salt In The Soil”, Soil Science Society of Sri Lanka, 2005
Matsutomi H. and Sakakyama T.: “Aspects Of Inundated Flow Due To The 2004 Indian Ocean Tsunami”, Coastal Engineering Journal, 48, No.2,167-195, 2006.
Mitchell, J.T. and Cutter, S.L.: Global Change and Environmental Hazards: Is the World Becoming More Disastrous?, Association of American Geographers, Washingston DC, 1997.
Nadim F and Glase T.: “On Tsunami Risk Assessment For The West Coast Of Thailand”, ECI Conference On Geohazards, LilleHammer, Norway, 2006.
Nainarpandian C., Jeyakodi L.I., Jeyaraj D. S., Manoharan R., Sakthivel S.: “Appraisal Of Tsunami Inundation And Run-Up Along The Coast Of Kanyakumari District, India – Gis Analysis”, Oceanologia, 49, No.3, 397-412, 2007.
Papadopoulos A. and Dermetzopoulos T. : “A Tsunami Risk Management Pilot Study in Heraklion, Crete”, Natural Hazards, 18, 91-118, 1998.
Richards J. A.: “Remote Sensing Digital Image Analysis”, Springer-Verlag, Berlin, pp 240, 1999.
Papathoma, M., Dominey-Howes, D., Zong, Y., Smith, D.: “Assessing Tsunami Vulnerability, An Example From Herakleio, Crete”, Natural Hazards and Earth System Sciences, 3, 377-389, 2003.
Papathoma, M., Dominey-Howes, D.: “Tsunami Vulnerability Assessment And Its Implications For Coastal Hazard Analysis And Disaster Management Planning, Gulf Of Corinth, Greece”, Natural Hazards and Earth System Sciences, 3, 733–747, 2003.
Rabindra O., Tanak S., Toshikazu T.: “The Importance Of Mangrove Forest In Tsunami Disaster Mitigation”, The Author(s). Journal compilation, Blackwell Publishing, 2008.
Paper n.1: A novel method for assessing tsunami vulnerability at the regional scale using ASTER imagery Dall’Osso et al., (in review)
Rouse J. W., Haas R. H., Shell J. A., Deering D. W., Harlan J. C.: “Monitoring The Vernal Advancement Of Retrogradation Of Natural Vegetation. Final Report, Type III”, NASA/GSFC, Greenbelt, MD, 371 pp., 1974.
Sanders B. F.: “Evaluation Of On-Line DEMs For Flood Inundation Modelling”, Advances In Water Resources, 30, 1831-1843, 2007.
Siripong A.: “Andaman Seacoast of Thailand Field Survey after the December 2004 Indian Ocean Tsunami”, Earthquake Spectra, 22, No. 3, S187-S202, 2006
Strand C., Masek J., 2005, “Sumatra – Andaman Islands Earthquake and Tsunami of December 26, 2004 Lifeline Performance” Technical Council Of Lifeline Eartquake Engineering, Monograph n. 29, October 2005, Cap. 8
Taubenbock H., Post J., Kiefl R., Roth A., Ismail F.A., Strunz g., Dech S.: “Risk And Vulnerability Assessment To Tsunami Hazard Using Very High Resolution Satellite Data – The Case Study Of Padang, Indonesia”, Remote Sensing – New Challenges of High Resolution, Bochum, 2008.
Thanawood C., Yongchalermchai C., Densrisereekul O.: “Effects Of The December 2004 Tsunami And Disaster Management In Southern Thailand”, Science of Tsunami Hazards, 24, No.3, 206-217, 2006.
Theilen-Willige, B.: “Emergency Planning In Northern Algeria Based On Remote Sensing Data In Respect To Tsunami Hazard Preparedness”, Science of Tsunami Hazards, 25, No. 1, 3-12, 2006.
Theilen-Willige, B.: “Tsunami Hazard Assessment In The Northern Aegean Sea”, Science of Tsunami Hazards, 27, No. 1, 1-16, 2008.
Titov V., Rabinovich, B. A., Mofjeld, H. O., Thomson, E. R., Gonzalez, F. I.: “The Global Reach Of The 26 December 2004 Sumatra Tsunami”, Science, 309, 2045, DOI: 10.1126/science.1114576, 2005.
UNEP (United Nations Environment Programme): “After The Tsunami: Rapid Environmental Assessment”, 2005.
Paper n.1: A novel method for assessing tsunami vulnerability at the regional scale using ASTER imagery Dall’Osso et al., (in review)
Warnitchai, P.: “Lessons Learned from the 26 December 2004 Tsunami Disaster in Thailand” Proceedings of the 4th International Symposium on New Technologies for Urban Safety of Mega Cities in Asia, Singapore, 18-19 October, 2005.
Williams A.T. and Alvarez R.A.: “Vulnerability Assessment As A Tool For Hazard Mitigation”, Submarine Landslides and Tsunamis, Kluwe Academic Publisher, Netherlands, 303-313, 2003.
Wood, N.: “ Tsunami Exposure Estimation With Land Cover Data: Oregon And The Cascadia Subduction Zone”, Applied Geography, 2009.
Yamaguchi Y., Fujisada H., Tsu H., Sato I., Watanabe H., Kato M., Kudoh M., Kahle A.B., Pniel M.: “Aster Early Image Evaluation”, Advanced Space Research, 28, No.1, 69-76, 2001.
Yüksel A., Akay A. E., Gundogan R.: “Using ASTER Imagery in Land Use/cover Classification of Eastern Mediterranean Landscapes According to CORINE Land Cover Project”, Sensors, 8, 1237-1251, 2008.
Paper n.1: A novel method for assessing tsunami vulnerability at the regional scale using ASTER imagery Dall’Osso et al., (in review)
Figures:
Figure 1 – (a) The ASTER image used for Phuket Island (colour composite scheme RGB: 3N, 2, 1). Results of the photo-interpretation of coastal features are shown with different colours along the shoreline. (b) Land use map of Phuket Island: the classes of “agriculture”, “forest”, “mangroves” and “water” have been obtained though the multispectral classification of ASTER bands 1-9 and
Paper n.1: A novel method for assessing tsunami vulnerability at the regional scale using ASTER imagery Dall’Osso et al., (in review)
Figure 2 - (a) An “Elevation Vulnerability“ score (EV) ranging between 1 and 5 has been given to all zones lower than 25 m a.m.s.l. We set EV intervals according to Table n 3. (b)We divided the first 5 kilometers from the shoreline into 5 belts, each 1-Km wide. To every belt we gave a Distance
Vulnerability score (DV) ranging from 5 (from the shoreline until the 1st kilometre inland) to 1 (from the 4th to the 5th kilometre inland).
Paper n.1: A novel method for assessing tsunami vulnerability at the regional scale using ASTER imagery Dall’Osso et al., (in review)
Figure 3 - Vulnerability map generated for Phuket Island, obtained as an intersection of data shown in Figures n 1b, 2a and 2b.
Paper n.1: A novel method for assessing tsunami vulnerability at the regional scale using ASTER imagery Dall’Osso et al., (in review)
Tables:
Table 1 - Coastal Vulnerability scores (CV) given to each coastline class.
Coastline features:
Infrastructure Beach and Low Ground
Pocket Beach Mangroves High Ground (sea cliff)
CV score: 5 4 3 2 1
Table 2 - Land Use Vulnerability scores (LUV) given to each land use class.
Land Use classes: Urbanized Areas (high density)
Urbanized Areas (low density)
Agriculture, Lakes and Freshwater
Forest and Mangroves
LUV score: 5 4 2 1
Table 3 - EV scores have been given to all zones lower than 25m a.m.s.l.
Elevation (m
a.m.s.l.) [0-5] [5-10] [10-15] [15-20] [20-25]
EV score 5 4 3 2 1
Table 4 - Vulnerability scores (DV) given to different belts of distance from the shoreline.
Distance from the shoreline
(Km) [0-1] [1-2] [2-3] [3-4] [4-5]
Paper n.1: A novel method for assessing tsunami vulnerability at the regional scale using ASTER imagery Dall’Osso et al., (in review)
Table 5 - Surface extent of different vulnerability classes in each Phuket subdistrict. Subdistrict Land surface (Ha)
with
Vtot = [4-7.2] (VERY LOW)
Land surface (Ha) with
Vtot = [7.2-10.4] (LOW)
Land surface (Ha) with
Vtot = [10.4-13.6] (AVERAGE)
Land surface (Ha) with
Vtot = [13.6-16.8] (HIGH)
Land surface (Ha) with Vtot = [16.8-20] (VERY HIGH) Chalong 178.8 47.6 293.8 996.6 705.9 Choeng Tale 10.5 230.6 662.8 468.7 286.8 Kamala 0 23.3 55.8 129.9 146.3 Karon 0 26.3 54.0 108.7 274.7 Kathu 0 0 0 0 0 Ko Kareo 3.3 141.9 254.8 136.3 332.5 Mai Khao 2.3 716.4 1966.2 301.4 149.2 Pa Khlok 2.59 741.9 1521.3 569.5 193.8 Patong 0 23.1 18.1 107.4 347.9 Ratsada 49.5 318.2 715.3 281.9 418.5 Sa Khu 3.0 212.4 309.1 114.8 80.2 Sri Sunthon 188.7 313.6 502.5 118.7 16.1 Talat Nua 0 3.0 68.0 193.0 190.4 Talat Yai 0.9 32.7 48.6 120.2 466.8 Thep Krasaltri 231.3 582.4 749.1 391.9 11.1 Wichit 79.2 137.2 626.3 572.1 353.0
Paper n.2: A revised (PTVA) model for assessing the vulnerability of buildings to tsunami damage Dall’Osso et al., 2009
Paper n. 2
A revised (PTVA) model for assessing the
vulnerability of buildings to tsunami damage
F. Dall’Osso, M. Gonella, G. Gabbianelli, G. Withycombe, D. Dominey-Howes
Paper published on “Natural Hazards and Earth System Science”
Nat. Hazards Earth Syst. Sci., 9, 1557–1565, 2009 www.nat-hazards-earth-syst-sci.net/9/1557/2009/
Paper n.2: A revised (PTVA) model for assessing the vulnerability of buildings to tsunami damage Dall’Osso et al., 2009