University of Calabria
Ph.D. in Molecular Bio-pathology
(Disciplinary Field BIO18-Genetics)
Exploring new routes in genetic studies on
human aging and longevity
Candidate
Alberto Montesanto
Supervisor
Prof. Giuseppe Passarino
Co-ordinator
Prof. Giovanna De Benedictis
Table of Contents
SOMMARIO I
SUMMARY III
LIST OF ABBREVIATIONS IV
1. INTRODUCTION 1
o 1.1 Assessment of health status in the elderly 4
o 1.2 The biological basis of human longevity 7
1.2.1 The case-control approach 10
1.2.2 The Logistic Regression Approach 11
1.2.3 Multi-locus approach 12
1.2.4 Demographic approach 13
o 1.3 Aim of the study 15
2. SPATIAL ANALYSIS OF THE DISTRIBUTION OF THE MALE
LONGEVITY PHENOTYPE IN CALABRIA 16
o 2.1 Background 16
o 2.2 Materials and Methods 17
2.2.1 Data 17 2.2.2 Nonagenarian Rate 18 2.2.3 Spatial Analysis 19 2.2.4 Statistical analysis 19 2.2.5 Surnames 20 o 2.3 Results 21
2.3.1 Identification of Blue Zones 21
2.3.2 Surname Analysis 26
3.
A CLUSTER ANALYSIS TO DEFINE HUMAN AGING PHENOTYPES 30o 3.1 Introduction 30
o 3.2 Materials and Methods 31
3.2.1 Samples 31 3.2.2 Anthropometric characteristics 31 3.2.3 DNA analysis 32 3.2.4 Statistical analysis 32 o 3.3 Results 32 3.3.1 Phenotypic classification by CA 33 3.3.2 Check of the clusters from a phenotypic perspective 34 3.3.3 Check of the clusters from a genetic perspective 34
o 3.4 Discussion 37
4. SEX-AND-AGE SPECIFICITY OF SUSCEPTIBILITY GENES
MODULATING SURVIVAL AT OLD AGE 40
o 4.1 Introduction 40
o 4.2 Materials and Methods 41
4.2.1 Genetic data 41
4.2.2 Demographic curves 43
4.2.3 Strategies for logistic model building 44
o 4.3 Results 45 4.3.1 Logistic analysis 47 o 4.4 Discussion 51 5. CONCLUSIONS 54 6. REFERENCES 56 7. SUPPLEMENTARY MATERIAL 72
SOMMARIO
Negli ultimi decenni si è verificato un crescente interesse scientifico verso gli studi volti alla comprensione delle basi genetiche dell’invecchiamento e della longevità umana. Questo crescente interesse è giustificato dall’aumento della popolazione anziana verificatosi negli ultimi 50 anni nei Paesi sviluppati, causato da un generale miglioramento delle condizioni igienico-sanitarie. Il rapido incremento di questa fascia della popolazione rappresenta oggi un importante problema di carattere sia sanitario che sociale.
La difficoltà nello studio delle basi biologiche dell’invecchiamento e della longevità umana è principalmente dovuta (i) alla specificità dell’invecchiamento rispetto alla coorte ed alla popolazione analizzate, (ii) alla mancanza di una chiara ed oggettiva definizione del fenotipo da analizzare, (iii) alla natura poligenica della longevità umana. Sulla base di queste osservazioni, gli studi qui riportati rappresentano dei nuovi approcci per lo studio dell’invecchiamento e della longevità umana. Essi sono stati condotti su dati ottenuti dalla popolazione calabrese, caratterizzata da un’elevata omogeneità genetica e un basso tasso di immigrazione dovuti a motivi geografici, storici e sociali.
Il primo approccio che abbiamo utilizzato si basa sull’analisi spaziale degli individui longevi in Calabria. Mediante questo approccio abbiamo verificato che la distribuzione spaziale di tali individui in tale regione non è uniforme. Inoltre, mediante l’analisi dei cognomi calabresi, abbiamo verificato l’esistenza di una correlazione significativa fra inbreeding e longevità maschile in una particolare area di questa regione.
Il secondo approccio si basa sull’applicazione di una Cluster Analysis, con parametri geriatrici ben riconosciuti, per l’identificazione di “fenotipi di invecchiamento” nella popolazione calabrese. I risultati ottenuti dimostrano che i “fenotipi di invecchiamento”
identificati mediante Cluster Analysis hanno una solida base geriatrica e presentano una chiara componente genetica.
Infine, mediante un approccio multilocus, abbiamo analizzato l’influenza della variabilità di geni candidati sulla sopravvivenza in età avanzata. Sulla base di una curva di sopravvivenza sintetica ottenuta utilizzando i dati storici di mortalità della popolazione italiana e utilizzando modelli di regressione multivariati, abbiamo dimostrato che i fattori genetici influenzano la sopravvivenza in età avanzata in modo sesso ed età-specifici
I risultati qui riportati dimostrano che l’applicazione di questi nuovi approcci può risultare utile negli studi dell’invecchiamento e della longevità umana. D’altro canto, essi dimostrano come per lo studio di tali tratti complessi sia importante e necessario un approccio di tipo multidisciplinare.
SUMMARY
The past few decades has witnessed a growing scientific interest in genetic studies on human aging and longevity. This growing interest may be explained by the increasing number of elderly subjects in developed countries over the last 50 years due to the continued improvements in health care. Such a fast increase of these population segments represent a huge problem for the societies in terms of social care and welfare.
The difficulty in understanding the biological basis of human aging and longevity is mainly represented by (i) the cohort and the population-specificity of human aging and longevity, (ii) the lack of a clear and objective definition of the phenotype, (iii) the polygenic nature of the human longevity. On the basis of these observations, the studies reported here represent new approaches for the study of human aging and longevity. They were carried out on data obtained from the Calabrian population, characterized by high genetic homogeneity and a scarce level of immigration due to geographical, historical and social reasons.
The first approach we used was to analyze the spatial distribution of long-lived individuals in Calabria. Using this approach, we verified that the spatial distribution of such individuals in this region is not uniform. In addition, by using surname data, we verified a significant correlation between population inbreeding and male longevity in a particular area of this region.
The second approach is based on the application of a Cluster Analysis with well established geriatric parameters to identify aging phenotypes in the Calabrian population. The results obtained show that, the aging phenotypes recognized by Cluster Analysis are consistent from a geriatric point of view and have a clear genetic component.
Finally, using a multilocus approach, we analyzed the influence of genetic variability of candidate genes on survival at old age in good health. On the basis of a synthetic survival curve built using historic mortality data from the Italian population and using multiple regression models, we found that genetic factors influence survival at advanced ages in good health in a sex and age specific way.
The results reported here show that the application of these new approaches may be useful in human aging and longevity studies. Furthermore, they demonstrate that a multidisciplinary approach is necessary to analyze human aging and longevity.
List of abbreviations
ADL Activity of Daily LivingAPOA1 Apolipoprotein A1 APOA4 Apolipoprotein A4 APOB Apolipoprotein B APOE Apolipoprotein E BZ Blue Zone CA Cluster Analysis CR Centenarian Rate DZ Dizygote
ECHA European Challenge for Healthy Ageing
F/M Female/Male
G1 Group 1
G2 Group 2
G3 Group 3
GD Genetic Demographic model
GDS Geriatric Depression Scale
GIS Geographic Information System HSP70-1 Heat Shock Protein 70-1
HSP90α Heat Shock Protein 90 alpha HSP90β Heat Shock Protein 90 beta
IGF Insulin-like Growth Factor IGF-I Insulin-like Growth Factor I
LD Linkage Disequilibrium
MMSE Mini Mental State Examination mNR Male Nonagenarian Rate mtDNA Mitochondrial DNA
MZ Monozygote
NP Non Parametric
NR Nonagenarian Rate
OR Odds Ratio
QI (I=1,…,4) Municipalities belonging to the I-th quartile of the mNR distribution (Fig. 2, Chapter 2) or of theFisher’s alpha distribution (Fig. 5, Chapter 2)
RR Relative Risk
S(x) Synthetic survival function
S’’(x) Second derivative of the synthetic survival function S1 Sample 1 (65-85 year old subjects)
S2 Sample 2 (> 90 year old subjects)
SA Spatial Analysis
SES Socio Economic Status
SIR Silent Information Regulator SIRT3 Silent Information Regulator 3
SP Semi Parametric
TH Tyrosine Hydroxylase
1. INTRODUCTION
Aging is a complex process of progressive physical decline that characterizes every biological species and leads to a dramatic reduction of the individual survival probability and, ultimately, to death. Most of the characteristics of aging, such as lifespan, have been observed to be species specific, suggesting a genetic control on aging. On the other hand, within each species the quality and the rate of the aging process are characterized by a considerable variability, which implies noticeable differences in the individual aging phenotype and in life span. Such variability is due to the interplay of genetic, environmental and stochastic factors (Kirkwood, 2005; Herndon et al., 2002; Kirkwood and Finch, 2002). Almost every aspect of the individual phenotype undergoes modification with aging, and over the years this phenomenological complexity has led to a proliferation of ideas about specific cellular and molecular causes. Recent advances have resulted in significant progress in the theoretical underpinnings of aging research. The emerging idea is that, although aging is not a programmed process, a network of evolutionarily conserved cellular and molecular mechanisms modulates the aging process (the network theory of aging). According to this theory, aging is characterized by an age-related remodelling and adaptation of every cell and organ of the body in order to cope with the continuous attrition caused by internal and external stresses (Franceschi et al., 2000).
In the last few decades there has been a growing scientific interest regarding the basis of individual variability in aging, especially concerning humans. This growing interest may be explained by the increasing number of elderly subjects in developed countries over the last 50 years due to the continued improvements in health care (Kannisto, 1994). For instance, in 1961 the population aged 65 and older in Italy was 4.8 million (9.5% of the total population), while in 1981 this number increased up to 7.5 million (13.2% of the total population) and in 2001 it grew up to 10.6 million (18.7% of the total population). In addition, the population aged 90 and older is growing at a faster pace as it has quintuplicated in the last 10 years (Istituto Centrale di Statistica 1986; www.istat.it). Such a fast increase of these population segments represent a huge problem for societies in terms of social care and welfare. This problem is strengthened by the high prevalence among these subjects of chronic diseases, cognitive impairment and other disorders responsible for functional limitations that are often associated with aging. In order to cope with the challenges posed by the increase of the elderly population, both the European Union and
the United States of America have devoted notable resources to research on the biological basis of aging.
The studies aimed to understand the biological basis of aging in humans, as does all the research dealing with complex traits, have faced the difficulty of clearly defining the phenotypes associated with aging. In this context, particularly important is the concept of “successful aging”. The concept of successful aging, put forward by Rowe and Kahn (1987), suggested that within the category of normal aging, a distinction can be made between usual and successful aging. Although today there are a number of possible definitions of successful aging, the one proposed by the same authors, and perhaps the most inclusive, incorporates several interactive components: absence of disease, maintenance of cognitive and physical functioning, engagement with life, and longevity (Rowe and Kahn, 1998). This definition takes into account the notion that there is a distinction to be made among primary (normal), secondary (impaired), and optimal (successful) aging. Consequently, most of the studies on aging have focused on the assessment of health in the elderly, while this is still poorly understood especially for very old subjects such as nonagenarians and centenarians, and on the biological basis of human longevity.
From a genetic point of view two most important points must be taken into account in studies of human aging and longevity: the polygenic nature of the trait and the effects of a population genetic structure on the same.
The polygenic nature of human longevity
In order to infer the effect of genetic factors on the aging process, it is important to keep in mind that aging is a complex trait such that no single gene or attribute can be considered as an independent predictor of it. Morever, common genetic variants with important effects on human longevity are unlikely to exist because of the lack of Mendelian patterns of inheritance for this trait. On the contrary, many interacting genes whose individual effects are rather small probably affect survival at old age (Hjelmborg et al., 2006). Thus, studies that consider marker genotypes at one locus in connection with survival may capture only a small proportion of the total combined effects of the susceptibility genes which affect the phenotype. Since the development of complex traits involves multiple genes and their interactions, multi-locus association analyses have been proposed to overcome this kind of problem (Hoh and Ott, 2003).
Population genetic structure and human longevity
Human populations are characterized by specific gene pools which are the result of their history, in terms of chance (genetic drift), migrations and adaptative selection to environment. Recently, two main lines of evidence have shown a possible role played by the population genetic structure on human longevity. The first is the significant correlation found between population genetic patterns and Female/Male (F/M) ratio among centenarians in the Italian population (Passarino et al., 2002). The second is the observation that in Sardinia centenarians are clustered in restricted areas characterized by a high level of geographic isolation and endogamy (Poulain et al., 2004). Here, the F/M ratio among centenarians varies according to these areas. On the basis of these observations, the impact of geography on human longevity may represent a direct consequence of the genetic structure of the population.
1.1 Aassessment of health status in the elderly
The choice of a phenotype is critical for the study of a complex genetic process, such as the aging process. In the last decade most of the studies aimed at explaining the biological basis of “healthy” or “successful” aging have based their phenotype definition on survival measures, primarily on age at death or longevity (Finkel et al., 1995; McGue et al., 1993). Although longevity should imply a quality of aging which is quite good, it is common experience that nonagenarians and centenarians constitute a very heterogeneous group, and that most suffer of disabilities or diseases (Jeune, 2002). In addition, the continuous improvement of medical care is leading to an increased number of old people afflicted with many chronic diseases but surviving for many years. Therefore, an ideal definition of the aging phenotype should take into account not only the age but also the health status of the subject. To date, a quantitative definition of the health status in old subjects is still lacking. This represents a serious obstacle in disentangling the complex interplay of genetic, environmental, and historical factors that modulate the aging process and the physical decline which is associated with this process.
The arbitrary definition of healthy aging has represented for many years the most serious obstacle for the definition of a criterion to assess the health status in the elderly. Nowdays there is agreement on the fact that a multidimensional assessment could measure the capacity to function well and cope with environmental challenges in domains assessing physical, mental and social well-being (Peel et al., 2004). The effort to define a phenotype for outlining the health status in the elderly took a step forward when the frailty syndrome was recognized. Practionners and geriatric clinicians have long recognized the existence of a subset of older adults who are frail, that is a subset of old subjects who are more vulnerable than others to a number of poor health outcomes (such as falls, hospitalization and death). The identification of these subjects may represent an important step for facing the challenge posed by the aging population. However, it has been extremely difficult to define frailty and to understand its biological basis. In fact, the diagnosis of frailty was mostly subjective, and physicians seldom thought of specific treatment. The first attempts to try to set an “objective” measure of frailty have led to consider frailty as synonymous of disability, co-morbidity or advanced old age (Hoffman et al., 1996; Wagner et al., 1996; Pope and Tarlov, 1991). More recently, clinicians and investigators have begun to recognize frailty as a distinct biological geriatric syndrome. Central to the clinical definition of frailty is the concept that no single altered system defines this state, but that multiple systems are involved (Rockwood, 2005). Patients classified as frail typically
exhibit loss of muscle strength, are physically inactive, and have a slow gait, with an increased risk (and fear) of falling. They are likely to have a poor appetite and to have undergone a recent, unintentional loss of weight. Frail individuals are more likely than the non frail to experience impaired cognition and depression. A very important step forward to further understand the biology of frailty was the study by Fried and Waltson (1998). These authors developed a hypothetical “cycle of frailty” that illustrated how disease and age-related changes may trigger frailty and how disability may evolve from this condition. Figure 1 illustrates the frailty cycle and how the loss of muscle mass, altered energy expenditure, and decline in nutritional intake may lead to this cycle of decline.
Figure 1. Cycle of frailty (modified from Fried et al., 2001).
Subsequently, Fried and colleagues (Fried et al., 2001) provided a potential standardized definition of the frailty phenotype. Based on a prior research and on clinical consensus, they proposed that frailty is fundamentally a wasting syndrome, characterized by weakness and poor nutritional status. They hypothesized that a series of characteristics compose the “phenotype of frailty” and then evaluated whether this phenotype identified a subset of individuals at high risk for adverse health outcomes clinically associated with frailty. In Fried’s study, frailty was defined as a clinical syndrome of signs and symptoms in which at
least three of five possible criteria are present: (i) low grip strength, (ii) slow walking speed, (iii) low physical activity, (iv) reported unintentional weight loss, (v) self-reported exhaustion. Validation work has shown that patients meeting this definition of frailty were more likely to die, to be hospitalized, or to become disabled over 6 years of follow-up, independently of age and other risk factors for mortality (Fried et al., 2001). After Fried and colleagues had outlined the basis to clinically define the frailty syndrome, the American Medical Association stated that frail subjects represent a group of patients who present the most complex and challenging problems to the physician and health care professionals (American Medical Association, white paper on elderly health). Moreover, in 2003, the National Institute on Aging recognised frailty as a priority for research and made $ 1.8 million available for studies on this topic.
Although much of the literature on frailty focuses mainly on biological and medical factors, recent work suggests that the social network of support and psychological components may influence the quality of life at old age and in turn influence the progression of frailty. Different markers of frailty have been proposed in the literature to monitor the progression of frailty and the onset of adverse outcomes and disability. A number of scores have been also developed for use in the research setting. Although the methodological approaches to identify markers of frailty differ in the specific criteria used, mounting evidence suggests that multiple interrelated physiological systems, including neurological and musculoskeletal functioning, inflammatory status, energy metabolism, influence the health and well-being of the entire organism and are modestly altered in frail older adults. A number of potential serum markers for frailty, disability, or adverse outcomes in old patients have also been identified. These include: peripheral blood markers of inflammation (IL-6, C-reactive Protein, Serum Albumin, Cholesterol) (Cohen et al., 1997; Ranieri et al., 1998; Corti et al., 1994), Coagulation Factors (Fibrinogen, Factor VIII, D-dimer) (Cohen et al., 2003; Walston et al., 2002), IGF-I levels, creatinine, haematological parameters (haemoglobin, haematocrit) (Leng et al., 2002). Moreover, in a recent work carried out by Bartali and co-workers (Bartali et al., 2006), evidence was provided that low intakes of energy and selected nutrients (protein, vitamins D, E and folate) are independently associated with frailty.
In the long run, testing these selected physiological parameters as potential correlates of frailty may provide clues for the development of more detailed etiologic studies.
1.2 The biological basis of human longevity
The factors determining human longevity have drawn the attention of researchers from a variety of disciplines including sociologists, biologists, gerontologists, psychologists and scientists. This great interest is chiefly due to the increase of the mean average life expectancy in developed countries. Reliable data from various European and North America countries show that the population of centenarians has doubled every decade since 1960, mostly as a result of the increase in survival past 80 years of age (Jeune and Vaupel, 1995). In several countries, as in Sweden, female death rates at older ages has fallen since 1950, with a large absolute reduction at advanced ages. The pattern is similar for males, although from conception to old age males suffer higher death rates than females, and progress in reducing male mortality has generally been slower than for females. Consequently, most old people in the world are women. With more and more people celebrating their 100-year birthdays, there is a great increase in studies aimed at understanding why these people survive where others failed, and what can help to explain the life span heterogeneity. From a demographical point of view, this growth of the oldest population can be attributed to two main factors: the increase in the probability of surviving to advanced age and the reduction of mortality at older ages, occurred since 1950 (Kannisto, 1996; Vaupel, 1997).
As a complex trait, life span is controlled by the same three components which modulate multifactorial phenotypes: genes, environment and chance. Vaupel et al. (1998) summarized the impact of different factors on human longevity and proposed that conditioning factors that arise in the first part of life (socio-economic state of parents, education and month of birth, which has been found to reflect the environmental conditions during the prenatal and early postnatal period) account for 25% of the interindividual variability in lifespan; life circumstances at adult and old age (including socio-economic status (SES) and medical assistance) may account for about 50%. As for the genetic influence on longevity, based on of a previous study on twins (Herskind et al, 1996), it should account for the remaining 25% (Fig. 2).
Figure 2. Components of the variation in lifespan in contemporary populations (modified from Vaupel et al., 1998).
Interestingly, much evidence suggests that genetic factors have a different impact on survival at different ages. In 1825 Benjamin Gompertz proposed that the mortality rate increased exponentially with age (Gompertz B, 1825). However, at very old age, mortality begins to decelerate in organisms such as medflies (Carey et al., 1992), nematode worms (Brooks et al., 1994; Johnson, 1990) and humans (Thatcher et al., 1990). Different hypotheses have been formulated to explain the mortality deceleration. Most likely this occurs because frailer individuals drop out of the population, leaving behind a more robust cohort who continues to survive. As a consequence, the intra-cohort distribution of specific genotypes and other survival-related attributes changes with older and older ages (Vaupel et al., 1979; Vaupel and Yashin, 1985; Vaupel, 1997). This selecting-out process is termed demographic selection (Vaupel et al., 1998). In addition, Hjelmborg et al. (2006) by studying a large population of Scandinavian monozygotic (MZ) and dizygotic (DZ) twins found that the genetic influence on lifespan is minimal prior to age 60, but increases thereafter.
The last decade has seen a surge of activity aimed at identifying genes controlling aging and longevity in model organisms such as the nematode worm and the fruitfly. Mutations in several genes have been found to increase lifespan by slowing the aging process (Lin K et al., 1997; Lin YJ et al., 1998; Guarente et al., 2000; Arantes-Oliveira et al., 2003; Bartke et al., 2003; Hsu et al., 2003). One class of genes identified in C. elegans, Drosophila and mice define a pathway of insulin/IGF signaling (Brown-Borg et al., 1996; Kimura et al.,
1997; Clancy et al., 2001). Mutations that downregulate this pathway, such as the dwarf mutations in mice, extend life span. The dwarf mutations reduce signalling by growth hormone, which, in turn, lowers the level of IGF-1. Moreover, experiments in model organisms have shown a correlation between this pathway and the gene silencing system controlled by SIR (Silent Information Regulator) proteins (Murphy at al., 2003). Sir2 genes regulate the rate of aging in many species, modulating gene silencing and coordinating the pace of aging with the metabolic rate (Armstrong et al., 2002). Understanding the biological function of the product of such “longevity genes” turned out to be useful in studying human aging and longevity.
It is not obvious why “longevity genes” should persist in humans or any species, and to explain the persistence in different organisms of such “longevity genes” the antagonistic pleiotropic theory has been proposed. This theory was originally formulated by Williams (1957). It held that aging was due to the decline of the force of natural selection late in life, and that alleles with positive effects upon fitness early in life also have deleterious effects late in life. In this view, these later deleterious effects are the direct cause of aging (Leroi et al., 2005). Such theory remained largely untested until 1990 when different research groups observed a negative correlation between reproductive success and longevity in lines of fruit-flies (Rose, 1984; Sgrò and Partridge, 1999). Then, the antagonistic pleiotropic theory was reproposed and today it is quite popular in diverse areas of gerontology.
Taking advantage of the rapid development in molecular genetics, the past few decades have seen a significant increase in genetic studies on human longevity (De Benedictis et al., 2001). In these studies the model of centenarians emerged as crucial, as centenarians give information that no other experimental model can provide. In fact, unlike model organisms, centenarians personify the longevity phenotype naturally occurring in an outbreed species. In addition, their entire life was led in an environment that continuously pushed the organism to cope with intrinsic and extrinsic antigenic loads. Finally, no other biological category has experimented so many rapid changes as those which have occurred in the last century in all countries across the world, and chiefly in developed countries. Therefore, the model of centenarians is not simply an additional model with respect to common model organisms such as yeast, worm, Drosophila and mouse, but it provides unique insights on the complex network of biological and non biological factors which guide individual survival at old age (De Benedictis and Franceschi, 2006). The studies on centenarians have pointed out that human “longevity genes” could function in several important ways. They may slow the rate of age-related changes in cells and tissues,
improve the effectiveness of repair mechanisms, and increase resistance to environmental stresses like infection and injury. “Longevity genes” could also affect a wide spectrum of debilitating age-related conditions. These requirements are consistent with the observation that elderly children of centenarians have fewer incidence of diabetes and ischemic heart disease, and better self-rated health, than age-matched controls (Terry et al., 2003; Frederiksen et al., 2002). This suggests that the offspring of centenarians inherited a set of genes from their long-lived parent that protects them against these disorders.
In order to make appropriate inferences regarding the effect of observed genetic covariates on life span, one must bear in mind that life span is a complex trait such that no single gene or attribute can be considered to be an independent predictor of it. This is different from the situation where a single locus is responsible for a distinct dichotomous phenotype regardless of environment or genotypes at other loci (McClearn 1997). Because of complexity of the trait, efficient data analysis techniques are crucial in helping to interpret the results. In contrast with the rapid development in biological techniques involved, the statistical methods used in data analysis have remained mainly simple χ2-tests. Various statistical approaches, borrowed from the genetic epidemiology and particularly developed in survival analyses, have been applied. In the following, I summarize the different analytical methods currently applied to identify genes affecting longevity.
1.2.1 The case-control approach
Most of the studies on the genetics of human longevity are cross-sectional association studies in unrelated people. In these studies, polymorphic variants for candidate genes are compared between a group of individuals selected for longevity, such as centenarians, and groups of individuals of younger ages. In this frame, centenarians are considered as cases and younger people as controls. Different applications of this approach can be found in the literature. Examples include the intensive study on apolipoprotein gene variations and their relationship to longevity (Kervinen et al., 1994; Schachter et al., 1994; De Benedictis et al., 1997, 1998; Pepe et al., 1998; Jian-Gang et al., 1998, Christensen et al., 2006). In this context, the χ2-test is used to compare the frequency of a certain allele or genotype between cases and controls. An effect on aging/longevity by a certain genotype or allele can be detected when a significant difference is found. Although popular in use and powerful for revealing limited chromosomal regions encompassing the susceptibility locus, the case-control method has some disadvantages:
1. Life span is a continuous quantitative trait. Therefore, the case-control approach does not fully make use of the individual survival information available in the analysis, thus it presents a low efficiency for making inferences.
2. The case-control approach may be affected by confounding factors, such as heterogeneity in ethnicity, social environment, sex differential mortality. By stratifying the sample, it is possible to control some confounding factors, but this usually requires large sample sizes because the data have to be divided into smaller subsets and this consequently reduces the statistical power of the sample.
3. Similar to the above problem, the case-control approach is not an ideal method of dealing with interactions. Evidence of gene-environment and gene-sex interactions have been found in previous studies (De Benedictis et al., 1998, 1999; Ivanova et al., 1998). Interactions can be detected by making separate conclusions on different sexes or geographical regions when the sample is accordingly grouped. Again, inference has to be made on considerably smaller subsets of data.
4. As a continuous trait, life span is affected by factors that can be both biological and environmental. This results in individual differences in the aging process. The consideration of such differences is crucial for evaluating the influence of both genetic and environmental attributes in modulating life span. The case-control approach is not able to integrate unobserved heterogeneity.
5. In cross-sectional studies, participants are taken from different birth cohorts. They exhibit heterogeneous patterns of survival due to secular trends in mortality improvement (Vaupel et al., 1998). However, since the differences in individual survival probability are ignored using the case-control approach, the conclusions reached by such an approach could be biased.
1.2.2 The Logistic Regression Approach
As an extension of the case-control approach, the logistic regression model can be used to account for confounding factors or interactions. In the case-control approach, we look at the difference of gene frequencies in two age groups. A natural extension is to study the age trajectories of frequencies. Such a situation can be modeled by the logistic regression model (Tan et al., 2001). In the basic form of a logistic regression
x x p x p 1 0 ) ( 1 ) ( ln =β +β −
the odd of the frequency p(x) of the allele or genotype of interest is modelled as a linear function of age x. When β1 is significantly different from zero, the frequency of the allele
or genotype increases (β1 > 0 ) or decreases (β1 < 0) when age increases. The odds ratio
for frequency change between two adjacent ages can be measured as . In the logistic regression approach it is not necessary to group the individuals into cases and controls, thus obtaining more power in the analysis. Moreover, assuming Hardy-Weinberg equilibrium, the logistic regression model with polytomous responses can be introduced to handle highly polymorphic genes (Tan et al., 2003). Genotype and allele-based parameterization can be used to investigate the modes of gene action and to reduce the number of parameters so that the power is increased while the number of multiple testing is minimized. Another very important feature of logistic regression is the possibility of modelling non-monotonous patterns of gene frequencies, which may arise from antagonistic pleiotropic effects in gene action during the aging process. (Leroi et al., 2005). This is achieved by modelling the allele or genotype frequency as a non-linear function of age x (Tan et al., 2003), for example by fractional polynomials (Royston et al., 1994). The partial likelihood ratio test can be applied to choose the best fitting model and to make inferences on the statistical significance of the age-dependent pattern as compared with a linear model.
1 β
e
1.2.3 Multi-locus approach
Several studies searched for associations between longevity and susceptibility genes by comparing gene pools of centenarians and younger subjects. However, studies that consider marker genotypes at one locus in connection with survival may capture only a small proportion of the total combined effects of the susceptibility genes which affect the phenotype. Since the development of complex traits involves multiple genes and their interactions, multi-locus association analysis is appealing (Hoh and Ott, 2003). The term multi-locus analysis includes two different procedures. The first is designed to find multiple risk loci, not necessarily on the same chromosome; the second is designed to analyse haplotypes using a set of ordered markers. In the former approach, if multiple risk loci are observed, a joint analysis should exhibit more power because it can capture the interactions among the loci, which are lost in single locus analysis. Statistical tools have been proposed for multi-locus analysis to uncover epistasis in human disease studies
(Cordell, 2002; Bohringer et al., 2003). However, more work is needed in developing and implementing multi-locus models for aging and longevity studies (Tan et al., 2006).
The study of haplotypes and linkage disequilibrium (LD) have proven fruitful in human population genetics. Because particular DNA variants may remain together on ancestral haplotypes for many generations, groups of neighbouring gene variants can form haplotypic diversity with distinctive patterns of LD that can be exploited in both genetic linkage and association studies (Schork et al., 2000). Haplotype analysis is more efficient than the single-locus association test because it makes use of LD information contained in the flanking markers (Akey et al., 2001). Haplotype approaches have been applied to detect allelic associations when parental genotypes are available for phase inference and for constructing the controls (Terwilliger and Ott, 1992; Clayton, 1999). Unfortunately, such methods are not applicable in longevity studies because parental genotype information is unavailable for old subjects. In order to reconstruct the missing phases in the multi-locus genotype data, different algorithms have been proposed among which the well-known EM algorithm (Excoffier and Slatkin, 1995). Recently, methods for haplotype-based multi-locus analysis of human survival have been proposed for cross-sectional (Tan et al., 2005) and for cohort (Tan et al., 2006) studies of unrelated individuals. In these models, a retrospective likelihood function is constructed upon the multinomial distribution of the explicitly observed multi-locus genotypes using haplotype-based parameterization. Moreover, these models are capable of capturing gene-sex and gene-environment interactions (Tan et al., 2005).
1.2.4 Demographic approach
In comparison with the case-control approach, the genetic-demographic (GD) approach uses information on survival functions and mortality rates for groups of individuals carrying the candidate gene or genotype (Yashin et al., 1999). Although more complex, GD remains really promising for its potential in the genetic research on aging and longevity. The complexity of the method is represented by the necessity of introducing:
• a survival model;
• a model that links gene frequencies and survival;
• a procedure for estimating model parameters starting from data;
The GD approach is based on two important assumptions. The first is that the initial gene frequencies in all birth cohorts represented in the cross-sectional sample under study are the same. This is true if there are no particular phenomena, such as bottleneck or genetic
drift, that rapidly change the genetic composition of the population. The second assumption is that the genotypic specific mortality does not depend on the birth year of the cohort. This assumption is not fulfilled because of the changes in socio-economic and sanitary conditions in the last century. To overcome this problem the use of a “synthetic” survival function has been proposed (Yashin et al., 1999; Dato et al., 2006).
The key point of the demographic approach consists in the possibility of using the representation of marginal survival function, S(x) - which can be taken from the cohort demographic life tables - as a discrete mixture of the respective survival functions for genotypes (or alleles). The GD approach requires that the whole sample population is divided into carriers and non-carriers of a given allele or genotype.
Let SA(x), SB(x) be the survival functions of carriers and non-carriers, respectively,
evaluated at age x. The relation between the marginal survival functions for allele carriers/non-carriers and the survival function of the population is
) ( ) 1 ( ) ( ) (x PS x P S x S = A + − B
where P is the initial frequency of carriers in the population.
The relative frequency of carriers at age x, here denoted as πA(x), is given by:
) ( ) 1 ( ) ( ) ( ) ( ) ( ) ( x S P x PS x PS x S x PS x B A A A A = = + − π .
The frequency πB(x) of non-carriers at age x is given by:
) ( ) 1 ( ) ( ) ( ) 1 ( ) ( ) ( ) 1 ( ) ( 1 ) ( x S P x PS x S P x S x S P x x B A B B A B + − − = − = − = π π .
The above formulas enable us to compute the age distribution of relative frequencies given the respective survival function and initial frequencies. The survival functions can be written in terms of the relative frequencies of carriers and non-carriers:
; ) ( ) ( ) ( P x S x x S A A π = . 1 ) ( ) ( ) ( P x S x x S B B = − π
Several approaches for the analysis of combined demographic and genetic data have been proposed (Yashin et al., 1999): the “non parametric method” (NP), the “relative risk method” (RR), the “parametric method” (PR), and the “semi-parametric method” (SP). All these methods are based on the formulas previously reported and share some similarities as, for example, the use of maximum-likelihood criterion for the estimation of the parameters and the existence of constraints such as the age-related decrease of the survival functions. The conceptual difference is that RR, PR and SP methods require that a model of mortality (a trend of the hazard function) is defined a-priori, while NP does not.
1.3 Aim of the study
Aim of the work carried out during my PhD appointment was to explore new routes in genetic studies on human aging and longevity, and in particular:
• to analyze longevity in Calabria in order to verify if the geographic distribution of long-lived subjects is random or not.
• to investigate the multidimensional nature of the quality of aging by trying to obtain an operative phenotypic classification able to measure the degree of vulnerability in elderly people.
• to combine demographic information and multi-locus analysis for estimating the influence by the genetic variability of ten candidate genes on survival at advanced ages.
In the following chapters the results of the above mentioned investigations are reported. In particular, the first part reports the results of a study focused on the spatial analysis of the distribution of the male longevity phenotype in Calabria (Italy).
The second part reports the integral version of a manuscript entitled “A cluster analysis to define human aging phenotypes”, which is in press in Biogerontology.
Finally, the third part reports the integral version of a manuscript entitled “Sex-and-age specificity of susceptibility genes modulating survival at old age”, which is in press in Human Heredity.
2. SPATIAL ANALYSIS OF THE DISTRIBUTION OF THE MALE LONGEVITY PHENOTYPE IN CALABRIA
(Montesanto et al, Ms. in preparation)
2.1 Background
Individual variability of human lifespan is influenced by an interplay of environmental, genetic and stochastic factors. The disentangling of such factors is complicated by cultural and genetic heterogeneity of human populations. Human societies undergo continuous changes with the improvement of the environment (for instance cleaner water and better food) and medical assistance. This leads to the increase of average and of maximum life span that are now far beyond where they were a few decades ago. Although the improvement of environmental conditions is occurring all over western societies, it has a different pace in different areas, and this reflects on the conditions of aging and of longevity (Jeune et al., 2006). In addition, it has been shown that genetic factors are able to predispose to longevity in certain populations but not in others, either because some variants are population specific or because the interaction of that variant with the environment is specific for the geographic area. On the whole it is emerging that most of the factors influencing longevity are heterogeneous and population specific. This calls for a close monitoring in different populations of the trajectories of lifespan and of their correlation with different factors that are likely to affect longevity in that population.
Recently, it has been reported an intriguing population-specific feature of longevity: the female/male (F/M) ratio among centenarians ranges from 2/1 in Sardinia and southern Italy to 5/1 in northern Italy and most of western European countries (Poulain et al., 2004; Passarino et al., 2002). Subsequently, Robine and co-workers (2006) analysed the F/M ratio among centenarians in four different Italian regions. They showed that the significant differences observed in F/M ratio among centenarians are mainly due to differences of male mortality over the age of 60 years. In particular, they observed that mortality of men over the age of 60 years is lower in Calabria (the most southern region of the Italian peninsula) than in other regions under study and in the whole of Italy. The identification of possible patterns of aggregation of areas characterized by high proportion of long-lived individuals may help to understand the effect of environmental factors on this trait, as well as the role played by the population genetic structure.
The recent observation that in Sardinia centenarians are clustered in restricted areas characterized by a high level of geographic isolation and endogamy (Poulain et al., 2004),
and recent findings indicating an increased homozigosity at loci involved in human longevity (Bonafé et al., 2001; Cardelli et al., 2006) prompted us to explore the effects of population inbreeding on human longevity. Therefore, we decided to study male longevity in Calabria with two objectives:
(i) to verify if the geographic distribution of long-lived subjects is random or not; (ii) to explore the possible effects of inbreeding on the distribution of long-lived
individuals.
The interest was on males because of their particular mortality pattern.
As a longevity index we used the Nonagenarian Rate (NR). It is a modified version of the index called Centenarian Rate (CR) proposed by Robine et al. (2006) which is an attractive tool to compare populations over time and across communities, controlling for the size of birth cohorts, infant mortality, past migrations, and policies of naturalisation (Robine and Paccaud, 2005).
To explore the possible effects of inbreeding on the distribution of long-lived individuals we used surname data. They represent a very important tool for population genetics. In fact, due to systems of surname attribution through the paternal line, the surname can be regarded as a single gene with many alleles transmitted only through the Y chromosome. Different studies have used surname analysis to estimate genetic parameters (e.g. drift, kinship and migrations) relevant in the study of the effects of the population structure on human evolution (Gottileb, 1983; Lasker, 1985; Brunet et al., 2001; Cavalli-Sforza et al., 2004). Recently, Cavalli-Sforza and co-workers (2004) have shown a significant correlation between the estimates of inbreeding obtained from consanguinity and those obtained from surname data.
2.2 Materials and Methods
2.2.1 Data
We used regional census data from 1971 and 2001 (Istituto Centrale di Statistica, 1974, 2002). In particular, we used the regional census data of 1971 to obtain the number of individuals resident in Calabria who in that year were 60-69 years old; we used the regional census data of 2001 to obtain the number of individuals resident in Calabria who in that year were 90-99 years old.
2.2.2 Nonagenarian Rate
The number of oldest-old people that we expect to observe today depends on the number of births in the corresponding cohorts: for example, the number of centenarians who we expect to observe today in a given region depends on the number of births a hundred years earlier in that region. However, a direct comparison of the observed number of oldest-old people with the number of births in the corresponding cohorts does not take into account important phenomena such as infant mortality, past migration etc, which are not related to aging. Recently, Robine et al. (2006), analyzing the evolution of the number of centenarians in Italy, proposed the Centenarian Rate (CR). Following this suggestion we have characterized longevity in different municipalities of Calabria according to the Nonagenarian Rate (NR) defined as the ratio between the number of survivors at age 90-99 years and the number of survivors at the age of 60-69 years, whitin the same cohort:
) ( ) ( ) ( 69 60 99 90 i X i X i NR − − = where
is the number of residents in the i-th municipality, 90-99 years old, registered by the 2001 national census;
) ( 99 90 i X −
is the number of residents in the i-th municipality, 60-69 years old, registered by the 1971 national census.
) ( 69 60 i X −
Obviously the Nonagenarian Rate can be defined for any area consisting of several municipalities:
∑
∑
∈ − ∈ − = A i 60 99 A i 90 99 A X X NRwhere the summation is over the municipalities enclosed in the area A. Note that NRA is
2.2.3 Spatial Analysis
To test the hypothesis that the geographical distribution of oldest-old subjects in Calabria is non-random and that peculiar geographic areas could be identified where NR is consistently and significantly higher than in the whole of Calabria, we used Spatial Analysis (SA). SA is the process of extracting or creating new information about a set of geographic features. Methods of SA can be simple or very sophisticated, but usually they are applied by using a computer-based tool, the Geographic Information System (GIS).
2.2.4 Statistical analysis
If we hypothesize a uniform regional distribution of nonagenarians with respect to the size of the same cohort 30 years earlier in the different municipalities of the region, the expected number of nonagenarians in the i-th municipality is:
∑
∑
= − = − − − = × N i N i i X i X i X i X 1 60 69 1 99 90 69 60 99 90 ) ( ) ( ) ( ) ( 'where N is the number of Calabrian municipalities and
∑
∑
= − = − = N i N i g X X NR 1 69 60 1 90 99 Re is the regionalvalue of the Nonagenarian Rate (NR).
Significant departures from a uniform distribution of the NR can be identified by using the chi-square goodness-of-fit test between observed and expected number of nonagenarians. For this test the statistic is
[
]
∑
= − − − − = N i Ex Ex Obs i X i X i X X 1 90 99 2 99 90 99 90 2 ) ( ) ( ) ( .Since several municipalities show a number of nonagenarians which are less than five, the assumption that the test statistic has a χ2 distribution may be severely violated. Therefore we constructed the “empirical distribution” of X2 by numerical simulation, on the null hypothesis that NR is uniform across Calabrian municipalities: NR(i)=NRReg.
Ten thousand patterns of NR(i) were generated, each characterized by a distribution of nonagenarians given as ( )(), i = 1,…, N. is a pseudorandom integer from
99 90 i Xsimk − () ) ( 99 90 i Xsimk −
the binomial distribution with parameters (p,n) given by p=NRReg,n= X60−69(i). The rationale is that random departures from a uniform pattern of nonagenarians can come as number of “successes” in samples of different initial sizes ( ), but with the same “probability of success” ( ). For each simulated pattern the statistic X
) ( 69 60 i X − g NRRe 2 was computed as
[
]
∑
= − − − − = N i Ex Ex k sim S i X i X i X k X 1 90 99 2 99 90 ) ( 99 90 2 ) ( ) ( ) ( ) ( , k=1,…,10000.The histogram of the values , k = 1,…, 10000 gives us an “empirical” probability distribution of the test statistic, on the null hypothesis of regional uniformity. Denoting by z the number of values in
) ( 2 k XS
{
2( ), =1,...,10000}
k kXS which exceed the observed value ,
the empirical significance level of the test is
2 Obs X 10000 z p= .
With such test we are able to verify if the distribution of nonagenarians across the municipalities of Calabria is random or not.
If the hypothesis of uniformity is rejected, we verify if the observed distribution of nonagenarians in Calabria exhibits a clustering pattern. To this purpose, we repeated the above mentioned tests considering as reference unit the area consisting of one municipality with its neighbours. On the basis of these new reference units, we redefined NR values and tested if the pattern of X90-99 in these new units departs from that corresponding to a
uniform regional distribution of survival. Finally, the units (a given municipality with its neighbours) with a significant positive departure from the uniform distribution, identified on the basis of the relevant NR values, were heuristically overlapped to obtain wider areas with high NR values.
2.2.5 Surnames
In order to analyze the distribution of surnames we used the directory of Calabrian users registred by Italian telephone companies, edited by SEAT (CD-ROM 2005). Only persons listed as private telephone users who have given informed consent to use their personal data for direct marketing were used, for a total of 250000 subjects. Fisher’s alpha, a
measure of species diversity in a sample (Fisher, 1943), was used as a measure of surname abundance to estimate inbreeding. Singletons surnames were excluded for reasons discussed by Zei et al., (1986), Du et al., (1992), Cavalli-Sforza (2001).
2.3 Results
2.3.1 Identification of Blue Zones
In this study we define as Blue Zone (BZ) an area characterized by a NR value significantly higher than the regional value.
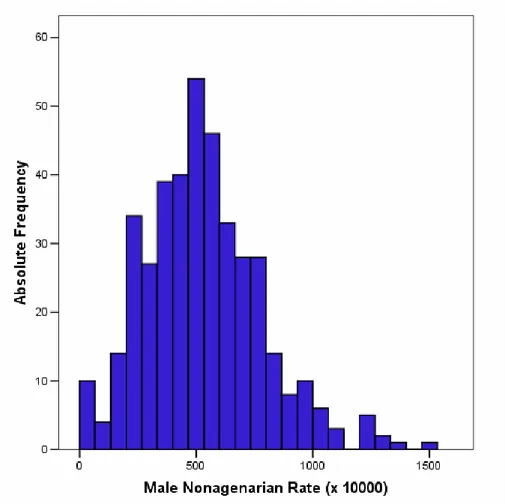
For all municipalities of Calabria we computed the NR values of the male population (mNR). Figure 1 reports the distribution of the mNR computed index across the Calabrian municipalities.
Figure 1. Frequency distribution of Nonagenarian Rates in Calabrian municipalities computed on the basis of the male population (mNR).
Thus, we defined four quartiles of the mNR distribution. The four quartiles were used to define four groups of municipalities: we define as first group (Q1) the municipalities
belonging to the quartile with the lowest values of mNR; as second group (Q2) those belonging to the second quartile; as third group (Q3) those belonging to the third quartile; as fourth group (Q4) those belonging to the fourth (Table 1).
Table 1. Municipality classification on the basis of the male Nonagenarian Rate (mNR).
mNR (x104)
Group 1 (Q1) <357 Group 2 (Q2) 357-505 Group 3 (Q3) 505-671 Group 4 (Q4) >671
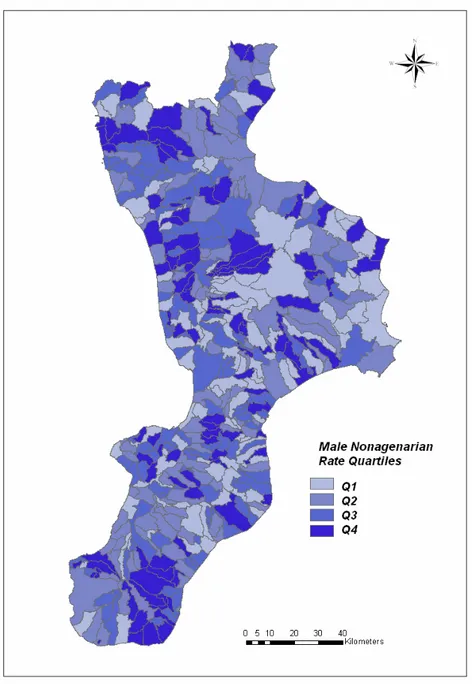
The following map represents the distribution of the mNR values across the Calabrian municipalities (Fig. 2):
Figure 2. Map of the Calabrian municipalities identified with different colours according to belonging to the different mNR groups (Q1, Q2, Q3 and Q4).
In order to verify the existence of areas characterized by very high NR values (see Materials and Methods), we evaluated the mNR for the areas consisting of municipalities and their neighbours. On the basis of these results we heuristically increased the level of aggregation, thus identifying two clusters of municipalities (including about 10% of the population of the respective provinces) characterized by a significant positive deviation of mNR values with respect to the average regional value. The first cluster is located in the province of Reggio Calabria; the second cluster is located in the province of Cosenza (Fig. 3).
Figure 3. Map of Blue Zones, that is of the areas characterized by a significant positive deviation of mNR values with respect to average regional value.
Following Poulain et al. (2004), we defined the areas in which these municipalities are located as Blue Zone 1 (BZ1) the cluster in the province of Reggio Calabria and Blue Zone 2 (BZ2) the cluster in the province of Cosenza. Table 2 reports the municipalities included in BZ1 and BZ2.
Table 2. List of municipalities included in the Blue Zones. Municipality of BZ1
(Reggio Calabria province)
Municipality of BZ2 (Cosenza province)
Africo Casole bruzio
Benestare Castiglione Cosentino
Bianco Castrolibero
Bova Celico
Bova marina Lappano
Bovalino Lattarico Brancaleone Luzzi Bruzzano Zeffirio Marano Marchesato
Caraffa del Bianco Marano Principato
Careri Montalto Uffugo
Casignana Rende Ferruzzano Rose Palizzi Rovito
Platì San Benedetto Ullano
Roghudi San Fili
Samo San Pietro in Guarano
San Luca San Vincenzo la Costa
Sant’Agata del Bianco Serra Pedace Santa Cristina d’Aspromonte Spezzano della Sila
Staiti Spezzano Piccolo
Trenta Zumpano
The characteristic features of BZ1 and BZ2 are presented in Table 3, in comparison to the relevant Calabrian provinces and Italy.
Table 3. Characteristics of BZ1 and BZ2.
BZ1 RC
province BZ2
CS
province Calabria Italy
Number of municipalities 20 97 22 155 409 1092
Men 60-69 years old at 1971 census 2558 26723 2814 25908 77155 2420136 Men 90-99 years old at 2001 census 187 1295 195 1339 3798 101714
Total Male NR (x104) 731 485 693 517 492 420
As expected, the mNR values in the BZ are higher than those in the respective provinces, in the entire region (Calabria) and nation (Italy). The significance of the departure of the mNR value in the BZ from provincial and regional values was ascertained by χ2 test (P<0.0001 in all cases).
Interestingly, the F/M ratio in nonagenarians is extremely low in the BZ1, while it is not different from the regional value in the BZ2.
2.3.2 Surname Analysis
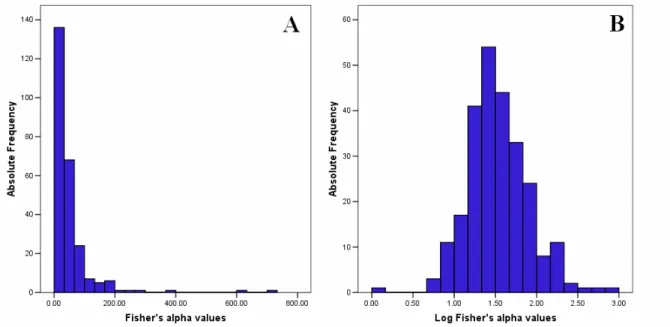
To verify a possible contribution of high inbreeding rate to the geographic pattern of male longevity shown in Figure 2, we carried out the surname analysis in Reggio Calabria and Cosenza provinces. The distribution of surname abundance, as measured by the Fisher’s alpha values, is shown in Figure 4. The values of Fisher’s alpha have been transformed into logarithms because the log-transformed values are approximately normally distributed.
Figure 4. Distribution of Fisher’s alpha in Reggio Calabria and Cosenza provinces (A natural scale, B logarithmic scale).
In Figures 5a-d the maps of surname abundances in the two Calabrian provinces are compared to the correspondent BZ maps.
Figure 5. Comparison between the distribution of Fisher’s alpha (A and C maps) and the Blue Zones (B and D maps) in Cosenza and Reggio Calabria provinces (Southern Italy). Fisher’s alpha is a measure of surname abundance.
Figure 5 shows a significant overlapping between the BZ in the Reggio Calabria province and an area characterized by low surname abundance (high inbreeding level), whereas in
the Cosenza province the overlapping is not observed. In order to quantify the different relationships between surname abundance and mNR by which BZ were identified, we computed the corresponding correlation coefficients. As expected, we found a significant negative correlation between mNR and surname abundance values in Reggio Calabria province 0.254; P<0.05), while in Cosenza province the correlation was not found (r=-0.051; P=0.526).
2.4 Discussion
Male mortality after the age of 60 has been found to be lower in Calabria than in the other Italian regions (Robine et al., 2006). This has led to a an extremely low F/M ratio among oldest olds when compared to other Italian and European areas. In order to better understand this phenomenon, we aimed to verify whether the geographic distribution of long-lived subjects is uniform throughout the Calabrian territory or it is concentred in specific areas. We found that the distribution of oldest old people across the region is not uniform. In addition, we observed a correlation between population inbreeding and male longevity.
By using a SA approach it was possible to identify two areas of male longevity: the BZ1 (located in the province of Reggio Calabria, around Platì territory) and the BZ2 (located in the province of Cosenza, along the middle course of river Crati and near the city of Cosenza). It is interesting to notice that BZ1 is characterized by a very low F/M ratio among nonagenarians, while in the BZ2 this ratio is not different from the regional value (Table 3), due to the female NR which is the highest in the region (data not shown). These data suggest that male longevity characterising the two Calabrian BZ may be related to different causes. In particular, male longevity in BZ1 might be related to some phenomena causing exclusively male longevity, while male longevity in BZ2 appears to be related to a more general phenomenon affecting also female longevity.
From an economic, cultural and geographic point of view BZ1 and BZ2 areas are extremely different. The BZ1 is located in a mountainous area which abruptly slopes down to the Ionian sea, with deep valleys (fiumare); its economy is essentially rural; communication with other parts of Calabria were very difficult up to a few years ago. By contrast, BZ2 is included in an economically, socially and culturally developed area, a node of communication between Ionian and Tirrenian coasts, and north and south of Calabria.
The recent observation that in Sardinia centenarians are clustered in restricted areas characterized by high level of geographic isolation and endogamy, suggested we explore the effects of population inbreeding on male longevity in Calabria. Surname analysis revealed that there was no correlation between surname abundance and mNR values in the province of Cosenza. On the other hand, the surname abundance analysis revealed a significant negative correlation between surname abundance and mNR values in the province of Reggio Calabria: high mNR values are associated with low surname abundance, and hence high inbreeding level.
On the whole these data suggest that the low male mortality in the BZ2 might be related to the improved economic and social conditions. As to BZ1, male longevity might be related to specific features of that area. In the present study, we show that population inbreeding may be one these features. These results, which are in line with those reported by Poulain et al (2004), might be interpreted by assuming that the high inbreeding level marked by the low surname abundance increases homozigosity at loci involved in male longevity (Bonafé et al., 2001; Cardelli et al., 2006).
3. A CLUSTER ANALYSIS TO DEFINE HUMAN AGING PHENOTYPES Passarino G, Montesanto A et al., (2006) Biogerontology in press.
3.1 Introduction
A prerequisite for disentangling genetic, epigenetic and environmental factors which modulate rate and quality of human aging is the definition of the phenotype. Chronological age is not sufficient, because the variability of the aging trait is manifest within and between populations. Hence several studies searched for indicators of health and functional status in old and very old subjects by which objective phenotypes could be defined (Fried et al., 2001 and 2004; Bortz, 2002; Mitniski et al., 2002; Jones et al., 2004 and 2005). From these studies the concept of frailty emerged as a distinct clinical entity characterized by a state of vulnerability for adverse health outcomes, such as hospitalization or death, and therefore correlated to co-morbidity, disability and increased mortality hazard (Walston et al., 2006). Therefore the identification of a precise frailty phenotype could help to recognize homogeneous population groups enriched of genetic risk factors predisposing to a poor quality of aging. Cognitive, psychological and functional measures turned out to be the most effective to identify the frailty phenotype, since these parameters condense most of the frailty cycle that occurs in the elderly (Fried et al., 2004).
We wanted to verify if a Cluster Analysis (CA), that used well established geriatric parameters, was able to recognize the frailty phenotype. The term CA encompasses a number of different algorithms and methods for grouping cognate objects in a way that the degree of association between two objects is maximal if they belong to the same group and minimal otherwise. By using Mini Mental State Examination (MMSE), Hand Grip strength and Geriatric Depression Scale (GDS) as variable parameters, we analyzed by CA two samples of old subjects recruited in Calabria (southern Italy). This region, as other European regions, is experiencing a great increase in the number of old subjects, probably also due to a reduced mortality at advanced ages consequent to improvement in medical care. For example, people older than 65 and 90 years of age represented 13% and 0.15% of the population, respectively, in 1991 (Italian Census data); at January 2004, these proportions were increased up to 18% and 0.6% respectively. However, despite the increased survival, the quality of aging in Calabria is still poor when compared with other European regions (Jeune et al., 2006).
We collected phenotypic and genetic data in two samples of old Calabrian subjects by using questionnaires, geriatric tests and laboratory analyses. Then we applied CA and
verified, from phenotypic and genetic perspectives, the reliability of the frailty phenotypes we obtained.
3.2 Materials and Methods
3.2.1 Samples
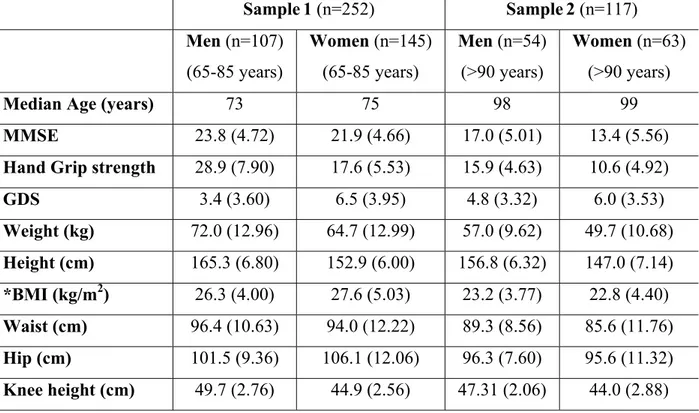
Two samples were analyzed. The first (S1) included 65-85 years old subjects (252 subjects,
107 males and 145 females; median ages 73 and 75 years respectively); the second (S2)
included 117 subjects older than 90 years of age (54 males and 63 females; median ages 98 and 99 years respectively). Out of the 252 subjects in S1, 80 had at least one living
centenarian parent included in S2. All the subjects were born in Calabria (southern Italy)
and their ancestry in the region had been ascertained up to the grandparents generation. The samples had been recruited in the frame of the European research program European Challenge for Healthy Aging (ECHA project: http://biologia.unical.it/echa/) and of an independent study we carried out in unrelated people. In both the studies, we collected phenotypic information by using the ECHA questionnaires (http://biologia.unical.it/echa/results.htm). Vital status at 18 months after the visit was traced for 249 subjects in S1 and for all the 117
subjects in S2 through the population registers of the municipalities in which the
respondents were domiciled. All the subjects had given informed consent for studies on aging carried out by our research group.
3.2.2 Anthropometric and geriatric measures
The physical examination included the record of height, weight, knee-to-floor height and waist and hip circumferences.
Cognitive function was assessed by Mini Mental State Examination (MMSE) test (Folstein et al., 1975). Since the test is affected by age and educational status, the scores were normalized for these variables.
Hand Grip strength was measured by using a handheld dynamometer (SMEDLEY's dynamometer TTM) while the subject was sitting with the arm close to his/her body. The test was repeated three times with the stronger hand. The maximum of these values was used in the CA analysis, after normalization for age, sex and height.
Depression was assessed by the short form (15 items) of the Geriatric Depression Scale (GDS) (Sheikh et al., 1986).
Functional activity was assessed by using a modification of the Katz’Index of ADL (Katz et al., 1963). The assessment was based on what the subject was able to do at the time of the visit.