Full Terms & Conditions of access and use can be found at
https://www.tandfonline.com/action/journalInformation?journalCode=tjom20
ISSN: (Print) (Online) Journal homepage: https://www.tandfonline.com/loi/tjom20
Analysis of the paraglacial landscape in
the Ny-Ålesund area and Blomstrandøya
(Kongsfjorden, Svalbard, Norway)
Ivar Berthling , Claudio Berti , Vania Mancinelli , Laura Stendardi , Tommaso
Piacentini & Enrico Miccadei
To cite this article: Ivar Berthling , Claudio Berti , Vania Mancinelli , Laura Stendardi , Tommaso Piacentini & Enrico Miccadei (2020) Analysis of the paraglacial landscape in the Ny-Ålesund area and Blomstrandøya (Kongsfjorden, Svalbard, Norway), Journal of Maps, 16:2, 818-833, DOI: 10.1080/17445647.2020.1837684
To link to this article: https://doi.org/10.1080/17445647.2020.1837684
© 2020 The Author(s). Published by Informa UK Limited, trading as Taylor & Francis Group on behalf of Journal of Maps
View supplementary material
Published online: 02 Nov 2020. Submit your article to this journal
Article views: 134 View related articles
Analysis of the paraglacial landscape in the Ny-Ålesund area and
Blomstrandøya (Kongsfjorden, Svalbard, Norway)
Ivar Berthling a*, Claudio Berti b, Vania Mancinelli c, Laura Stendardi d, Tommaso Piacentini cand
Enrico Miccadei c
a
Department of Geography, NTNU-Norwegian University of Science and Technology, Trondheim, Norway;bIdaho Geological Survey, University of Idaho, Moscow, ID, USA;cDepartment of Engineering and Geology, Laboratory of Tectonic Geomorphology and GIS, Università degli Studi“G. D’Annunzio” Chieti-Pescara, Chieti Scalo (CH), Italy;dInstitute for Earth Observation, Eurac Research, Bolzano, Italy
ABSTRACT
Ice cover changes have affected the Svalbard Islands during the Quaternary and conditioned a complex paraglacial landscape. In these remote and poorly vegetated arctic areas, the integration offield investigations and analysis of aerial images and DTMs or terrestrial laser scanning, is effective in the understanding landscape features and changes. In this work, we present the results of a geomorphological investigation and mapping in two sites along the Kongsfjorden in NW Svalbard (Ny-Ålesund and Blomstrandøya). A specific analysis focused on the slope landforms along the rock slopes. The study is based onfieldwork that defined deposits and landforms distribution of areas with different bedrock and geomorphological context. The analysis of the rock slopes focused on weathering and erosion processes, estimating erosion rates of 0.15–0.37 mm/yr over the Holocene, consistent with other areas around the Kongsfjorden and close to the highest values found in arctic areas.
ARTICLE HISTORY Received 12 May 2020 Revised 12 October 2020 Accepted 13 October 2020 KEYWORDS Geomorphological map; surficial deposits; rock slopes; erosion rates; Kongsfjorden area; Spitsbergen
1. Introduction
High latitude environments are highly sensitive to
cli-matic fluctuations, capable of inducing rapid changes
both to ecosystems and distribution of geomorphologi-cal processes and landforms. Since the Last Glacial Maxi-mum (LGM), massive changes in arctic environments are related to stages of ice retreat and advancement. As glaciers retreat, new landscapes are affected by rapid modifications, high erosion rates and sedimentation pro-cesses and by a transition to paraglacial environments, which incorporate all non-glacial earth surface processes, sediments, and landforms directly conditioned by
glacia-tion and deglaciaglacia-tion (Ballantyne 2002; Church and
Ryder 1972; Oliva et al. 2019; Slaymaker 2009, 2011 Strzelecki et al. 2020and references therein).
The Svalbard Islands are located in the Arctic Sea at very high latitude (74–81°N) and presently have cover-age of around 60% by ice caps and valley/fjord glaciers (Hagen et al. 1993). Since the LGM and more recently after the LIA (Little Ice Age), the glaciers have retreated to a large degree from the fjords and lowland areas, and paraglacial conditions have rapidly expanded. This process is well investigated in the
Kongsfjorden area in NW Svalbard (e.g. Bourriquen
et al. 2018; Forman et al. 2004; Gjermundsen et al. 2013; Hormes, Gjermundsen, and Rasmussen 2013;
Lehmann and Forman 1992; Mercier and Laffly 2005). The variety of surface processes and landforms in this area has prompted studies on a wide range of geomorphological issues, including glacial features and deglaciation history, periglacial features, slopes,
fluvial geomorphology and coasts (e.g. André 1997,
2009; Berthling and Etzelmüller 2007;Bernard et al. 2018; Bourriquen et al. 2018; Etienne, Mercier, and Voldoire 2008; Etzelmüller, Ødegard, and Sollid 2003; Hallet and Prestrud 1986; Henriksen et al. 2014; Kääb, Ramuntcho Girod, and Berthling 2014;
Laffly and Mercier 2002;Mercier et al. 2009;Moreau et al. 2008). The permafrost features and active layer around 1–2 m and recent (last decade) measurements show a zero-amplitude depth of 5.5 m and a mean temperature of 2.8°C (rising over the last decade,
Humlum, Instanes, and Sollid 2003; Boike et al.,
2018). However, while geomorphological mapping
was carried out in several specific sites in Svalbard
(e.g. Evans et al. 2012; Pekala 2004; Rubensdotter
et al. 2015;Rubensdotter, Larsen, and Lyså 2016; Sess-ford and Hormes 2013; Tolgensbakk, Sørbel, and Høgvard 2001), a detailed geomorphological map of the Kongsfjorden area is lacking (only two maps
from 1960–1980 were published for the NW
Brøgger-alvøya area;Joly 1969;Tolgensbakk and Sollid 1987).
© 2020 The Author(s). Published by Informa UK Limited, trading as Taylor & Francis Group on behalf of Journal of Maps
This is an Open Access article distributed under the terms of the Creative Commons Attribution License (http://creativecommons.org/licenses/by/4.0/), which permits unrest-ricted use, distribution, and reproduction in any medium, provided the original work is properly cited.
CONTACT Enrico Miccadei [email protected] Department of Engineering and Geology, Laboratory of Tectonic Geomorphology and GIS, Università degli Studi“G. D’Annunzio” Chieti-Pescara, Via dei Vestini 31–66100, Chieti Scalo (CH), Italy
*Present address Research Council of Norway, Drammensveien 288, 0283 Oslo. https://doi.org/10.1080/17445647.2020.1837684
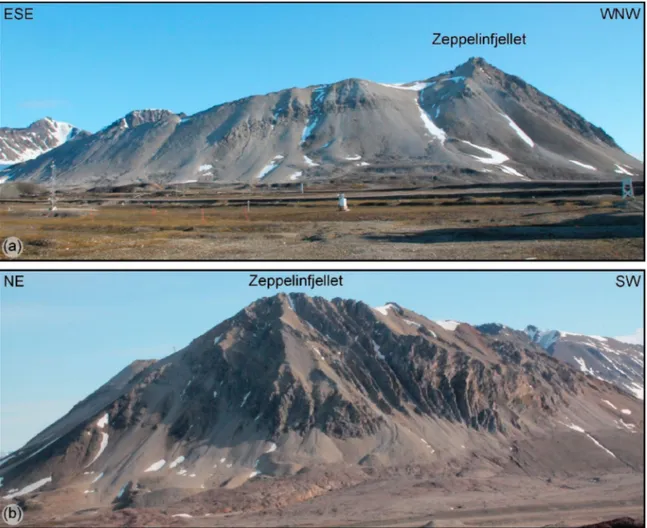
Therefore, the main aim of this work is the develop-ment of geomorphological maps describing the distri-bution of deposits and landforms in the paraglacial environment of the central area of Kongsfjorden, Sval-bard. A specific investigation focused on (1) slope pro-cesses and (2) fan landforms affecting the rock slopes of the areas of Ny-Ålesund (N slope of Zeppelinfjellet) and Blomstrandøya (N slope of Bratliekollen). The
areas were chosen as they include different
morpho-logical (rugged mountain areas and smoothed reliefs), geological (heterogeneous sedimentary sequences and sandy-calcareous metasediments) and glacial features (recently post LIA deglaciated areas and ancient post-LGM deglaciated areas). This study was based
on integrated field investigation, remote data and
observations, and geomorphological mapping. It is the result of a project on the geomorphological effects of glaciers’ retreat on sensitive high latitudes
and mountains geomorphological environments
(Hols Project, RIS 5842; Slopes project, RiS 10150,
http://www.researchinsvalbard.no/).
2. Study area
The Svalbard archipelago is located in the Arctic Ocean, about midway from Norway to the North Pole. Spitsbergen, the main island, features a rugged mountain landscape (highest peak, Newtontoppen, 1717m a.s.l.) and large icefields and glacially eroded fjord systems. The study areas are located in
Kongsf-jorden (NW Spitsbergen, between 78°58’ N, 11°23’ E
and 79°4’ N, 11°38’ E;Figure 1) and are respectively Ny-Ålesund, on the SW coast of Kongsfjorden, and Blomstrandøya, in the central part of the fjord near the NE coast.
In a geological perspective, the Kongsfjorden is located on the northern termination of the NNW-SSE Cenozoic fold and thrust belt of W Spitsbergen
and along a NW-SE strike-slip fault zone (Bergh,
Maher, and Braathen 2000; Cianfarra and Salvini 2015, 2016; Hjelle 1993; Leever et al. 2011). Three main bedrock domains characterise the area: (1) pre-Devonian metasediments and igneous rocks (northern side of Kongsfjorden and Blomstrandøya); (2) scat-tered Devonian sediments (red conglomerates and sandstones) tectonically interbedded into pre-Devo-nian metasediments (marble, Blomstrandøya island); and (3) Late Paleozoic to Early Triassic sedimentary sequences (i.e. carbonates, conglomerates and calcar-eous sandstones, Brøggerhalvøya), overlain by
Paleo-cene coal-rich sediments (Hjelle et al. 1999). The
bedrock sequences are covered by Quaternary conti-nental and coastal unconsolidated deposits (e.g. till
and diamicton, slope,fluvial and beach deposits).
Ny-Ålesund is situated on the Brøggeralvøya
peninsula on the SW shore of Kongsfjorden (Figure
1). It is placed on an undulating plateau (at 10–50 m
a.s.l.) bounded by steep rock slopes of high relief mountains (Zeppelinfjellet, 556 m a.s.l.; Berteltoppen, 785 m a.s.l.; Scheteligfjellet, 719 m a.s.l.) and by broad valleys of the main terrestrial glaciers (Austre-Vestre Brøggerbreen, Vestre Lovénbreen, Midtre Lové-nbreen). The geological setting consists of Middle Car-boniferous-Early Triassic sedimentary bedrock. The bedrock includes conglomerate, sandstone and shale with limestone, dolomite, and marl sequences (Gips-dalen Group), passing to shale, chert, limestone, and sandstone sequences (Templefjorden Group) and to sandstone and shale sequences (Sassendalen Group). These sequences are overlain by Paleocene sandstone, shales, conglomerates, coal-rich (Ny-Ålesund super-group,Hjelle et al. 1999). The bedrock sequences are involved in NE-verging low-angle thrust fault and dis-placed by N-S and NNE-SSW high angle faults, with closely spaced joints and fractures systems (Cianfarra and Salvini 2015,2016).
The Blomstrandøya island is in the middle of Kongsfjorden, in front of Ny-Ålesund and along the NW coast close to the Blomstrandbreen glacier, which until 1992 connected the island to the coast (Burton et al. 2016; Hagen et al. 1993; Svendsen et al. 2002;Sund and Eiken 2010;Figure 1). The island
is ∼5 km long and up to >4 km wide (∼16.4 km2),
with maximum elevations at Bratliekollen (370 m a.s.l.) and Irgensfjellet (385 m a.s.l.). The geological setting consists of medium to high-grade meta-morphic marble (Proterozoic age, Generalfjella For-mation; Hjelle et al. 1999), largely covered by a thin cover of weathered bedrock. Scattered remnants of unmetamorphosed redbeds (Devonian) are present. The tectonic and metamorphic structures feature a N-S general trend. Two syn-metamorphic phases of isoclinal folding are followed by post-metamorphic crenulation and kink-folds associated with
west-ver-ging thrusts (Hjelle et al. 1999;Thiedig and Manby
1992).
Kongsfjorden shows an overall U-shape, with longitudinal and transversal undulations, strandflats, and tributary glacial valleys. During the Late Pleisto-cene, the glaciers covered the entire Kongsfjorden (Hormes, Gjermundsen, and Rasmussen 2013; Leh-mann and Forman 1992; Svendsen et al. 2002 and references therein). After the LGM, climate ameliora-tion induced glacier retreat, which led to an ice-free
Kongsfjorden since 11–14 kyrs (Henriksen et al.
2014). The maximum middle Holocene to present
ice advancement occurred during the Little Ice Age
(1800s, early 1900s) (Burton et al. 2016; Lehmann
and Forman 1992;Svendsen et al. 2002and references therein). The surrounding landscape is characterised by contrasting alpine reliefs and strandflats. The mountainous areas feature large rock slopes, covered by talus slopes and cones. The glacial valleys
Figure 1.(a) Location map and geological scheme of Spitzbergen (Svalbard, Norway) (modified fromHjelle 1993). (b) Location map of the study areas (black boxes) in the Kongsfjorden (Svalbard, Norway); base data from Norwegian Polan Institute (https:// geodata.npolar.no/).
terminology seeSchomacker 2011). At the front of the terrestrial glaciers, streams breach through the mor-aines and outwash deposits develop large braided channel systems. The coastal areas are characterised by strandflats, sometimes bounded by a sharp tran-sition to backing mountains as well as low coastal
cliffs and linear or pocket beaches towards the sea.
Raised beaches, whose genesis is related to post-glacial
isostatic rebound, are preserved on the strandflats
above the coastal cliffs (e.g. Bourriquen et al. 2018;
Burton et al. 2016; Forman, Mann, and Miller 1987;
Hallet 2013; Hallet and Prestrud 1986; Kääb, Ramuntcho Girod, and Berthling 2014;Mercier et al. 2009; Miccadei, Piacentini, and Berti 2016; Streuff
2013).
3. Methods
Geomorphological mapping carried out in this work
integrated field and remote data resulting from (a)
geomorphological fieldwork, (b) interpretation of
orthophotos, Terrestrial Laser Scanner (TLS) data, Digital Surface Models (DSMs)and Digital Terrain Models (DTMs), and (c) DTMs processing and GIS mapping.
The geomorphologicalfieldwork was carried out in
the summers of 2014 (Blomstrandøya, Hols Project,
RIS 5842; Miccadei, Piacentini, and Berti 2016) and
2017 (Ny-Ålesund area, Slopes project, RIS 10150,
http://www.researchinsvalbard.no/) with the support of the CNR Polarnet and Dirigibile Italia Station and according to Svalbard, Ny-Ålesund, and reserve
areas regulations and requirements. Thefield
investi-gations were focused on the mapping of surficial deposits and landforms at 1:5000 scale and were then reduced to 1:15,000–001:16,500 for mapping pur-poses. More detailed investigations analysed the relationship between rock slopes (i.e. Zeppelinfjellet and Bratliekollen), related deposits (forming fan-shaped landforms and talus slopes), and strandflats.
Fieldwork was supported by the acquisition of remotely sensed data (orthophotos taken in 1998,
2008, 2015) and a 5m-DTM (Table 1). Terrestrial
laser scanning and UAV images (through SfM process) were used to realise DSMs and
high-resolution orthophoto (Table 1). The
interpret-ation of the orthophotos, and DTM-DSMs, by
comparison of field and remote observations and
3D perspective, allowed: (1) interpolation of the field data and definition of the actual extent and perimeter of the main deposits and landforms observed; (2) mapping of the extent of fan-shaped
landforms and talus slopes and specific sediment
source areas; and (3) the geometrical infer of the average thickness of the fan-shaped landform (Figure 2). This approach is particularly effective
in a cold bare environment, where the lack of veg-etation cover leaves the deposits and landforms exposed.
GIS processing and geomorphological mapping
was based on DTM-DSMs (Table 1) and has led to
(1) the outline of the overall orographic setting of the Ny-Ålesund and Blomstrandøya areas; (2) the
geo-morphological maps of the two areas integratingfield
and remote-sensed data; and (3) the morphometric investigation of the fan-shaped landforms on the rock slopes of Zeppelinfjellet and Bratliekollen. In total, 49 landforms were analysed in Zeppelinfjellet and 24 in Bratliekollen. For each one, the perimeter was mapped from in-field surveys and aerial-terres-trial image analysis. The surface extent was calculated through GIS processing, and the maximum thickness was estimated from geometrical infer (Figure 2)
com-bining field investigation and DTM-DSMs analysis.
The volume was estimated for each landform and the sediment volume considering porosity (~25%) and ice content of the rock glaciers (~50%). Finally, the perimeter and the surface area of the source area or catchment of each landform were mapped and calculated.
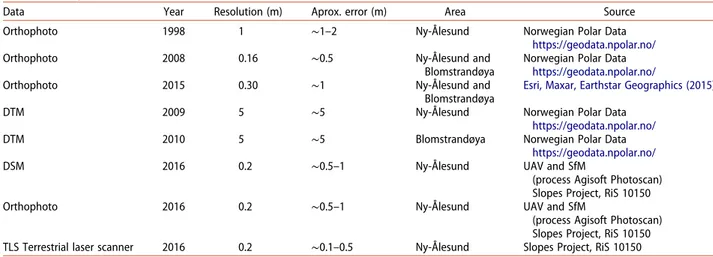
Table 1.Images and terrain-surface models used in this work and related sources.
Data Year Resolution (m) Aprox. error (m) Area Source Orthophoto 1998 1 ∼1–2 Ny-Ålesund Norwegian Polar Data
https://geodata.npolar.no/
Orthophoto 2008 0.16 ∼0.5 Ny-Ålesund and Blomstrandøya
Norwegian Polar Data
https://geodata.npolar.no/
Orthophoto 2015 0.30 ∼1 Ny-Ålesund and Blomstrandøya
Esri, Maxar, Earthstar Geographics (2015) DTM 2009 5 ∼5 Ny-Ålesund Norwegian Polar Data
https://geodata.npolar.no/
DTM 2010 5 ∼5 Blomstrandøya Norwegian Polar Data
https://geodata.npolar.no/
DSM 2016 0.2 ∼0.5–1 Ny-Ålesund UAV and SfM
(process Agisoft Photoscan) Slopes Project, RiS 10150 Orthophoto 2016 0.2 ∼0.5–1 Ny-Ålesund UAV and SfM
(process Agisoft Photoscan) Slopes Project, RiS 10150 TLS Terrestrial laser scanner 2016 0.2 ∼0.1–0.5 Ny-Ålesund Slopes Project, RiS 10150
4. Results
4.1. Geomorphological map of the Ny-Ålesund area
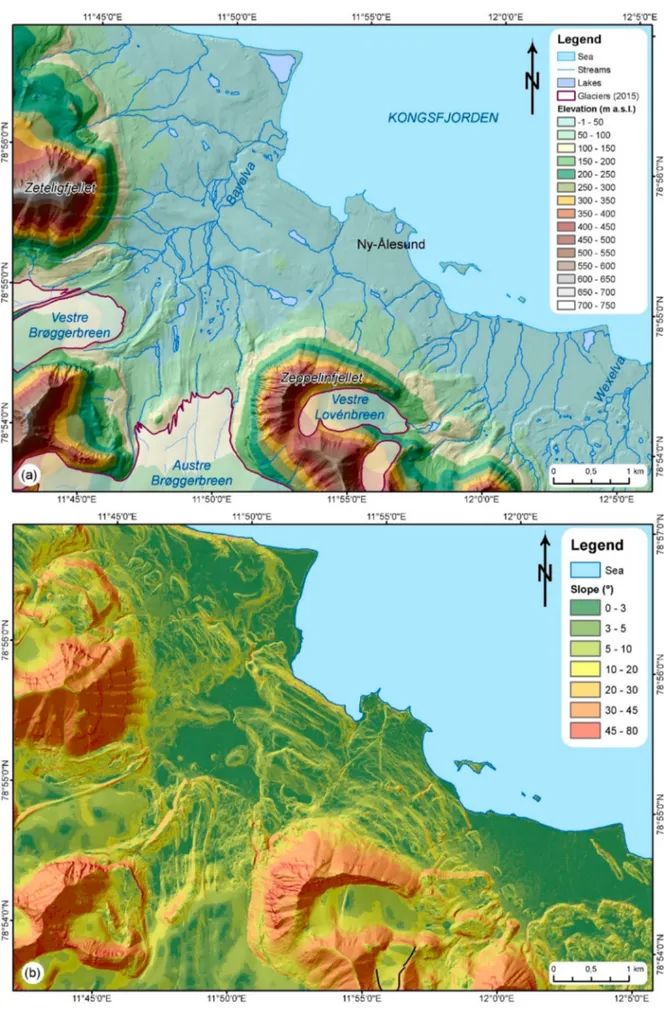
In the Ny- Ålesund area, the ridges orientations are from NW-SE (Lundryggen) to E-W (Zeppelinfjellet) to SW-NE (Berteltoppen) with rock slopes up to >45°, with subvertical rock cliffs (Figure 3). The valley bottoms and the strandflats have a low relief (<10°), with localised steep scarps (i.e. rock scarps, river valley scarps, moraine ridges). The present coast alternates rocky cliffs and gravel beaches (linear and pocket), including deltas and lagoons.
The Ny-Ålesund area is characterised by an exten-sive cover of surficial continental deposits (Figure 4) consisting of till and diamicton, slope (talus and rock-falls),fluvial, and beach deposits. Their thickness var-ies from a few metres (on the strandflats) to some tens of metres (at the base of the slopes and in the glacial valleys).
The recent (i.e. post-LIA) till and diamicton
depos-its (Figure 4a,b, see descriptions in the main map)
form the terminal and lateral moraines of the present glaciers and cover the glacial valleys. Till and diamic-ton deposits from the post-LGM deglaciation were
heavily reworked by periglacial andfluvial processes,
particularly in the strandflat area (Figure 4c), and this makes them difficult to discern (in the map the
main areas are defined). The flanks of the main ridges
feature large talus slope and cone deposits, and occasionally rockfalls. The front of the main glaciers is characterised by rivers and outwash plains (i.e.
Bayelva, Wexelva, Figure 4a,f,g) with alluvial
sedi-ments and large braided channels. The thickness of these deposits varies from <1 m in the small channels to up to >10 m in the main alluvial plains (derived from geomorphological interpretation). The coast is
rimmed by discontinuous gravel beach deposits (Figure 4h).
Glacial and slope landforms dominate the Ny-Åle-sund area on the SW mountainous area and in the main valleys. The NE sector (i.e. strandflat) is mostly dominated by periglacial,fluvial, and coastal features overprinting older glacial landforms. In the main val-leys (at the termination of the Austre and Vestre Brøggerbreen, Vestre and Midtre Lovénbreen gla-ciers), the extensive cover of till and diamicton depos-its are arranged in an extensive system of lateral,
medial, and terminal moraine ridges (Figure 4a,b).
Terrestrial glaciers have been retreating since the LIA (Burton et al. 2016;Svendsen et al. 2002and refer-ences therein) and different recessional moraines
(according toSchomacker 2011), hosting several
gla-cial lakes, are related to the rapid glacier retreat that has occurred over the last few decades. The mapping of glacier extent in 1998, 2008, and 2015 (from differ-ent sets of orthophotos) outlined an average retreat rate of∼30 m/yr from, for a total 500–550 m of frontal retreat from 1998 to 2015 in Austre and Vestre Brøggerbreen (calculated from the area of the degla-ciated area divided by the glacier front width and by the number of years of the calculation). In the stran-dflat, the glacial landforms are almost entirely covered byfluvial deposits and periglacial landforms (i.e. pat-terned grounds,Figure 4c).
Slope landforms dominate the rock slopes (i.e. rock falls and talus slopes and cones;Figure 4d,e). Fluvial landforms characterise the outwash plains of the main glaciers, where the main rivers have formed large sandy-gravelly braided channels (Figure 4g). In the coastal area, rivers incise the bedrock, forming steep scarps and bedrock channels perpendicular to the coast (Figure 4f). The coast is characterised by alternating gravel beaches (up to 100 m wide, on the Figure 2.Geometrical calculation of the fan-shaped landforms thickness. H max: max thickness;α: slope angle of the lower part of the slope;α’: slope angle of the upper rock slope.
Figure 3.Orographic and hydrographic features of the Ny-Ålesund area (location inFigure 1); base data data from Norwegian Polan Institute (https://geodata.npolar.no/).. (a) Elevation distribution and hydrography; (b) Slope distribution.
NW side of the area, where the Bayelva river forms a large delta;Figure 4h) and rocky cliffs (in the airport
and Ny-Ålesund area; Figure 4i). SE from
Ny-Åle-sund, a gravel beach is present (up to 100 m wide). Anthropogenic landforms and deposits are related to the intense coal mining that took place in the area from 1916 to 1963 and to the recent activities related to the international scientific stations in Ny-Ålesund.
4.2. Geomorphological map
The overall morphology of Blomstrandøya shows a
large flat summit area (at 270–330 m a.s.l.), in
which N-S are present. It is bounded by very steep (>45°) slopes along the NW and N sides and by gentle slopes (20–40°) in the S and SE flanks (Figure
5). The steep slopes are rimmed by strandflats at 10–
90 m a.s.l. from 1.3 km (southern coast) to less than
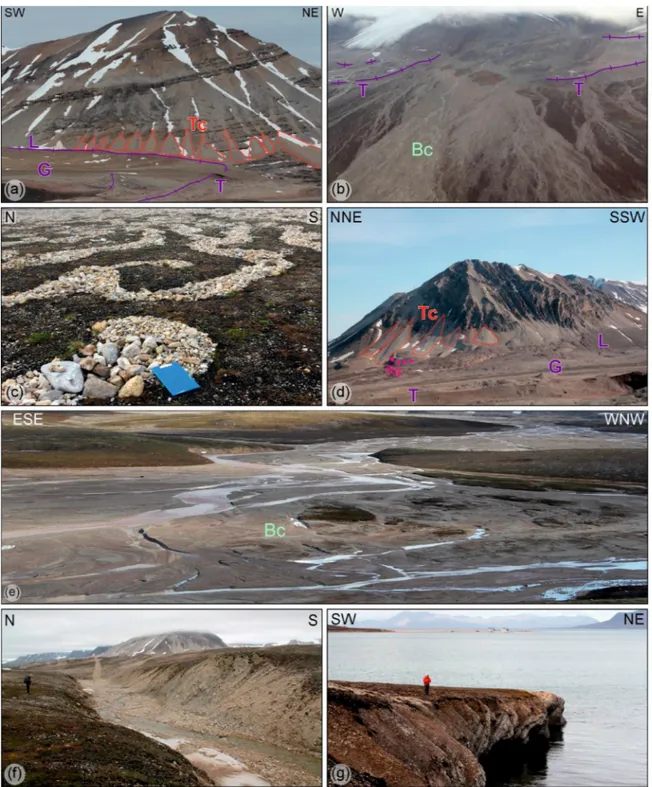
Figure 4.Quaternary deposits and landforms of the Ny-Ålesund area. (a) Terminal (T), lateral (L), and ground (G) moraines of Vestre Brøggerbreen; in the background talus cones (Tc) on the slope of Zeteligfjellet; (b) Terminal moraine (T) of the Vestre and Midtre Lovénbreen and braided channel (Bc) of the glacial outwash (Wexelva); (c) Periglacial patterned ground on the Bayelva area; (d) Talus cones (Tc) affecting the structural scarps and ridges on the slopes of Zeppelinfjellet, at the base of the slope a rock-glacier (Rg) and in the foreground the moraine (L, lateral; G, ground; T, terminal) system of the Austre Brøggerbreen; (e) Bayelva braided channel (Bc) andfluvial deposits in the Vestre Brøggerbreen and Austre Brøggerbreen glacier outwash; (f) Fluvial erosion scarps affecting the bedrock northern tributary of Bayelva; (g) Coastal cliff affecting the Kolhamna coast (airport area).
100 m wide (northern coast). The island has a ∼20 km long coastline, 2/3 of which with a rocky shoreline with steep coastal cliffs (5–20 m high) and
small pocket beaches; narrow beaches characterise the remaining 1/3 (mostly N and SW side). The W side of the island is mostly barren and rocky, while Figure 5.Orographic and hydrographic features of the Blomstrandøya area (location inFigure 1); base data from Norwegian Polan Institute (https://geodata.npolar.no/). (a) Elevation distribution and hydrography; (b) Slope distribution.
surficial deposits cover the bedrock mainly on the E sides.
Surficial deposits are scattered and thin in the W
part of the island; thin and widespread in the summit; and thicker and more continuous in the S part of the island as well as in the E and NE sector (Figure 6). A thick (up to >10–15 m) cover of recent (i.e. post-LIA) till and diamicton deposits is present in the northern coast, composing the terminal moraine of the
Blomstrandbreen glacier originally connected to the island (Figure 6a). The diamicton deposits on the S, W-NW-facing slopes and are from moderately to
heavily reworked by periglacial andfluvial processes.
A large extent of reworked till deposit (thickness up to >10 m, derived from geomorphological correlation) is present over theflat summit area and along the east-ern slope and is heavily affected by periglacial pro-cesses (Figure 6b).
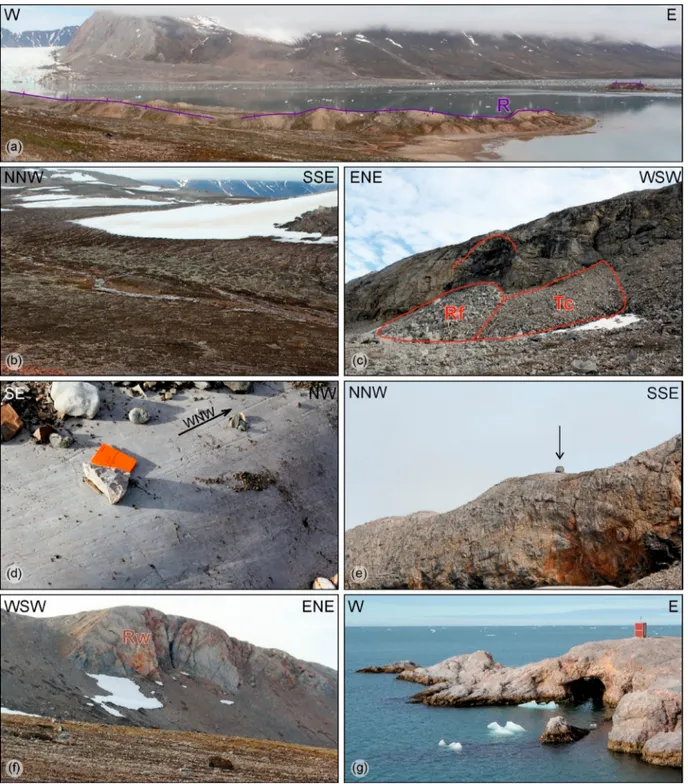
Figure 6.Quaternary deposits and landforms of the Blomstrandøya area. (a) Recessional moraine (R) related to the retreat of Blomstrandbreen in the NE side of the island (Burton et al. 2016); (b) Wide areas affected by periglacial patterned ground and solifluction evidences (on the flat summit area); (c) Rock fall (Rf)and talus cone (Tc) in the western scarp of the island; (d) Roche moutonnée on marble bedrock outlining W- to WNW-flow (SW side of the island); (e) Erratic boulder (arrow) on one of the top ridges of the island at∼170 m a.s.l.; (f) Steep rock wall on the side of the main ridges of the island (Bratliekollen, northern side of the island); (g) Coastal cliffs and caves affecting the marble rocks (western side of the island).
Along the N, NW, and S rock slopes of the island, large accumulations of talus slopes and cones and rockfall deposits are present (Figure 6c,f, and main map). At the base of steep-vertical rock scarps (NW side of the island), rockfall deposits are pre-sent. On the N side, these deposits are affected by
periglacial processes (rock glaciers-protalus
rampart).
Along the main N-S valleys,fluvial deposits result
from the rework of glacial deposits into braided chan-nels and alluvial fans.
Along the S and NW flatland surrounding the
island, the bedrock is covered by beach deposits raised at elevations up to 37–40 m a.s.l. (see main map). Along the coast narrow and discontinuous gravel beach deposits are present.
4.2.1. Geomorphological features
Blomstrandøya preserves the evidence of ancient (LGM) glacial landforms. Small scale roches mouton-nées are well preserved on the SW side of the island
and testify to a W and WNW glacier flow (Figure
6d). Erratic boulders are scattered on the island up
to the top of the summit ridges (Figure 6e), confirming
that the island was entirely ice-covered at least during the LGM. Recent (post-LIA) glacial landforms are
present on the NE side of the island. The moraine sys-tem of Blomstranbreen glacier features terminal and
recessional moraines (according to Schomacker
2011;Figure 6a), from the LIA and more recent surges episodes, connected to submerged corresponding
landforms (Burton et al. 2016; Hagen et al. 1993;
Streuff 2013).
In many areas of the island, other processes largely overprint the glacial (LGM and LIA related) land-forms. Periglacial features (i.e. patterned grounds and solifluction) mainly affect the till and diamicton
reworked deposits on the flat summit area and
along the slopes (Figure 6c). Slope landforms consist of rockfalls and talus slopes and cones, and protalus
ramparts (Figure 6c,f, and main map). During the
summer season, fluvial processes heavily rework
gla-cial deposits forming braided channels, alluvial plains and fans. The rocky shoreline (W part of the island)
features vertical cliffs on exposed bedrock with
mar-ine caves and pocket beaches (Figure 6g). On the E
side, a long cliff has developed on bedrock covered by till and diamicton deposits. Along 1/3 of the coast, narrow gravel beaches are present. Moreover, flights of raised beaches can be found up to 37–
40 m a.s.l. along the SW and NW strandflats (see
main map).
4.3. Fan-shaped landforms and talus slope distributions
The analysis of the fan-shaped landforms distribution (see De Haas et al. 2015 for a general review and
Tomczyk and Ewertowski 2017, for geomorphological mapping in other areas of Svalbard) was focused in two specific areas: northern and western rock slopes
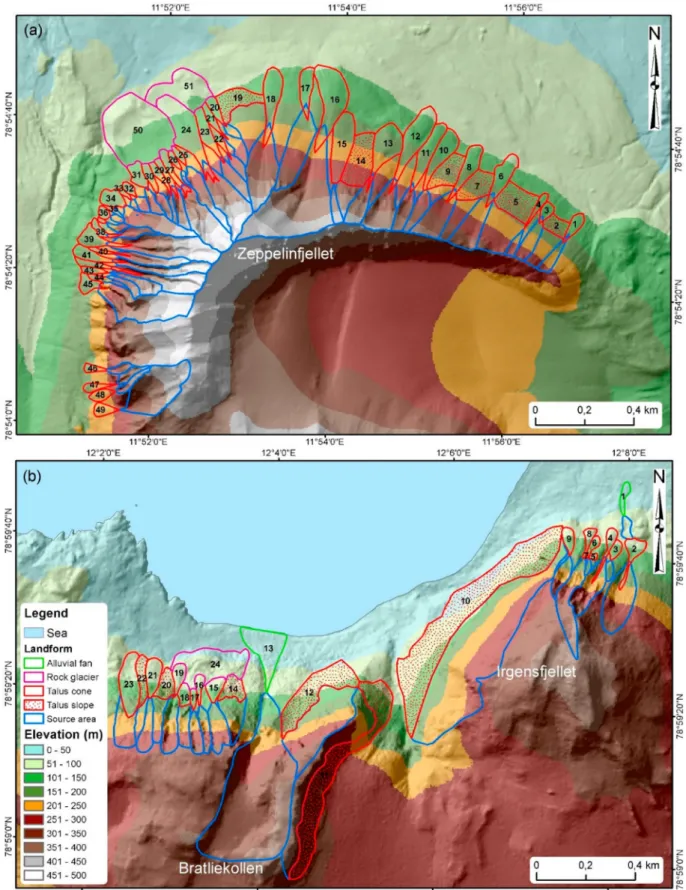
of Zeppelinfjellet (south from Ny-Ålesund, Figure 7
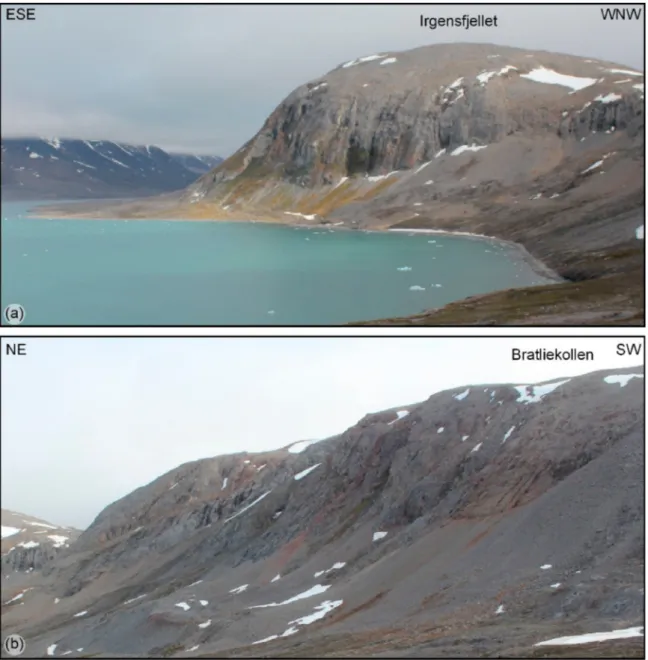
and Figure 9a) and the rock slope of Bratliekollen-Irgensfjellet (northern slope of Blomstrandøya;
Figures 8and9b).
The two sites are characterised by different types of fan-shaped landforms, including alluvial fans (debris-flows-dominated fans and fluvial-flow-dominated fans of Tomczyk and Ewertowski 2017) talus cones and wider talus slopes (colluvial fan ofTomczyk and Ewer-towski 2017), the latter mostly affected by gravitational
mass movements (Figures 7and8).
In the Zeppelinfjellet slope (Ny-Ålesund), the total volume of the slope deposits was estimated as 1,216,200 m3. The total extent of the source areas of
the sediments is 578,700 m2 for an average eroded
thickness of 2.10 m. In the Bratliekollen slope (Blom-strandøya), the total volume of the slope deposits was
estimated as 1,611,600 m3. The total extent of the
source areas of the sediments on the rock walls is
564,600 m2 for an average eroded thickness of 2.85
m. The calculated average erosion is underestimated
since part of the material is removed by runoff and
erosional processes. This calculation does not take into account and assume as zero the removed material. This assumption is consistent with the geomorpholo-gical conditions, which outline low erosional processes at the base of the studied slope (only minor tributary channels in unglaciated areas), with erosion rates in
the order of∼0.015–0.040 mm/yr (Bogen and Bønsnes
2003;1996;Svendsen, Mangerud, and Miller 1989).
Considering these limitations and the assumption, we tried to derive the expected rates of erosion along the slopes and rock walls due to gravity-driven pro-cesses, or at least a minimum possible rate. According to Henriksen et al. (2014), the Kongsfjorden glacier retreated from the fjord form 14 kyrs to 11 kyrs.
This means that at this time the rock slopes of Zeppe-linfjellet and Bratliekollen were most likely ice-free
and affected by slope processes. Assuming that the
fan-shaped landforms and talus slopes started forming at that time, the average rate of erosion of the rock slopes over the Holocene period is 0.15–0.19 mm/yr
Figure 9.Fan-shaped landforms and talus slopes distribution on (a) Zeppelinfjellet slope (Ny-Ålesund) and (b) Bratliekollen slope (Blomstrandøya); the numbers refer toTables 2and3.
for the Zeppelinfjellet slope and 0.20–0.25 mm/yr for the Bratliekollen slope.
If we include in the calculation the landforms such as rock glaciers and protalus rampart, which indeed
rework slope deposits (Berthling and Etzelmüller
2007), both in Zeppelinfjellet and Bratliekollen, the estimated eroded volumes are largely higher. In the Zeppelinfjellet slope, due to two landforms with a
total surface extent of ∼87,600 m2 and an average
thickness of ∼30 and 15 m, the additional volume is
1,119,750 m3 (estimating a ~50% of ice volume in
the rock glaciers), and the total volume of eroded
sedi-ments is 2,335,950 m3. This means an average eroded
thickness of 4.04 m. Consequently, the average rate of
erosion over the Holocene period increases to 0.29–
0.37 mm/yr. In the Bratliekollen slope, a landform
with a surface extent of ∼49,000 m2 and an average
thickness of∼20 m is present. The additional volume
is 490,000 m (again estimating a ~50% of ice volume)3, and the total volume of eroded sediments is 2,101,600 m3. The average eroded thickness reaches the value of 3.72 m, and the rate of erosion over the Holocene
period increases to 0.27–0.34 mm/yr. The
underesti-mation of these values due to the sediment transfer and removal from the fan-shaped landforms can be roughly 4–8% (∼0.011–0.029 mm/yr over 0.27– 0.37 mm/yr).
5. Conclusions
The geomorphological analysis carried out in the
Kongsfjorden area, integratingfield and remote
inves-tigations, yielded: (1) the geomorphological maps of Ny-Ålesund area and the Blomstrandøya, and (2) a specific analysis of the slope processes along rock slopes.
The geomorphological maps led to the comprehen-sion of the distribution of landforms in different para-glacial environments from recently deglaciated areas,
after the LIA (1800–2000; i.e. Austre and Vestre
Brøggerbreen glacier front and Bayelva, Ny-Ålesund; northern Blomstrandøya) to ancient deglaciated areas, after LGM (Late Pleistocene-Early Holocene; i.e. the entire Blomstrandøya, the Ny-Ålesund stran-dflat and rock slopes). The main terrestrial glaciers are present-day remnants of the massive, composite, Table 2. Fan-shaped landforms and talus slopes on (a)
Zeppelinfjellet slope (Ny-Ålesund).
Id Type Area (m2) Extimated Thickness (m) Extimated volume (m3) Source Area (m2) 1 Talus cone 4365 3 13095 5386 2 Talus slope 6400 2 12800 11062 3 Talus cone 3089 2 6178 8754 4 Talus cone 2692 3 8076 3066 5 Talus slope 17725 3 53175 23878 6 Talus cone 10890 5 54450 18799 7 Talus slope 12722 3 38166 10784 8 Talus cone 10217 5 51085 18190 9 Talus slope 12689 3 38067 4423 10 Talus cone 12169 4 48676 8147 11 Talus cone 13203 5 66015 9164 12 Talus cone 20136 5 100680 18230 13 Talus cone 16861 10 168610 11226 14 Talus slope 20691 4 82764 8352 15 Talus cone 19460 4 77840 4362 16 Talus cone 26834 15 402510 81273 17 Talus cone 8148 5 40740 27018 18 Talus cone 14675 8 117400 30337 19 Talus slope 13565 3 40695 19423 20 Talus cone 3852 5 19260 2362 21 Talus cone 3545 5 17725 5919 22 Talus cone 3001 5 15005 4059 23 Talus cone 8461 6 50766 8252 24 Talus cone 27367 15 410505 27147 25 Talus cone 1850 5 9250 12323 26 Talus cone 1867 5 9335 1023 27 Talus cone 5309 5 26545 25734 28 Talus cone 3574 4 14296 6669 29 Talus cone 3193 4 12772 2312 30 Talus cone 3489 30 104670 3999 31 Talus cone 5518 6 33108 4067 32 Talus cone 2033 8 16264 2851 33 Talus cone 1003 5 5015 1036 34 Talus cone 5931 10 59310 17738 35 Talus cone 480 5 2400 667 36 Talus cone 1924 7 13468 1359 37 Talus cone 518 5 2590 2148 38 Talus cone 2740 5 13700 5570 39 Talus cone 8007 18 144126 33248 40 Talus cone 1593 4 6372 10599 41 Talus cone 6388 10 63880 13506 42 Talus cone 4194 5 20970 19200 43 Talus cone 2403 4 9612 7073 44 Talus cone 1061 4 4244 3834 45 Talus cone 4657 7 32599 38547 46 Talus cone 2101 5 10505 2921 47 Talus cone 2702 5 13510 3837 48 Talus cone 3452 5 17260 3549 49 Talus cone 3538 5 17690 36264 50 Rock glacier– pr. rampart 61,700 30 1,851,000 51 Rock glacier– pr. rampart 25,900 15 388,500
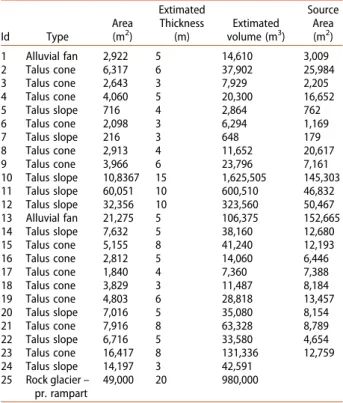
Table 3. Fan-shaped landforms and talus slopes on Bratliekollen slope (Blomstrandøya).
Id Type Area (m2) Extimated Thickness (m) Extimated volume (m3) Source Area (m2) 1 Alluvial fan 2,922 5 14,610 3,009 2 Talus cone 6,317 6 37,902 25,984 3 Talus cone 2,643 3 7,929 2,205 4 Talus cone 4,060 5 20,300 16,652 5 Talus slope 716 4 2,864 762 6 Talus cone 2,098 3 6,294 1,169 7 Talus slope 216 3 648 179 8 Talus cone 2,913 4 11,652 20,617 9 Talus cone 3,966 6 23,796 7,161 10 Talus slope 10,8367 15 1,625,505 145,303 11 Talus slope 60,051 10 600,510 46,832 12 Talus slope 32,356 10 323,560 50,467 13 Alluvial fan 21,275 5 106,375 152,665 14 Talus slope 7,632 5 38,160 12,680 15 Talus cone 5,155 8 41,240 12,193 16 Talus cone 2,812 5 14,060 6,446 17 Talus cone 1,840 4 7,360 7,388 18 Talus cone 3,829 3 11,487 8,184 19 Talus cone 4,803 6 28,818 13,457 20 Talus slope 7,016 5 35,080 8,154 21 Talus cone 7,916 8 63,328 8,789 22 Talus slope 6,716 5 33,580 4,654 23 Talus cone 16,417 8 131,336 12,759 24 Talus slope 14,197 3 42,591 25 Rock glacier– pr. rampart 49,000 20 980,000
W-NWflowing, valley glacier that occupied Kongsf-jorden during the LGM. At that time, the entire
fjord was ice-filled up to the top of Blomstrandøya,
which can be considered as a large scale roches mou-tonnées and whose overall shape (gentle E-SE slopes; steep NW escarpments) and locally preserved roches
moutonnées confirm a W-NW flow. They have been
retreating from the main valleys with alternating stages of ice advance and surges (e.g. LIA and in the last century, Burton et al. 2016; Hagen et al. 1993;
Hormes, Gjermundsen, and Rasmussen 2013 and references therein). The ancient glacial landforms are overprinted by periglacial (i.e. patterned ground), fluvial (i.e. alluvial plains and braided channels), and slope landforms (i.e. talus cones and slopes). In the Blomstrandøya SW strandflat, remnants of a sequence of raised beaches are preserved up to 37–40 m a.s.l., whose uplift is related to the postglacial retreat iso-static rebound, confirming the sequence of raised bea-ches well documented in the Brøggeralvøya NW
termination (e.g. by Forman 1990; Forman, Mann,
and Miller 1987). A strong glacier retreat occurred over the last decades and was calculated as high as ∼30 m/yr from 1998 to 2015 (in Austre-Vestre Brøggerbreen), and is consistent with the previous cal-culations (e.g.Burton et al. 2016;Gjermundsen et al. 2013;Hagen et al. 1993;Svendsen et al. 2002).
Finally, the analysis of the rock slopes and related deposits of Zeppelinfjellet (Ny-Ålesund) and Bratlie-kollen (Blomstrandøya) allowed to infer the average rate of erosion over the Holocene. Assuming that the slopes were ice-free and affected by slope processes
from 14 kyrs to 11 kyrs (according to Henriksen
et al. 2014), the estimated erosion rate is 0.15–
0.19 mm/yr for the Zeppelinfjellet slope and 0.20–
0.25 mm/yr for the Bratliekollen slope. Including into the calculation the periglacial slope landforms, the average rate of erosion over the Holocene raises to 0.29–0.37 mm/yr, in the Zeppelinfjellet slope, and 0.27–0.34 mm/yr, in the Bratliekollen slope (with an
underestimation of∼4–8%). These estimated erosion
rates along the rock walls are very high taking into account that different strong lithologies are considered (i.e. conglomerate, sandstone and shale with lime-stone, dolomite in the Zeppelinfjellet slope; marbles in Bratliekollen slope). However, the values are largely consistent with the rock walls erosion rates connected with postglacial relaxation processes (André 1997), as
found in the Prins Karls Forland, just offshore the
Kongsforden (i.e. 0.13–0.64 mm/yr, Berthling and
Etzelmüller 2007). They are even close to the highest rock wall erosion rates measured in arctic environ-ments (Siewert et al. 2012) and can also be affected by rock permafrost changes.
This study confirms geomorphological mapping
integratingfield and remote investigations as an effec-tive tool, particularly at high latitudes in poorly
vegetated terrains, in the comprehension of landscape changes in the paraglacial environment. For this
reason, in this case, a specific analysis was focused
on the slope gravity-driven landforms, which record the effects of deglaciation on the main mountain slopes. This allows the identification of post-deglacia-tion slope evolupost-deglacia-tion and provides a comparison to rock slopes in other present or past mountain and cold environments.
Software
The map presented in this work was produced in the Geographic Information System ArcGIS® 10.6.1 (ESRI).
Acknowledgments
The authors wish to thank the Reviewers Aleksandra Tomc-zyk, Denis Mercier, and Chris Orton, as well as the Associ-ated Editor Jasper Knight, whose preciuìous suggestions and comments helped us to improve the map and manuscript. The authors are grateful to CNR-Italy for supporting this research activity, particularly the Department of Earth Sys-tem Science and Environmental Technologies, the Polarnet, and the Institute of environmental geology and geoengi-neering (IGAG). Special thanks also go also to the ‘Dirigi-bile Italia’ Station, CNR-Italy (particularly to R. Sparapani and E. Liberatori) for the outstanding logistic support during all the field work. A great support was provided also by Christiane Hübner (SSF) and by Kings Bay AS. The authors are particularly grateful for the fruitful discus-sion with A. Hormes and H. Linge, Project HolS, Holocene environmental change on Svalbard (RIS 5842). This work was carried out as part of the RIS 10150 project (http:// www.researchinsvalbard.no/). The digital elevation models, aerial images and orthophotos used in this work where pro-vided by the Norwegian Polar Institute.
Disclosure statement
No potential conflict of interest was reported by the author (s).
Funding
This work was supported by the Norwegian Research Coun-cil (SSG 2016 grant, SLOPES project RIS 10150, P.I. I.T. Berthling) and by the ‘G. d’Annunzio’ Chieti Pescara funds (E. Miccadei funds).
ORCID
Ivar T. Berthling http://orcid.org/0000-0003-0003-1651 Claudio Berti http://orcid.org/0000-0001-6453-2645 Vania Mancinelli http://orcid.org/0000-0001-6594-828X Laura Stendardi http://orcid.org/0000-0002-9802-8962 Tommaso Piacentini http://orcid.org/0000-0002-5007-7677
References
André, M. F. (1997). Holocene rockwall retreat in Svalbard: A triple-rate evolution. Earth Surface Processes and Landforms, 22(5), 423–440. https://doi.org/10.1002/ (SICI)1096-9837(199705)22:5<423::AID-ESP706>3.0. CO;2-6
André, M. F. (2009). From climatic to global change geo-morphology: Contemporary shifts in periglacial geomor-phology. Geological Society Special Publication, 320(1), 5– 28.https://doi.org/10.1144/SP320.2
Ballantyne, C. K. (2002). Paraglacial geomorphology. Quaternary Science Reviews, 21(18-19), 1935–2017. https://doi.org/10.1016/S0277-3791(02)00005-7
Bergh, S., Maher, H., & Braathen, A. (2000). Tertiary divergent thrust directions from partitioned transpression, Brøggerhalvøya, Spitsbergen. Norsk Geologisk Tidsskrift, 80 (2), 63–81.https://doi.org/10.1080/002919600750042573 Bernard, E., Friedt, J. M., Schiavone, S., Tolle, F., & Griselin,
M. (2018). Assessment of periglacial response to increased runoff: An Arctic hydrosystem bears witness. Land Degradation & Development, 29(10), 3709–3720. https://doi.org/10.1002/ldr.3099
Berthling, I. T., & Etzelmüller, B. (2007). Holocene rockwall retreat and the estimation of rock glacier age, Prins Karls Forland, Svalbard. Geografiska Annaler, Series A: Physical Geography, 89(1), 83–93. https://doi.org/10.1111/j.1468-0459.2007.00309.x
Bogen, J., & Bønsnes, T. E. (2003). Erosion and sediment transport in High Arctic rivers. Svalbard Polar Research, 22(2), 175–189.https://doi.org/10.3402/polar.v22i2.6454 Boike, J, Juszak, I, Lange, S, Chadburn, S, Burke, E, Paul
Overduin, P, Roth, K, Ippisch, O, Bornemann, N, Stern, L, Gouttevin, I, Hauber, E, & Westermann, S. (2018). A 20-year record (1998-2017) of permafrost, active layer and meteorological conditions at a high Arctic perma-frost research site (Bayelva, Spitsbergen). Earth System Science Data, 10(1), 355–390.
Bourriquen, M., Mercier, D., Baltzer, A., Fournier, J., Costa, S., & Roussel, E. (2018). Paraglacial coasts responses to glacier retreat and associated shifts in river floodplains over decadal timescales (1966–2016), Kongsfjorden, Svalbard. Land Degradation & Development, 29(11), 4173–4185.https://doi.org/10.1002/ldr.3149
Burton, D. J., Dowdeswell, J. A., Hogan, K. A., & Noormets, R. (2016). Marginalfluctuations of a Svalbard surge-type tidewater glacier, Blomstrandbreen, since the Little Ice Age: A record of three surges. Arctic, Antarctic, and Alpine Research, 48(2), 411–426. https://doi.org/10. 1657/AAAR0014-094
Church, M., & Ryder, J. M. (1972). Paraglacial sedimen-tation: Consideration of fluvial processes conditioned by glaciation. Geological Society of America Bulletin, 83 (10), 3059–3072. https://doi.org/10.1130/0016-7606 (1972)83[3059:PSACOF]2.0.CO;2
Cianfarra, P., & Salvini, F. (2015). Lineament domain of regional strike-slip corridor: Insight from the neogene transtensional de geer transform fault in NW spitsbergen. Pure and Applied Geophysics, 172(5), 1185–1201.https:// doi.org/10.1007/s00024-014-0869-9
Cianfarra, P., & Salvini, F. (2016). Quantification of fractur-ing within fault damage zones affectfractur-ing Late Proterozoic carbonates in Svalbard. Rendiconti Lincei, 27(S1), 229– 241.https://doi.org/10.1007/s12210-016-0527-5
De Haas, T., Kleinhans, M. G., Carbonneau, P. E., Rubensdotter, L., & Hauber, E. (2015). Surface
mor-phology of fans in the high-Arctic periglacial
environment of Svalbard: Controls and processes. Earth Science Reviews, 146, 163–182. https://doi.org/10.1016/j. earscirev.2015.04.004
Esri, Maxar, Earthstar Geographics. (2015). CNES/Airbus DS, USDA FSA, USGS, Aerogrid, IGN, IGP, and the GIS User Community (Date 2015-07-15; Resolution 0,50 m; Accuracy 10,20 m; Data Source WV02.
Etienne, S., Mercier, D., & Voldoire, O. (2008). Temporal scales and deglaciation rhythms in a polar glacier margin, Baronbreen, Svalbard. Norsk Geografisk Tidsskrift –
Norwegian Journal of Geography, 62(2), 102–114.
https://doi.org/10.1080/00291950802095111
Etzelmüller, B., Ødegard, R. S., & Sollid, J. L. (2003). The spatial distribution of coast types on Svalbard. In V. Rachold et al (Eds.), Arctic coastal Dynamics: Report of the 3rd international Workshop University of Oslo (Norway) 25 December 2002 (pp. 33–40). Berichte zur Polarforschung und Meereforschung 443.
Evans, D. J. A., Strzelecki, M., Milledge, D. G., & Orton, C. (2012). Hørbyebreen polythermal glacial landsystem, Svalbard. Journal of Maps, 8(2), 146–156. https://doi. org/10.1080/17445647.2012.680776
Forman, S. L. (1990). Post-glacial relative sea-level history of northwestern Spitsbergen, Svalbard. Geological Society of America Bulletin, 102(11), 1580–1590.https://doi.org/10. 1130/0016-7606(1990)102<1580:PGRSLH>2.3.CO;2 Forman, S. L., Lubinski, D. J., Ingolfsson, O., Zeeberg, J. J.,
Snyder, J. A., Siegert, M. J., & Matishov, G. G. (2004). A review of postglacial emergence on Svalbard, Franz Josef Land and Novaya Zemlya, northern Eurasia. Quaternary Science Reviews, 23(11-13), 1391–1434. https://doi.org/ 10.1016/j.quascirev.2003.12.007
Forman, S., Mann, D., & Miller, G. (1987). Late Weichselian
and Holocene relative sea-level history of
Bröggerhalvöya, Spitsbergen. Quaternary Research, 27 (1), 41–50. https://doi.org/10.1016/0033-5894(87)90048-2
Gjermundsen, E. F., Briner, J. P., Akçar, N., Salvigsen, O., Kubik, P., Gantert, N., & Hormes, A. (2013). Late Weichselian local ice dome configuration and chronology in Northwestern Svalbard: Early thinning, late retreat. Quaternary Science Reviews, 72, 112–127. https://doi. org/10.1016/j.quascirev.2013.04.006
Hagen, J., Liestøl, O., Roland, E., & Jørgensen, T. (1993). Glacier atlas of Svalbard and Jan Mayen. Nor. Polarinst. Medd, 129, 141 pp.
Hallet, B. (2013). Stone circles: Form and soil kinematics. Philosophical Transactions of the Royal Society A: Mathematical, Physical and Engineering Sciences, 371 (2004), 20120357.https://doi.org/10.1098/rsta.2012.0357 Hallet, B., & Prestrud, S. (1986). Dynamics of periglacial sorted circles in Western Spitsbergen. Quaternary Research, 26(1), 81–99. https://doi.org/10.1016/0033-5894(86)90085-2
Hasholt, B. (1996). Sediment transport in Greenland. IAHS-AISH Publication, 236, 105–114.
Henriksen, M., Alexanderson, H., Landvik, J. Y., Linge, H., & Peterson, G. (2014). Dynamics and retreat of the Late Weichselian Kongsfjorden ice stream, NW Svalbard. Quaternary Science Reviews, 92, 235–245. https://doi. org/10.1016/j.quascirev.2013.10.035
Hjelle, A. (1993). Geology of Svalbard. Polarha°ndbok 7. Norwegian Polar Institute.
Hjelle, A., Piepjohn, K., Saalmann, K., Ohta, Y., Salvigsen, O., Thiedig, F., & Dallmann, W. (1999). Geological map
of Svalbard 1:100.000 Sheet A7G Kongsfjorden.
Hormes, A., Gjermundsen, E. F., & Rasmussen, T. L. (2013). From mountain top to the deep sea - deglaciation in 4D of the northwestern Barents Sea. Quaternary Science Reviews, 75, 78–99. https://doi.org/10.1016/j.quascirev. 2013.04.009
Humlum, O., Instanes, A., & Sollid, J. L. (2003). Permafrost in Svalbard: A review of research history, climatic back-ground and engineering challenges. Polar Research, 22 (2), 191–215.https://doi.org/10.3402/polar.v22i2.6455 Joly, P. F. (1969). Carte Géomorphologique de reconnaissance
de la presqu’île de Brögger (Spitsberg). 1:50.000. Service de documentation et de cartographie géographiques du C.N.R.S. Institut du Géographie. Paris.
Kääb, A., Ramuntcho Girod, L. M., & Berthling, I. T. (2014). Surface kinematics of periglacial sorted circles using structure-from-motion technology. The Cryosphere, 8 (3), 1041–1056.https://doi.org/10.5194/tc-8-1041-2014 Laffly, D., & Mercier, D. (2002). Global change and
paragla-cial morphodynamic modification in Svalbard.
International Journal of Remote Sensing, 23(21), 4743– 4760.https://doi.org/10.1080/01431160110113872 Leever, K. A., Gabrielsen, R. H., Faleide, J. I., & Braathen, A.
(2011). A transpressional origin for the West Spitsbergen fold-and-thrust belt: Insight from analog modelling.
Tectonics, 30, TC2014. https://doi.org/10.1029/
2010TC002753
Lehmann, S. J., & Forman, S. L. (1992). Late Weichselian Glacier Retreat in Kongsfjorden, West Spitsbergen, Svalbard. Quaternary Research, 37(2), 139–154. https:// doi.org/10.1016/0033-5894(92)90078-W
Mercier, D., Étienne, S., Sellier, D., & André, M. F. (2009). Paraglacial gullying of sediment-mantled slopes: A case
study of Colletthøgda, Kongsfjorden area, west
Spitsbergen (Svalbard). Earth Surface Processes and Landforms, 34(13), 1772–1789. https://doi.org/10.1002/ esp.1862
Mercier, D., & Laffly, D. (2005). Actual paraglacial progra-dation of the coastal zone in the Kongsfjorden area, West Spitsbergen (Svalbard). In C. Harris, & J. Murton (Eds.), Cryospheric systems: Glaciers and permafrost, Special Publication, 242 (pp. 111–117). Geological Society. https://doi.org/10.1144/GSL.SP.2005.242.01.10
Miccadei, E., Piacentini, T., & Berti, C. (2016). Geomorphological features of the Kongsfjorden area: Ny-Ålesund, Blomstrandøya (NW Svalbard, Norway). Special Issue on environmental changes in the Arctic. Rend. Fis. Acc. Lincei, 27(S1), 217–228.https://doi.org/ 10.1007/s12210-016-0537-3
Moreau, M., Mercier, D., Laffly, D., & Roussel, E. (2008). Impacts of recent paraglacial dynamics on plant coloniza-tion: A case study on midtre Lovénbreen foreland, Spitsbergen (79°N). Geomorphology, 95(1-2), 48–60. https://doi.org/10.1016/j.geomorph.2006.07.031
Oliva, M., Mercier, D., Ruiz-Fernández, J., & McColl, S. (2019). Paraglacial processes in recently deglaciated environments. Land Degradation & Development, 1–6. https://doi.org/10.1002/ldr.3283
Pekala, K. (2004). Geomorphological mapping, Wedel Jarlsberg Land, Svalbard, Version 1. NSIDC: National Snow and Ice Data Center.
Rubensdotter, L., Larsen, E., & Lyså, A. (2016). Quaternary geological and geomorphological map, Svea, Svalbard. M 1:15.000. Geological Survey of Norway. https://www. ngu.no/upload/Publikasjoner/Kart/Svalbard/KV15_ Svea_Svalbard.pdf
Rubensdotter, L., Stalsberg, K., Christiansen, H.,
Eckerstorfer, M., & Trøyen, P. (2015). Landforms and
sediments in Todalen and upper Gangdalen and Bødalen, Svalbard. Scale 1:25 000. Geological Survey of Norway. http://www.ngu.no/upload/Publikasjoner/Kart/ Svalbard/kart_todalen_engelsk.pdf
Schomacker, A. (2011). Moraine. In V. P. Singh, P. Singh, & Haritashya (Eds.), U.K. encyclopedia of snow, ice and gla-ciers (pp. 747–756). Springer.
Sessford, E., & Hormes, A. (2013). Quaternary geological
and geomorphological maps of Fredheim and
Scansbukta. Norwegian Polar Institute Report, Serie 142. Siewert, M. B., Krautblatter, M., Christiansen, H. H., &
Eckerstorfer, M. (2012). Arctic rockwall retreat rates esti-mated using laboratory-calibrated ERT measurements of talus cones in Longyeardalen, Svalbard. Earth Surface Processes and Landforms, 37(14), 1542–1555.https://doi. org/10.1002/esp.3297
Slaymaker, O. (2009). Proglacial, periglacial or paraglacial? In J. Knight, & S. Harrison (Eds.), Periglacial and paragla-cial processes and environments, Speparagla-cial Publication 320 (pp. 71–84). The Geological Society.
Slaymaker, O. (2011). Criteria to distinguish between peri-glacial, proglacial and paraglacial environments. Quaestiones Geographicae, 30(1), 85–94.https://doi.org/ 10.2478/v10117-011-0008-y
Streuff, K. (2013). Landform assemblages in inner Kongsfjorden, Svalbard: Evidence of recent glacial (surge)
activity [Master thesis] Faculty of Science and
Technology Department of Geology, University of Tromso. Strzelecki, M. C., Szczuciński, W., Dominiczak, A., Zagórski, P., Dudek, J., & Knight, J. (2020). New fjords, new coasts, new landscapes: The geomorphology of para-glacial coasts formed after recent glacier retreat in Brepollen (Hornsund, southern Svalbard). Earth Surface Processes and Landforms, 45(5), 1325–1334.https://doi. org/10.1002/esp.4819
Sund, M., & Eiken, T. (2010). Recent surges on Blomstrandbreen, Comfortlessbreen and Nathorstbreen, Svalbard. Journal of Glaciology, 56(195), 182–184. https://doi.org/10.3189/002214310791190910
Svendsen, H., Beszczynska-Møller, A., Hagen, J. O.,
Lefauconnier, B., Tverberg, V., Gerland, S.,…
Dallmann, W. (2002). The physical environment of Kongsfjorden–Krossfjorden, an Arctic fjord system in Svalbard. Polar Research, 21, 133–166. https://doi.org/ 10.1111/j.1751-8369.2002.tb00072.x
Svendsen, J. I., Mangerud, J., & Miller, G. H. (1989). Denudation rates in the Arctic estimated from lake
sedi-ments on Spitsbergen, Svalbard. Palaeogeography,
Palaeoclimatology, Palaeoecology, 76(1–2), 153–168. https://doi.org/10.1016/0031-0182(89)90108-9
Thiedig, F., & Manby, M. (1992). Origins and deformation of post-Caledonian sediments on Blomstrandhalvøya
and Lovenøyane, northwest Spitsbergen. Norsk
Geologisk Tidsskrift, 72, 27–33.
Tolgensbakk, J., & Sollid, J. L. (1987). Kvadehuksletta, geo-morfologi og kvartaergeologi, 1:10.000. Geografisk Institutt i Oslo.
Tolgensbakk, J., Sørbel, L., & Høgvard, K. (2001). Geomorphological and Quaternary geological map of Svalbard 1:100,000, sheet C9Q Adventdalen. Norvegian Polar Institute.
Tomczyk, A. M., & Ewertowski, M. W. (2017). Surface morphological types and spatial distribution of fan-shaped landforms in the periglacial high-Arctic environ-ment of central Spitsbergen, Svalbard. Journal of Maps, 13 (2), 239–251. https://doi.org/10.1080/17445647.2017. 1294543